Quality control and data correction in high-throughput screening Dmytro Kevorkov and Vladimir Makarenkov Département d'informatique, Université du Québec à Montréal, Case postale 8888, succursale Centre-ville Montréal (Québec) Canada, H3C 3P8 Courriels :
[email protected],
[email protected]
ABSTRACT High-throughput screening (HTS) plays a central role in modern drug discovery, allowing for testing of more than 100,000 compounds per screen. Often compounds are screened only once and quality of measurements has a significant influence on the hit selection. We have developed an effective statistical procedure to control quality of HTS assays. It is intended to detect systematic errors in HTS measurements and make correction of experimental data. An experimental assay from the McMaster HTS laboratory was examined in this paper. We identified and studied systematic errors present in this dataset. The correction of the experimental data significantly improved the hit distribution for this assay.
KEYWORDS: High-throughput screening, quality control, systematic error, data correction.
1
Introduction
Quality control is an important part of the data analysis in the high-throughput screening (HTS). HTS is a modern and effective technology for drug discovery, allowing for rapid screening of large compound collections against a variety of putative drug targets. A typical HTS operation in the pharmaceutical industry allows for screening of more than 100,000 compounds per screen and generates approximately 50 million data points per year [HEU 02]. HTS operates with samples in microliter volumes that are arranged in two-dimensional plates. A typical HTS plates contain 96 (12×8) or 352 (22×16) samples. The hit selection procedure in primary HTS screens is mainly performed by automatic routines. Hits can be defined as positive signals that represent biologically or chemically active compounds. These compounds are potential targets for drag discovery. Quality of measurements is extremely important for a correct hit selection. Random and systematic errors can cause a misinterpretation of HTS signals. They can induce either underestimation (false negatives) or overestimation (false positives) of measured signals. Various methods dealing with quality control, data correction and hit selection are available in the scientific literature. These methods are discussed in details in the papers by Heuer et al. [HEU 02], Gunter et al. [GUN 03], Brideau et al. [BRI 03], Heyse [HEY 02], and Zhang et al. [ZHA 99, ZHA 00]. However, statistical methods that analyze and remove systematic errors in HTS assays are poorly developed
1
compared to those dealing with microarrays. There are various sources of systematic errors. Some of them are mentioned in the article of Heuer et al. [HEU 02]: • Systematic errors caused by ageing, reagents evaporation or decay of cells can be recognized as smooth trends in the plate’s means/medians; • Errors in liquid handling and malfunction of pipettes can also generate localized deviations of expected data values; • Variation in incubation time, time drift in measuring different wells or different plates, and reader effects may be recognized as smooth attenuations of measurement over an assay. Heuer et al. [HEU 02] and Brideau et al. [BRI 03] demonstrated examples of systematic signal variations that are present in all plates of an assay. For instance, Brideau et al. [BRI 03] illustrates a systematic error caused by the positional effect of detector. Throughout the entire screening campaign involving more than 1000 plates, signal values in Row A were on average 14% lower than those in Row P (see Brideau et al. [BRI 03], Figure 1). In this article, we present a new effective statistical procedure, allowing one to detect systematic errors in HTS assays and minimize their impact on the hit selection procedure.
2 2.1
Experimental procedure and results Experimental data
We have selected for evaluation an HTS assay created and made available at the HTS Laboratory of the McMaster University. This assay was proposed as a benchmark for Data Mining and Docking Competition (http://hts.mcmaster.ca/HTSDataMiningCompetition.htm). It consists of a screen of compounds that inhibit the Escherichia coli dihydrofolate reductase. The dataset and the detailed description of the experimental procedure are available at: http://hts.mcmaster.ca/Competition_1.html. The assay consists of 1248 plates. Each plate contains measurements for 80 testing compounds arranged in 8 rows and 10 columns.
2.2
Data classification
The experimental data should be properly classified to carry out a correct statistical analysis. The screened samples can be divided into two groups. The first group contains inactive samples. The majority of samples in primary screens are inactive. Since they are inactive, they should have close average values (measured for a sufficient number of plates) and the values variability is caused mainly by random or systematic errors. The second group contains active samples and outliers. Their values differ substantially from the inactive ones. The values of active samples are caused by a biochemical reaction and can be classified as hits. The values of outliers are caused by random errors and should be disqualified from the analysis.
2.3
Statistical analysis and data correction
Ideally, inactive samples have similar values and generate a plane surface. In a real case, random errors produce residuals. For a large number of plates considered, the residuals should compensate each other during the computation of the mean values at each well. Systematic errors generate repeatable local artifacts and smooth global drifts at the assay surface. To carry out the analysis and correction of experimental HTS data, the following steps have been carried out: • Logarithmic transformation of raw HTS data; • Plate normalization for all samples; • Analysis of hit distribution for raw data; • Hit and outlier elimination; • Plate normalization of inactive samples (Normalization I);
2
• Well normalization of inactive samples (Normalization II); • Data correction; • Plate normalization for all samples; • Analysis of hit distribution for corrected data; Because the data under study have a Gaussian distribution, we first performed a logarithmic transformation of raw data, and then normalized values in plates using Normalization to Zero Mean and Unit Standard Deviation, which is as follows:
x −µ x'i = i ,
(1)
σ
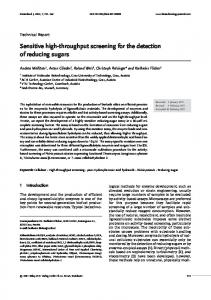
where xi = log(xraw) - input element, xraw - raw element, x'i - normalized output element, µ - mean value, σ - standard deviation. The output data conditions will be µx’ = 0 and σ x’ = 1. This pre-processing is necessary to compare and sum measurements in different plates; the detailed discussion can be found in the paper by Kevorkov and Makarenkov [KEV 04]. The presence of systematic error in an assay can be detected by analyzing its hit distribution surface. From a statistical point of view, hits should be distributed evenly over the hit distribution surface. We selected as hits experimental values that deviated from the plate means for more than 1σ ; this is a common strategy for hit selection in HTS data analysis. The significant variation of the hit numbers shown in Figure 1a proves the presence of systematic errors in the experimental dataset. (b)
300
300
250
250
Number of hits
Number of hits
(a)
200 150 100
200 150 100 50
50
0
0 1
7 3
5 5
Column
3
7 9
1
1
7 3
5
5
Row
Column
3
7 9
Row
1
Figure 1. Hit distribution surfaces for the McMaster data (1248 plates): (a) raw data and (b) corrected data
In order to remove systematic error we analyzed inactive samples only. As we mentioned above they should have similar average values. As inactive were selected the values that deviated from the plate mean for less than 3σ ; hit and outliers beyond the 3σ threshold were removed from the analysis. We normalized the inactive samples in plates using the Normalization to Zero Mean and Unit Standard Deviation (Normalization I). The normalized values of inactive samples should be close to zero. Then, we analyzed the arrays of values for each specific well over all plates. An example of such an array is presented in Figure 2. It demonstrates fluctuation of inactive values after Normalization I for the well located in column 1 and row 8. The deviation of the mean value (equal to -0.37) from zero level can be interpreted as an impact of systematic error. The fluctuations of values around of the array mean can be interpreted as an influence of random errors. The values at the wells containing an important systematic error demonstrated substantial deviations from zero level. In order to remove the effect of systematic errors we normalized (using the Normalization to Zero Mean and Unit Standard Deviation) well values over all 1248 plates (Normalization II). Normalization II moved the mean well value to zero level and fitted the standard deviation to unity.
3
Figure 2. Variation of values in different plates for well in column 1 and row 8 (1248 plates).
The parameters used in Normalization I and II were employed to modify the complete dataset, i.e. both active and inactive samples were transformed by the same procedures and using the same parameters as the dataset of inactive samples. Then, we normalized the corrected values in plates and reexamined the hit distribution surface presented in Figure 1b. The hit distribution for the corrected data demonstrates significant improvements compared to the raw data. The minimum and maximum numbers of hits for the corrected dataset were 110 and 177, respectively, compared to 36 and 298 for the raw data. The hit distributions by columns and rows are presented in Figure 3. Figure 3a (white columns) shows that values for the raw dataset systematically decrease from column 3 to column 10. The average number of hits per well in column 3, computed over 1248 plates, was 209. In contrast, the average number of hits per well in column 10 was only 65. Figure 3b demonstrates an important difference between the number of hits on the edges and in the middle of the plates for the raw data. The average number of hits per well in row 2 was 202, whereas in row 4 there were only 98 hits per well. Such a difference is unlikely due to random errors and, in our opinion, caused by systematic error of the measurements. The corrected dataset (black columns) provides a much better hit distribution: the average number of hits per well in column 3 was 154 and in column 10 was 123, whereas the average number of hits per well in row 2 was 163 and in row 4 was 130. Thus, the comparison of hit distributions for raw and corrected datasets demonstrated that the impact of systematic errors on raw data was significantly minimized after the correction proposed. 250
250
Raw data
Corrected data
Mean number of hits per well
Mean number of hits per well
Raw data 200
150
100
50
0
Corrected data
200
150
100
50
0
1
2
3
4
5
6
Column
7
8
9
10
1
2
3
4
5
6
7
8
Row
Figure 3. Hit distribution by columns and rows for the McMaster HTS assay (1248 plates).
4
3
Conclusion
In this paper we described a method for the quality control and data correction in high throughput screening. The described method enables one to analyze experimental HTS data, detect the presence of systematic error and correct trends and local fluctuations of the background surface. We examined experimental data from the McMaster HTS laboratory. The analysis of the hit distribution showed the presence of systematic errors in this dataset. Using the new method, we examined and corrected HTS assay containing 1248 plates. The analysis of the raw and corrected datasets demonstrated that the proposed procedure is able to improve the hit distribution. The impact of systematic error on measured values was significantly minimized after the correction. The software allowing researches to carry out the background evaluation analysis of HTS data is available upon request (distributed as a Windows console application and its C++ source code). A graphical version of this software will be freely available at our website (http://www.info.uqam.ca/~makarenv/hts.html) at the beginning of the year 2005.
4
Bibliography
[BRI 03] BRIDEAU C., GUNTER B., PIKOUNIS W., PAJNI N., LIAW A., “Improved statistical methods for hit selection in high-throughput screening”, J Biomol Screen, vol. 8, 2003, p. 634-647. [GUN 03] GUNTER B., BRIDEAU C., PIKOUNIS B., PAJNI N., LIAW A., “Statistical and graphical methods for quality control determination of high throughput screening data”, J Biomol Screen, vol. 8, 2003, p. 624-633. [HEU 02] HEUER C., HAENEL T., PRAUSE B., “A novel approach for quality control and correction of HTS data based on artificial intelligence”, The Pharmaceutical Discovery & Development Report 2003/03, 2002, PharmaVentures Ltd., [Online] Retrieved from http://www.worldpharmaweb.com/pdd/new/overview5.pdf. [HEY 02] HEYSE S., “Comprehensive analysis of high-throughput screening data”, Proc SPIE, vol. 4626, 2002, p. 535-547. [KEV 04] KEVORKOV D., MAKARENKOV V., “Statistical analysis of systematic errors in highthroughput screening”, submitted to J Biomol Screen, 2004. [ZHA 00] ZHANG J.H., CHUNG T.D.Y., OLDENBURG K.R., “Confirmation of Primary Active Substances from High Throughput Screening of Chemical and Biological Populations: A Statistical Approach and Practical Considerations”, J Comb Chem, vol. 2, 2000, 258-265. [ZHA 99] ZHANG J.H., CHUNG T.D.Y., OLDENBURG K.R., “A Simple Statistic Parameter for Use in Evaluation and Validation of High Throughput Screening Assays”, J Biomol Screen, vol. 4, 1999, 6773.
5