Received: 29 September 2017
Revised: 26 January 2018
Accepted: 26 January 2018
DOI: 10.1002/rcm.8074
RESEARCH ARTICLE
Quantification of dsRNA using stable isotope labeling dilution liquid chromatography/mass spectrometry An‐Wen Kung1
|
Peter M. Kilby2
|
David E. Portwood2
|
Mark J. Dickman1
1
Department of Chemical and Biological Engineering, Mappin Street, University of Sheffield, Sheffield S1 3JD, UK
2
Syngenta, Jealott's Hill International Research Centre, Bracknell, Berkshire RG42 6EY, UK Correspondence M.J. Dickman, Department of Chemical and Biological Engineering, Mappin Street, University of Sheffield, Sheffield S1 3JD, UK. Email:
[email protected]
Rationale:
Recent developments in RNA interference (RNAi) have created a need for cost‐
effective and large‐scale synthesis of double‐stranded RNA (dsRNA), in conjunction with high‐ throughput analytical techniques to fully characterise and accurately quantify dsRNA prior to downstream RNAi applications.
Methods: 13
Stable isotope labeled dsRNA was synthesised both in vivo (15N) and in vitro
15
( C, N‐guanosine‐containing dsRNA) prior to purification and quantification. The stable isotope labeled dsRNA standards were subsequently spiked into total RNA extracted from E. coli engineered to express dsRNA. RNase mass mapping approaches were subsequently performed using liquid chromatography/electrospray ionisation mass spectrometry (LC/ESI‐MS) for both
Funding information Biotechnology and Biological Sciences Research Council, Grant/Award Number: BB/M012166/1; Syngenta
the identification and absolute quantification of the dsRNA using the ratios of the light and heavy oligonucleotide pairs.
Results:
Absolute quantification was performed based on the resulting light and heavy
oligoribonucleotides identified using MS. Using this approach we determined that 624.6 ng/μL and 466.5 ng/μL of dsRNA was present in 80 μL total RNA extracted from 108 E. coli cells expressing 765 bp and 401 bp dsRNAs, respectively.
Conclusions:
Stable isotope labeling of dsRNA in conjunction with MS enabled the
characterisation and quantification of dsRNA in complex total RNA mixtures.
1
|
plants expressing dsRNA.6,9 To ensure RNAi gene silencing using the
I N T RO D U CT I O N
above approaches, it is important to both produce and deliver the Exploitation of the RNA interference (RNAi) pathway to block the
required amounts of dsRNA. Therefore, the necessary analytical tools
expression of specific genes holds considerable promise for the
to quantify the dsRNA are important to both optimise production
development of novel RNAi‐based insect management strategies.1
strategies and ensure delivery of the required amounts of dsRNA.10
There are a wide range of future potential applications of RNAi to
Mass spectrometry (MS) is a powerful approach for the analysis
control agricultural insect pests as well as its use for prevention of
and direct characterisation of nucleic acids. RNase mass mapping
diseases in beneficial insects. Recent developments in RNAi have
methods have been performed to identify and characterise a wide
created a need for cost‐effective, large‐scale synthesis of double‐
range of RNAs.11-15 Prior to MS analysis, purification of the RNA of
stranded RNA (dsRNA), which in turn requires robust analytical
interest using high‐performance liquid chromatography (HPLC) is an
techniques to fully characterise and accurately quantify dsRNA prior to
essential step. For further LC/MS analysis, specific RNase digestions
RNAi applications. A wide range of dsRNA products can be generated
are performed in order to produce smaller oligoribonucleotide fragments,
either via bacterial expression systems, in planta or in vitro transcription.
which are then amenable for direct on‐line LC separation and MS
The development of suitable analytical methods to characterise the
analysis. RNase mass mapping methods have been widely employed for
dsRNA products remains a significant challenge.
the identification of RNA and RNA post‐transcriptional modifications.11-15
E. coli‐mediated delivery of dsRNA has been reported in C. elegans,2,3 planarians,4 Entamoeba histolytica5 and Spodoptera
In addition, we have recently developed RNase mass mapping approaches to identify and characterise dsRNA.16
exigua.6 Furthermore, a number of RNAi‐based insect management
Recent MS studies have focused on the development of more
strategies have also employed the ingestion of bacteria‐expressing
quantitative approaches by using isotopic labeling in conjunction with
dsRNA,7 application of chemically synthesised dsRNA8 and transgenic
RNase mapping.17,22 We were the first to introduce the use of
590
Copyright © 2018 John Wiley & Sons, Ltd.
wileyonlinelibrary.com/journal/rcm
Rapid Commun Mass Spectrom. 2018;32:590–596.
KUNG
591
ET AL.
metabolic labeling by utilising E. coli to generate both light and heavy labeled RNA prior to LC/MS for the identification and quantification of RNA and RNA modifications.18 This approach facilitates both the qualitative and quantitative analysis of RNA and RNA modifications. More recent applications have used this method by using a reference material
15
N‐labeled rRNA from E. coli to understand the roles that
rRNA modifications play inside the living cells.19 In addition to metabolic labeling, isotope labeling via in vitro transcription of RNAs in conjunction with
C10 ‐guanosine triphosphate (GTP) has been
13
used to generate an internal reference to quantitatively characterise
2.2
|
In vitro transcription of dsRNA
PCR‐amplified DNA was used as the template for in vitro transcription reactions in conjunction with a HiScribe T7 High Yield RNA Synthesis Kit (New England Biolabs, UK). For isotope labeling, 2.0 μL of each the NTPs (10 mM) were used where GTP was replaced with guanosine‐13C10,
15
N5‐5’‐triphosphate (Sigma‐Aldrich, UK). 2 μL of
10× reaction buffer, 1 μg DNA template and 2 μL HiScribe T7 polymerase were added to 20 μL RNase‐free water and incubated at 37°C for 4 h.
rRNA post‐transcriptional modifications in Schizosaccharomyces pombe
Expression of dsRNA in E. coli HT115 (DE3)
and Saccharomyces cerevisiae.15,20 Furthermore, the "comparative
2.3
analysis of RNA digests" (CARD) extends isotopic labeling to tRNA
E. coli HT115 (DE3) cells (Cold Spring Harbor Laboratory, NY, USA)
sequencing by labeling the known sequence with H216O, and the
were used for the transformation of plasmids carrying an insert to
unknown sequence with H218O, in order to distinguish an unknown
generate dsRNA products of 765 bp and 401 bp, respectively. Pre‐
sequence by a mass increase of 2 Da.21 More recently, the utilisation
cultures were prepared by inoculating a single colony from the
of stable isotope labeled tRNA generated using in vitro transcription
transformed cells into 5 mL of LB medium containing tetracycline
as an internal standard was developed in order to improve the CARD
(10 μg/mL) and ampicillin (100 μg/mL) or tetracycline (10 μg/mL)
approach for characterising tRNA (SIL‐CARD).22
|
and kanamycin (50 μg/mL), before incubating with vigorous shaking
Recent developments in RNA interference (RNAi) have created a
at 37°C overnight until the OD600 reached 0.6. For metabolic isotope
need for cost‐effective and large‐scale synthesis of dsRNA, which in
labeling a defined nitrogen‐free medium was prepared starting with
turn requires effective analytical techniques to fully characterise and
45 mL of sterile water with two tablets of Enpresso B Defined
accurately quantify dsRNA prior to RNAi application. Moreover,
Nitrogen Free medium, adding 3 mL of (14NH4)2SO4 or
accurate quantification of dsRNA is important to both optimise
(40 g/L, final concentration 2.5 g/L) to the defined media which
15
NH4Cl
production strategies and ensure delivery of the required amounts of
contained tetracycline (10 μg/mL) and ampicillin (100 μg/mL) or
dsRNA. UV absorbance spectrophotometry remains one of the most
tetracycline (10 μg/mL) and kanamycin (50 μg/mL). 5–10% of overnight
popular methods for the rapid quantification of nucleic acids; however,
inoculum were used in 50 mL cultures in both light and heavy media.
the quantification of individual components in complex mixtures
The cultures were incubated with shaking at 37°C until an OD600 of
requires their purification prior to analysis. In this study we have
0.6 was reached. IPTG was added to a final concentration of 1 mM
utilised stable isotope labeling using both metabolic labeling and
and the cultures incubated for a further 2 h.
in vitro labeling of dsRNA in conjunction with MS for the characterisation and absolute quantification of dsRNA in complex total
2.4
RNA mixtures produced in E. coli.
|
RNA extraction and purification of dsRNA
RNA extractions were performed using RNASwift as previously described.7 Purification of
2
N‐dsRNA standard from total RNA was
performed by adding 0.1 μg of RNase A followed by 10 min incubation
EXPERIMENTAL
|
15
at 37°C. Prior to solid‐phase extraction (SPE), 300 μL of IPD buffer
2.1
|
(containing 33% isopropanol and 33% dimethyl sulphoxide (DMSO))
Chemicals and reagents
was added and the mixture loaded into the column followed by
The following were used: Enpresso® B Defined Nitrogen Free culture medium (BioSilta, UK),
15
N‐ammonium sulphate (99%, Cambridge
Isotope Laboratories, UK),
14
13
discarded and 700 μL of wash buffer (10 mM Tris‐HCl pH 7.5 + 80%
N‐ammonium sulphate (≥99.0%, Sigma‐
EtOH) were added and centrifuged for 1 min. The dsRNA was eluted
N5‐5'‐triphosphate sodium salt
by adding 80 μL nuclease‐free water. Quantification using a Nanodrop
Aldrich, UK), guanosine‐13C10, and solution (98 atom %
centrifugation at 13,000 rpm for 1 min. The flow‐through was
15
15
N, 90% chemical purity;
2000 UV visible spectrophotometer (Thermo Fisher Scientific) using an
Sigma‐Aldrich, UK). Ampicillin sodium salt, tetracycline hydrochloride,
extinction coefficient of 0.021 (μg/mL)−1 cm−1 which corresponds to 1
isopropyl
C, 98 atom %
β‐D‐1‐thiogalactopyranoside
(IPTG),
triethylammonium
acetate (TEAA) and 1,1,1,3,3,3,‐hexafluoro‐2‐propanol (HFIP) were all
A260 = 46.52 μg/mL. For RNase digestion, 0.1 μg RNase A was added to 1 μg of RNA sample. Digestion was performed for 1 h at 37°C.
purchased from Sigma‐Aldrich, UK. HPLC‐grade water, methanol, and acetonitrile (ACN) were obtained from Thermo Fisher Scientific, UK. RNase A was from Ambion, UK. Synthetic genes were synthesised via GeneArt
2.5 | Ion‐pairing (IP) reversed‐phase (RP) chromatography
(Invitrogen Life Technologies, UK) and the designed primers were
IP‐RP‐HPLC (Agilent 1100 series HPLC, Germany) and a ProSwift
purchased from MWG Eurofins, UK. The Purelink Genomic DNA
RP‐1S column (Thermo Fisher Scientific, UK) were used to analyse all
Mini Kit and PCR master mix were obtained from Thermo Fisher
samples of purified intact dsRNA. Chromatograms were acquired at
Scientific, UK.
260 nm. Binary eluent mode was applied (buffer A: 0.1 M
592
KUNG ET
triethylammonium acetate (TEAA) pH 7.0, 0.01% ACN; and buffer B:
A
list
of
theoretical
monoisotopic
masses
of
AL.
RNA
0.1 M TEAA, 25% of ACN) at a flow rate of 1 mL/min and a column
oligoribonucleotides fragments (obtained from RNase A digestion) was
temperature of 50°C. The analyses were performed using a linear
compiled from calculations using Mongo Oligo Mass Calculator.23 All
gradient as follows: 22% buffer B held for 2 min, followed by an
possible chemical terminals were selected during data processing,
increase to 25% buffer B over 1 min, followed by a linear extension
including 5'‐OH, 5'‐phosphate, 5'‐cyclic phosphate, 3'‐OH, 3'‐phosphate,
to 62% buffer B over 15 min, and finally a linear extension to 73%
and 3'‐cyclic phosphate. The resulting theoretical monoisotopic masses
buffer B in 2.5 min.
were utilised to calculate the heavy isotope oligoribonucleotide monoisotopic masses using the elemental or base composition of the
2.6 | Liquid chromatography/electrospray ionisation mass spectrometry
oligoribonucleotide sequences in conjunction with the calculated number of nitrogens or guanosines. IsoPro 3.1 software was used to calculate theoretical relative intensities of the oligoribonucleotide
The RNase digestion products were analysed on a maXis ultra‐
isotopomers. For the quantification of oligoribonucleotide fragments
high‐resolution time‐of‐flight (UHR‐TOF) mass spectrometer (Bruker
using stable isotope labeling, samples consisting of differing amounts of
Daltonics, Germany) interfaced with a liquid chromatography
heavy and light isotopes were mixed by spiking known concentrations
system (U3000; Thermo Scientific, UK). HPLC was performed using
of purified 15N‐dsRNA into unknown concentrations of 14N‐labeled total
an Accucore C18 column (150 mm × 2.1 mm ID; Thermo Fisher),
RNA. Prior to the experiment, all the samples were quantified using UV
0.1 mL/min at 30°C. Buffer A, 20 mM TEAA, 80 mM 1,1,1,3,3,3,‐
spectrophotometry followed by LC/MS analysis. An extracted ion
hexafluoro‐2‐propanol (HFIP), and buffer B 20 mM TEAA, 80 mM
chromatogram (XIC) was constructed for each oligoribonucleotide. This
HFIP, and 50% ACN. The gradient conditions used were: 10%
tool was used to check for chromatographic shifts between heavy and
buffer B held for 2 min, followed by a linear increase to 20% B
light versions of the same oligoribonucleotide. Absolute quantification
in 20 min, followed by a linear extension to 25% B over 10 min,
was performed by measuring the ratio and peak areas of both light and
and finally a linear extension to 80% B in 2 min. All analyses were
heavy samples using DataAnalysis software (Bruker Daltonics) across
performed in negative ion mode at a mass range of 300–2500 m/z.
10 different oligoribonucleotides. This was performed for three different
The ion source voltage was set to −2000 V. The capillary temperature was maintained at 300°C with a N2 nebuliser gas pressure of 0.4 bar
dsRNA
140
at a flow rate of 6.0 L/h.
15N
Absorbance (mV)
120 dsRNA
Absorbance (mV)
60
40
100
16S 23S
80 60 40 tRNA
20 0
20
-20
0
0
A 0
5
A
10
15
20
5
10
250
Retention time (minutes)
15
20
Retention time (minutes) dsRNA
200 13C 15N
dsRNA
Absorbance (mV)
180
Absorbance (mV)
160 140 120 100 80 60
16S
100 tRNA
50 0
40 20
-50
0
0
B
- 20
0
B
23S
150
5
10
15
5
10
15
20
Retention time (minutes)
20
Retention time (minutes)
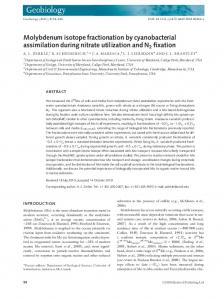
FIGURE 1 IP‐RP‐HPLC analysis of purified heavy stable isotope labeled dsRNA. (A) Purified 15N‐dsRNA from E. coli HT115 (DE3) cells expressing a 756 bp dsRNA, 1.9 μg of dsRNA was injected. (B) Purified 15N‐dsRNA (401 bp) 13C,15N‐guanosine‐containing dsRNA synthesised using in vitro transcription, 2.0 μg was injected
FIGURE 2 IP‐RP‐HPLC analysis of total RNA extracted from E. coli HT115 (DE3) cells expressing dsRNA. (A) Total RNA extracted from E. coli HT115 (DE3) cells expressing a 756 bp dsRNA. The rRNA, tRNA and dsRNA are highlighted. Approximately 7 μg of total RNA was injected and analysed. (B) Total RNA extracted from E. coli HT115 (DE3) cells expressing a 401 bp dsRNA. The rRNA, tRNA and dsRNA are highlighted. Approximately 11 μg of total RNA was injected
KUNG
593
ET AL.
experimental samples, each of which had different amounts of
15
N
many siRNAs via dicer cleavage, which contributes to the RNAi
internal dsRNA standard present, enabling a final absolute
response and prevents the resistance due to the polymorphism
concentration of dsRNA represented as an average across the three
variation encoded by nucleotide sequences. Therefore, we chose to
different samples.
generate dsRNAs corresponding to this size range. To characterise and quantify the dsRNA expressed in E. coli, two different strategies were employed.
3
|
15
N‐dsRNA was generated in vivo
by growing E. coli HT115 (DE3) cells (transformed with plasmids to
RESULTS A ND DIS CUS SION
express dsRNA) on heavy (15N) media. In addition, stable isotope labeled RNAs were also synthesised in vitro using in vitro transcription in conjunction
3.1 | Synthesis and purification of isotope labeled dsRNA
with
Most RNAi research in insects has been performed using dsRNA
media, dsRNA was extracted, treated with RNAase A to remove the
constructs of between 100–800 bp10,24 and a minimum length of
background rRNA/tRNA and purified using SPE7 prior to analysis using
approximately 60 bp for effective RNAi in several insects has been
IP‐RP‐HPLC (see Figure 1A). The results show the successful synthesis
demonstrated.21,25,26 The use of larger dsRNA molecules generates
and purification of the dsRNA (765 bp) from E. coli; no significant
14
N
C10,15N5‐(GTP) to generate 6,14
RNA as described previously.
21007.51
15
N
AAGAUp
2-
13
C10,15N5‐guanosine‐containing
Following E. coli growth on the
Antisense GAAGGUp
14N
Sense
2827.013
13
N
15N
21020.97
26.91Da
837.985
15
Abundance
Abundance
21.94 Da
826
828
830
A
832
834
836
838
840
1006
1010
m/z
*sense
1014
1018
1022
m/z
*antisense
3.5 3.20:1
2.5 2.0 1.5 1.0 0.5
3
light:heavy ratio
light:heavy ratio
3.0
2
0.907:1
1 0.289:1
0.0 0 A
B FIGURE 3
B
C
Stable isotope dilution
Absolute quantification of dsRNA using a stable isotope labeled dsRNA standard generated in vivo in conjunction with mass spectrometry. (A) Mass spectra of the oligoribonucleotide AAGAUp (sense strand), GAAGGUp (antisense strand) across varying light:heavy ratios. (B) Light:heavy ratios of ten different oligoribonucleotides across varying amounts of isotope labeled dsRNA standard. (C) Average light:heavy ratios with the error bars representing standard deviation [Color figure can be viewed at wileyonlinelibrary.com]
594
KUNG ET
contaminating rRNA was present. Following in vitro synthesis of the isotope labeled dsRNA (401 bp), purification was performed using SPE to remove excess NTPs prior to analysis using IP‐RP‐HPLC (see Figure 1B).
AL.
3.2 | Characterisation and quantification of dsRNA using stable isotope labeling in conjunction with RNase mass mapping
IP‐RP‐HPLC shows that no significant contaminating ssRNA or NTPs were present. Quantification of the purified isotope labeled dsRNA
To characterise and quantify dsRNA expressed in E. coli, total RNA was
standards was subsequently performed using UV spectrophotometry using
extracted from
a Nanodrop spectrophotometer. Accurate quantification of the internal
401 bp dsRNA and analysed using IP‐RP‐HPLC (see Figure 2). The results
isotope labeled dsRNA standards is important, as this value directly
show the expected chromatogram, highlighting the presence of the
determines the quantification of the dsRNA in the biological samples. UV
abundant tRNA/rRNA together with dsRNA. Direct analysis using UV
spectrophotometry was used to accurately determine the concentration
spectrophotometry cannot accurately determine the amount of dsRNA
of the dsRNA standards; therefore, it is important to ensure the dsRNA
present in these complex mixtures. Therefore, following validation of the
is purified and accurate extinction coefficients are used for dsRNA. We
expression and extraction of the dsRNA in complex RNA mixtures extracted
have previously measured the hypochromicity of dsRNA to accurately
from E. coli, the stable isotope labeled dsRNA standards previously
determine the overall extinction coefficient and mass concentration/A260
generated were spiked into these samples prior to LC/MS analysis.
(46.52 μg/ml/A260).27 This value was subsequently used for the
Sense AGAAGAUp
21164.01
N E. coli HT115 cells expressing a 765 bp dsRNA and
A range of amounts of the E. coli were combined with
quantification of dsRNA using UV spectrophotometry.
14 N
14
C N
21180.01
21179.03
N purified dsRNA (765 bp)
N total RNA extract containing the 765 bp
Antisense GGAAGGUp
14 N
13 15
15
14
13
C15N 21210.04
60.06 Da
Abundance
Abundance
30.03 Da
1164.0
1167.8
1171.6
1175.4
1179.2 1180
A
1185
1190
* sense
1195
1200
1205
1210
m/z
m/z * antisense
4.0
4
3.453:1
3.0 2.5 2.0 1.5 1.0
light:heavy ratio
light:heavy ratio
3.5 3
2 1.081:1
1
0.5 0.0
B FIGURE 4
0.277:1
0
A
B
C
Stable isotope dilution
Absolute quantification of dsRNA using in vitro transcribed stable isotope labeled dsRNA. (A) Mass spectra of the oligoribonucleotides, AGAAGAUp and GGAAGGUp, across varying light:heavy ratios. (B) Light:heavy ratios of ten different oligoribonucleotides across varying amounts of isotope labeled dsRNA standard. (C) Average light:heavy ratios with the error bars representing standard deviation [Color figure can be viewed at wileyonlinelibrary.com]
KUNG
595
ET AL.
dsRNA in conjunction with tRNA/rRNA and subsequently digested
NTPs that prevent accurate analysis using UV spectrophotometry.
using RNase A. The oligoribonucleotide fragments were analysed using
Furthermore, the presence of abundant tRNA and rRNAs present in
LC/ESI‐MS. The application of stable isotope labeling enables the iden-
the HPLC chromatogram can limit the accurate quantification of the
tification of oligoribonucleotides generated from the dsRNA in com-
dsRNA directly from the HPLC chromatogram in situations where the
plex mixtures. All corresponding oligoribonucleotides from the
dsRNA co‐elutes with the rRNA, or multiple heterogeneous dsRNA
dsRNA appear as light and heavy pairs in contrast to the abundant
are synthesised.
oligoribonucleotides generated from the background rRNA and
Stable isotope labeled dsRNA standards were synthesised
tRNA present in the total RNA extract. An example of the mass
(15N and
spectra obtained from an oligoribonucleotide generated from rRNA is
purification and quantification. The stable isotope dsRNA standards
shown in Figure S1 (supporting information); the absence of the
were subsequently mixed into RNA extracted from E. coli that was
associated
of
engineered to express dsRNA prior to RNase digestion and LC/ESI‐MS
oligoribonucleotides generated from rRNA not dsRNA. Therefore, this
analysis. Absolute quantification was performed based on the resulting
approach simplifies the identification and quantification of the dsRNA
light and heavy oligoribonicleotides identified using MS. Using this
in complex RNA mixtures as light and heavy pairs can readily be
approach we determined that 624.6 ng/μL and 466.5 ng/μL of dsRNA
identified in complex MS chromatograms. Figure 3A shows the
were present in 80 μL total RNA extracted from 108 E. coli cells
heavy
identification of
oligoribonucleotide
14
N and
enables
identification
15
N sense strand oligoribonucleotides (from
13
C,15N guanosine containing) in vivo and in vitro prior to
expressing 765 bp and 401 bp dsRNA, respectively.
the dsRNA), AAGAUp and GAAGGUp, detected in varying amounts of spiked
15
N dsRNA standard. Absolute quantification was then
ACKNOWLEDGEMENTS
performed by measuring the ratio and peak areas of both light and
MJD acknowledges support from the Biotechnology and Biological
heavy pairs for 10 different identified oligoribonucleotides across three
Sciences Research Council UK (BBSRC) (BB/M012166/1). AWK
different amounts of dsRNA standard. The results are summarised in
acknowledges support as an Engineering and Physical Sciences
Figures 3B and 3C and Table S1 (supporting information). Absolute
Research Council (EPSRC) HEFCE Catalyst studentship with Syngenta.
quantification of
14
N dsRNA in the total RNA resulted in 466.5 ng ±
18.7 ng/μL of dsRNA in 80 μL total RNA extracted from 108 E. coli cells dsRNA using an average across the three different experiments. Following quantitative analysis of dsRNA using the metabolic isotope labeling approach in conjunction with LC/MS, we further demonstrated the use of in vitro labeled dsRNA (13C,15N‐guanosine dsRNA) as the internal standard to characterise and quantify dsRNA expressed in E. coli. Total RNA was extracted from E. coli HT115 cells expressing a 401 bp dsRNA and analysed using IP‐RP‐HPLC (see Figure 2B). A range of amounts of 13C,15N‐guanosine dsRNA (401 bp) were added prior to RNase A enzymatic digestion and analysis of the oligoribonucleotides using LC/ESI‐MS as previously described. Figure 4A shows the identification of light and heavy oligoribonucleotides. The representative mass spectrum of the doubly charged unique sense and antisense strands oligoribonucleotide, AGAAGAUp and GGAAGGUp, were detected in varying amounts of spiked heavy dsRNA standard. Absolute quantification was then performed by measuring the ratio and peak areas of both light and heavy pairs for 10 different identified
ORCID Mark J. Dickman
http://orcid.org/0000-0002-9236-0788
RE FE RE NC ES 1. Gordon KHJ, Waterhouse PM. RNAi for insect‐proof plants. Nat Biotechnol. 2007;25(11):1231‐1232. 2. Timmons L, Court DL, Fire A. Ingestion of bacterially expressed dsRNAs can produce specific and potent genetic interference in Caenorhabditis elegans. Gene. 2001;263(1–2):103‐112. 3. Hammell CM, Hannon GJ. Inducing RNAi in C. elegans by feeding with dsRNA‐expressing E. coli. Cold Spring Harb Protocols. 2012; 201(12):11861‐11865. 4. Newmark PA, Reddien PW, Cebria F, Alvarado AS. Ingestion of bacterially expressed double‐stranded RNA inhibits gene expression in Planarians. Proc Natl Acad Sci. 2003;100(suppl 1):11861‐11865. 5. Solis CF, Santi‐rocca J, Perdomo D, Weber C, Guille N. Use of bacterially expressed dsRNA to downregulate Entamoeba histolytica gene expression. PLoS ONE. 2009;4(12):e8424.
oligoribonucleotides across three different amounts of standard. The results are summarised in Figures 4B and 4C and Table S2 (supporting information). Absolute quantification of the
14
N‐dsRNA present in the
total RNA revealed 624.6 ± 14.24 ng/μL of dsRNA in 80 μL total RNA extracted from 108 E. coli cells expressing dsRNA using an average across the three different experiments.
4
|
C O N CL U S I O N S
Stable isotope labeling of dsRNA both in vitro and in vivo was used in conjunction with mass spectrometry for the characterisation and quantification of dsRNA in complex total RNA mixtures. This approach enables the accurate quantification of dsRNA from a complex mixture without the need to purify the dsRNA from contaminating rRNA and
6. Tian H, Peng H, Yao Q, et al. Developmental control of a Lepidopteran pest Spodoptera exigua by ingestion of bacteria expressing dsRNA of a non‐midgut gene. PLoS ONE. 2009;4(7):e6225. 7. Li X, Zhang M, Zhang H. RNA interference of four genes in adult Bactrocera dorsalis by feeding their dsRNAs. PLoS ONE. 2001;6(3): e17788. 8. Palli SR. RNA interference in Colorado Potato Beetle: Steps toward development of dsRNA as a commercial insecticide. Curr Opin Insect Sci. 2014;6:1‐8. 9. Malik HJ, Raza A, Amin I, et al. RNAi‐Mediated Mortality of the Whitefly through Transgenic Expression of Double‐Stranded RNA Homologous to Acetylcholinesterase and Ecdysone Receptor in Tobacco Plants. Sci Rep. 2016;6(1):38469. 10. Darrington M, Dalmay T, Morrison NI, Chapman T. Implementing the sterile insect technique with RNA interference – a review. Entomol Exp Appl. 2017;164(3):155‐175.
596
11. Kowalak JA, Pomerantz SC, Crain PF, Mccloskeyl JA. A novel method for the determination of post‐transcriptional modification in RNA by mass spectrometry. Nucleic Acids Res. 1993;13(19):4577‐4583. 12. Hossain M, Limbach PA. Mass spectrometry‐based detection of transfer RNAs by their signature endonuclease digestion products. RNA. 2007;13(2):295‐303. 13. Taoka M, Yamauchi Y, Nobe Y, et al. An analytical platform for mass spectrometry‐based identification and chemical analysis of RNA in ribonucleoprotein complexes. Nucleic Acids Res. 2009;37(21):e140. 14. Castleberry MC, Limbach PA. Relative quantitation of transfer RNAs using liquid chromatography mass spectrometry and signature digestion products. Nucleic Acids Res. 2010;38(16):e162. 15. Taoka M, Nobe Y, Hori M, et al. A mass spectrometry‐based method for comprehensive quantitative determination of post‐transcriptional RNA modifications : The complete chemical structure of Schizosaccharomyces pombe ribosomal RNAs. Nucleic Acids Res. 2015;43(18):e115. 16. Nwokeoji AO, Kung AW, Kilby PM, Portwood DE, Dickman MJ. Purification and characterisation of dsRNA using ion pair reverse phase chromatography and mass spectrometry. J Chromatogr A. 2017;1484:14‐25. 17. Borland K, Limbach PA. Applications and advantages of stable isotope phosphate labeling of RNA in mass spectrometry. Topics Curr Chem. 2017;375(2):33. 18. Waghmare SW, Dickman MJ. Characterization and quantification of RNA post‐transcriptional modifications using stable isotope labeling of RNA in conjunction with mass spectrometry analysis. Anal Chem. 2011;83(12):4894‐4901. 19. Popova AM, Williamson JR. Quantitative analysis of rRNA modifications using stable isotope labeling and mass spectrometry. J Am Chem Soc. 2014;136(5):2058‐2069. 20. Taoka M, Nobe Y, Yamaki Y, et al. The complete chemical structure of Saccharomyces cerevisiae rRNA : Partial pseudouridylation of U2345 in 25S rRNA by snoRNA snR9. Nucleic Acids Res. 2016;44(18):8951‐8961.
KUNG ET
AL.
21. Bolognesi R, Ramaseshadri P, Anderson J, et al. Characterizing the mechanism of action of double‐stranded RNA activity against western corn rootworm (Diabrotica Virgifera Virgifera LeConte). PLoS ONE. 2012;7(10):e47534. 22. Paulines MJ, Limbach PA. Stable isotope labeling for improved comparative analysis of RNA Digests by mass spectrometry. J Am Soc Mass Spectrom. 2017;28:551‐561. 23. Available: http://library.med.utah.edu/masspec/mongo.htm. 24. Joga MR, Zotti MJ, Smagghe G, Christiaens O. RNAi efficiency, systemic properties, and novel delivery methods for pest insect control: What we know so far. Frontiers Physiol. 2016;7:1‐14. 25. Miller SC, Miyata K, Brown SJ, Tomoyasu Y. Dissecting systemic RNA interference in the Red Flour Beetle Tribolium castaneum: Parameters affecting the efficiency of RNAi. PLoS ONE. 2012;7(10):e47431. 26. Ivashuta S, Zhang Y, Wiggins BE, et al. Environmental RNAi in herbivorous insects. RNA. 2015;21(5):840‐850. 27. Nwokeoji AO, Kilby PM, Portwood DE, Dickman MJ. Accurate quantification of nucleic acids using hypochromicity measurements in conjunction with UV spectrophotometry. Anal Chem. 2017;89(24):13567‐13574.
SUPPOR TI NG INF ORMATI ON Additional Supporting Information may be found online in the supporting information tab for this article.
How to cite this article: Kung A‐W, Kilby PM, Portwood DE, Dickman MJ. Quantification of dsRNA using stable isotope labeling dilution liquid chromatography/mass spectrometry. Rapid Commun Mass Spectrom. 2018;32:590‐596. https://doi. org/10.1002/rcm.8074