JOURNAL OF MAGNETIC RESONANCE IMAGING 24:676 – 682 (2006)
Original Research
Faster Flow Quantification Using Sensitivity Encoding for Velocity-Encoded Cine Magnetic Resonance Imaging: In Vitro and In Vivo Validation Ashwin Prakash, MD,1,3 Ruchira Garg, MD,1,3 Edward N. Marcus, MSc,1 Glenn Reynolds, PhD,5 Tal Geva, MD,1– 4 and Andrew J. Powell, MD1,3* Purpose: To test the agreement between conventional and sensitivity-encoded (SENSE) velocity encoded cine (VEC) MRI in a flow phantom and in subjects with congenital and acquired heart disease.
Key Words: blood flow quantification; velocity encoded cine MRI; SENSE; parallel imaging; phase contrast MCI J. Magn. Reson. Imaging 2006;24:676 – 682. © 2006 Wiley-Liss, Inc.
Materials and Methods: Flow measurements were performed in a 1.5 T scanner using a segmented k-space VEC MRI sequence and then repeated with a SENSE factor of 2. The flow phantom used a piston pump to generate physiologic arterial waveforms (0.5– 4.9 L/min). In the subjects, flow measurements were performed in the ascending aorta (N ⫽ 33) and/or the main pulmonary artery (N ⫽ 24). Results: Utilization of SENSE reduced the scan time by 50%. In the phantom, measurements without and with SENSE agreed closely with a mean difference of 0.01 ⫾ 0.08 L/min or 0.12% ⫾ 3.8% (P ⫽ 0.68). In the subjects, measurements without and with SENSE also agreed closely with a mean difference of 0.08 ⫾ 0.36 L/min or 1.3% ⫾ 7.2% (P ⫽ 0.08). Compared with standard imaging, the use of SENSE reduced the signal-to-noise ratio (SNR) by 28% in the phantom (N ⫽ 10) and 27% in vivo (N ⫽ 22). Conclusion: VEC MRI flow measurements with a SENSE factor of 2 were twice as fast and agreed closely with the conventional technique in vitro and in vivo. VEC MRI with SENSE can be used for rapid and reliable quantification of blood flow.
1 Department of Cardiology, Children’s Hospital Boston, Boston, Massachusetts, USA. 2 Department of Radiology, Children’s Hospital Boston, Boston, Massachusetts, USA. 3 Department of Pediatrics, Harvard Medical School, Boston, Massachusetts, USA. 4 Department of Radiology, Harvard Medical School, Boston, Massachusetts, USA. 5 General Electric Medical Systems, Milwaukee, Wisconsin, USA. Contract grant sponsor: Cardiac MRI Research Fund, Children’s Hospital Boston. *Address reprint requests to: A.J.P., Department of Cardiology, Children’s Hospital Boston, 300 Longwood Ave., Boston, MA 02115. E-mail:
[email protected] Received June 9, 2005; Accepted May 2, 2006. DOI 10.1002/jmri.20654 Published online 28 July 2006 in Wiley InterScience (www.interscience. wiley.com).
© 2006 Wiley-Liss, Inc.
VELOCITY ENCODED CINE (VEC) MRI is a noninvasive technique for measuring blood flow velocity and volume flow rate in the cardiovascular system. Multiple studies have validated its accuracy in flow phantoms and in vivo (1–7). The clinical applications of VEC MRI have been extensively reviewed and include quantification of cardiac output, pulmonary-to-systemic shunt ratio, valvular regurgitation, coronary flow, and differential lung perfusion (8 –15). However, conventional VEC MRI flow measurements are relatively time-consuming, taking two to five minutes per location depending on heart rate and image acquisition parameters (2,16). Because a comprehensive examination frequently requires multiple flow measurements, a faster acquisition could significantly reduce examination times or allow for additional assessment. Sensitivity encoding (SENSE) reduces MRI time by using coil sensitivity information from multiple phasedarray receiver coils to complement spatial encoding obtained by conventional gradient encoding, thereby allowing for a reduction in the number and density of phase-encoding steps. The resultant aliased image is then “unwrapped” using the coil-sensitivity information (17). Because SENSE reconstruction is potentially vulnerable to inaccuracies (17–19), in this study we assessed the agreement between conventional and SENSE VEC MRI flow measurements in a pulsatile flow phantom and in subjects with congenital and acquired heart disease. MATERIALS AND METHODS MRI Technique In vitro and in vivo MRI studies were performed in a 1.5 T whole-body scanner (Signa Horizon LX with Twinspeed gradients; General Electric, Milwaukee, WI, USA) using either a four- or eight-element phased-array receiver coil. Following three-plane localizing images, a
676
Flow Quantification by MRI Using SENSE
677
Table 1 Velocity-Encoded Cine MRI Acquisition Parameters
TR (msec) TE (msec) RF flip angle (degrees) Field of view (mm) Matrix size (frequency ⫻ phase) Slice thickness (mm) Number of signal averages Receiver bandwidth (kHz) Views per segment Maximum velocity encoded (cm/ second)
In vitro
In vivo
7.8 3.1 20 240 256 ⫻ 160 5 1 31.3 6 150-350
7.5 3.1 20 240-350 256 ⫻ 160 5-6 2 31.3 2 200-350
SENSE reference scan was performed (fast gradientecho sequence in the axial plane, TR ⫽ 150 msec, TE ⫽ 1.3 msec, flip angle ⫽ 70°, FOV ⫽ 480 mm, matrix ⫽ 32 ⫻ 32, slice thickness ⫽ 7 mm, NSA ⫽ 1). Conventional through-plane VEC MRI flow measurements in the vessel of interest were made using a commercially available pulse sequence (FastCine PC; General Electric) with retrospective ECG gating (Table 1) (20). Data were reconstructed to yield 25 pairs of magnitude and phase images per flow cycle. The same VEC MRI sequence with the addition of SENSE (ASSET; General Electric) at a reduction factor of 2 was then repeated at each location as the experimental technique. Imaging planes were planned perpendicular to the direction of flow with a FOV sufficient to avoid backfolding as required by the SENSE reconstruction algorithm. In vitro flow measurements were performed three times without SENSE and three times with SENSE using the same imaging parameters for each flow condition, including one signal average and encoding velocities ranging from 150 –350 cm/second. In the subjects, flow was measured once without and once with SENSE in the ascending aorta and/or main pulmonary artery during free-breathing using the same imaging parameters, including two signal averages and encoding velocities ranging from 200 –350 cm/second.
chronize image acquisition to the pump cycle and simulate ECG-gating. The flow rate within the tubing was varied (0.5– 4.9 L/minute) by altering the amplitude of the piston motion while maintaining a constant cycle rate (90 cycles/minute). At each flow rate, timed collection of water exiting the tubing into the reservoir was used to determine the true flow rate. To simulate physiologic arterial waveforms, the flow rate in the tubing at the measurement location was recorded using an external transit-time ultrasonic flow probe (16-mm perivascular probe with T206 flowmeter; Transonic Systems, Ithaca, NY, USA) connected to the analog-to-digital converter and laptop computer (sampling rate 1000 Hz). A similar methodology was used in the course of a different study to measure flow in the ascending aorta of an anesthetized pig (25 kg) (unpublished data). The waveform used to prescribe pump piston motion was iteratively altered until the recorded waveform in the tubing resembled the waveform in the porcine aorta. Specifically, in the aorta and phantom the ratio of rise time to pulse width was 0.37 vs. 0.44, the ratio of fall time to pulse width was 0.42 vs. 0.51, and the power spectrum was 0 – 4.5 Hz vs. 0 – 4 Hz, respectively. This prescribed waveform was used for all phantom experiments. Subjects From November 2003 to April 2004, 33 subjects were prospectively enrolled into the study. Eligibility criteria included referral for a clinically indicated cardiac MRI scan with flow measurements as part of the standard imaging protocol, as well as written informed consent from the subjects and/or their legal guardian. The main diagnoses are listed in Table 2. Because of their limited ability to hold still, three of the subjects (all ⬍8 years of age) underwent MRI scans while under general anesthesia. The study protocol and informed consent were approved by the hospital’s committee on clinical investigation and the department’s scientific review committee.
Flow Phantom A pulsatile flow circuit was constructed using flexible plastic tubing (Tygon®; internal diameter 12.8 mm, wall thickness 1.6 mm, and length 15.2 m) connected to a computer controlled piston-pump (Superpump System SPS3891; Vivitro Systems, Victoria, Canada) and a reservoir. A segment of the tubing was suspended in a water bath and positioned at magnet isocenter so that the direction of flow was parallel to the long axis of the scanner bore. The motion of the pump’s piston was prescribed using commercially available waveform generation software (Labview 6.0; National Instruments Corp., Austin, TX, USA) run on a laptop computer (Dell Inspiron 4000 with Windows NT; Dell Inc., Round Rock, TX, USA) interfaced with an analog-to-digital converter (National Instruments Corp.). The pump generated a voltage output corresponding to the piston head displacement, which was scaled and filtered, and then connected to the ECG port of the MRI scanner to syn-
Table 2 Subject Diagnoses Diagnosis
N
Repaired TOF Coarctation TGA Single ventricle R/O ARVD Marfan syndrome Ebstein anomaly PAPVR Kawasaki disease Other repaired CHD
9 5 4 4 2 2 1 1 1 4
TOF ⫽ tetralogy of Fallot, TGA ⫽ transposition of the great arteries, R/O ARVD ⫽ rule-out arrhythmogenic right ventricular dysplasia, PAPVR ⫽ partially anomalous pulmonary venous return, CHD ⫽ congenital heart disease.
678
Prakash et al.
MR Image Analysis VEC MRI data were analyzed offline using a commercially available computer workstation (Advantage Windows version 4.0 or 4.1; General Electric Medical Systems, Milwaukee, WI, USA) and software (FLOW 2.0; Medis, Leiden, The Netherlands). The underlying principles and analysis techniques for VEC MRI were previously described (20 –23). Briefly, using the software’s semiautomated border detection algorithm, regions of interest (ROIs) were drawn around the vessel or tubing wall on all images. On the phase images, the signal intensity of each voxel corresponds linearly to the mean velocity within the voxel element. Flow rate at each instant is calculated by determining the mean voxel intensity and thus the mean velocity within the ROI, and multiplying by its area. Integration of the instantaneous flow rates over the cycle time yields the net volume flow per cycle, and multiplication by the cycle rate equals the volume flow rate. For the phantom experiments, the average of the three flow measurements at each condition was used for analysis. In the subjects, only one flow measurement was made at each condition. To assess intraobserver and interobserver agreement, VEC MRI flow calculations were repeated by the same operator and by a second independent operator at 10 flow rates ranging from 0.5 to 4.9 L/min for the phantom experiments and in 10 subjects. The signal-to-noise ratios (SNRs) obtained with conventional and SENSE flow measurements were compared at these 10 different flow rates in the phantom experiment and in 10 subjects (one location each). The SNR and the SNR of the velocity measurement (SNRv) were calculated on the systolic frame with the maximum flow rate using the following formulae (24):
SNR ⫽
SNR v ⫽
SImean SDnoise vSNR
冑2venc
was assessed using Pearson’s correlation coefficient. Interobserver variability was calculated as the difference in flow rate measured by the two observers, expressed as a percentage of the flow rate calculated by the first observer. Intraobserver variability was similarly calculated.
RESULTS In Vitro Flow Measurements At 10 different flow rates ranging from 0.5 to 4.9 L/min, flow measurements by timed collection and conventional VEC MRI showed close correlation and agreement (correlation coefficient ⫽ 0.998, mean difference ⫽ – 0.13 ⫾ 0.99 L/min or 7⫾7%; Fig. 1). Over the same range of flows, conventional VEC MRI and SENSE VEC MRI flow measurements showed close correlation and agreement (correlation coefficient ⫽ 0.998, mean difference ⫽ – 0.01 ⫾ 0.08 L/min or 0.12% ⫾ 0.38%; Figs. 2 and 3). Flow measurements with each MRI technique were repeated three times at each flow rate. The maximum difference among the three measurements at each flow rate was 5% ⫾ 7% for VEC MRI and 9% ⫾ 6% for SENSE VEC MRI (P ⫽ 0.16), indicating high precision (i.e., repeatability) for both VEC MRI techniques.
(1)
(2)
where SImean is the mean signal intensity in the ROI, SDnoise is the standard deviation of noise, v is the mean measured velocity in the ROI, and venc is the velocity encoding value. The SNR and SNRv values of SENSE VEC MRI images are reported as a percentage of the SNR and SNRv of conventional VEC MRI images. Statistical Analysis For both in vitro and in vivo studies, flow rates measured by conventional and SENSE VEC MRI were compared using a two-tailed paired Student’s t-test. Analysis using the method of Bland and Altman (25) was performed to calculate the mean bias and its confidence interval. Differences in flow rate measured by the conventional and SENSE techniques were also expressed as percentages of the flow rate measured by the conventional technique. Correlation between techniques
Figure 1. Comparison of flow volume rate measured by conventional VEC MRI vs. timed collection in a pulsatile flow phantom. For each flow condition, the mean of three flow measurements was used for analysis. a: Correlation plot. The dashed line represents equality. b: Bland-Altman plot. The solid line is the mean difference, and the dashed lines are the upper and lower limits of agreement (mean ⫾ 2 SD).
Flow Quantification by MRI Using SENSE
679
shown in Table 3. There were no significant differences in variability between conventional and SENSE VEC MRI. SNR Analysis Compared with standard imaging, the use of SENSE reduced the SNR by 28% in the phantom (N ⫽ 10) and 27% in the patients (N ⫽ 22). The use of SENSE reduced the SNR of the velocity measurement (SNRv) by 27% in the phantom (N ⫽ 10) and by 24% in the patients (N ⫽ 22). DISCUSSION VEC MRI is an integral part of the MRI evaluation of patients with heart disease. Nevertheless, this technique is relatively time-consuming and thus prolongs the examination time and practically limits the number of measurements that can be performed. SENSE shortens the acquisition time by reducing the number and density of phase-encoding steps. Spatial aliasing, or foldover artifact, is a consequence of this reduction, but can be resolved or “unfolded” using coil sensitivity information (17). SENSE acceleration has been success-
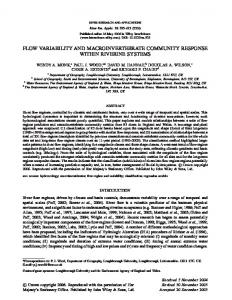
Figure 2. Pulsatile flow phantom images under the same condition using conventional VEC MRI (a: magnitude image; b: phase image) and SENSE VEC MRI with a reduction factor of 2 (c: magnitude image; d: phase image). e: Flow vs. time curves in the flow phantom under the same conditions measured by conventional and SENSE VEC MRI.
In Vivo Flow Measurements In the subjects (N ⫽ 33, median age ⫽ 24 years, range ⫽ 7– 69 years, 20 females and 14 males, mean heart rate ⫽ 74 ⫾ 13 bpm, range ⫽ 51–110 bpm), flow was measured once without SENSE and then once with SENSE in the ascending aorta (N ⫽ 33) and/or main pulmonary artery (N ⫽ 24; Figs. 4 and 5). As expected, utilization of SENSE with a reduction factor of 2 decreased the scan time by 50%, resulting in a mean scan time per measurement of 59 ⫾ 19 seconds. In both the ascending aorta and main pulmonary artery, flow measurements by VEC MRI with and without SENSE showed close correlation and agreement. In the ascending aorta the correlation coefficient was 0.965 and the mean difference was 0.08 ⫾ 0.3 L/min or 1% ⫾ 6.7% (Fig. 6). In the main pulmonary artery the correlation coefficient was 0.965 and the mean difference was 0.09 ⫾ 0.4 L/min or 1.7% ⫾ 7% (Fig. 7). Intraobserver and Interobserver Variability Intraobserver and interobserver variability results for analyzing the VEC MRI flow measurement data are
Figure 3. Comparison of flow volume rate measured by SENSE VEC MRI vs. conventional VEC MRI in a pulsatile flow phantom. For each flow condition, the mean of three flow measurements was used for analysis. a: Correlation plot. The dashed line represents equality. b: Bland-Altman plot. The solid line is the mean difference, and the dashed lines are the upper and lower limits of agreement (mean ⫾ 2 SD).
680
Prakash et al.
Figure 4. Representative images in the same subject of flow measurement in the ascending aorta using conventional VEC MRI (a: magnitude image; b: phase image) and SENSE VEC MRI with a reduction factor of 2 (c: magnitude image; d: phase image).
fully applied to several of the pulse sequences commonly used in cardiovascular MRI, including cine MRI using steady-state free precession (SSFP) and contrastenhanced MR angiography (CE-MRA) (26). Theoretical calculations predict that VEC MRI flow measurements with SENSE have increased variability, which may in
Figure 5. Flow vs. time curves in a subject measured with conventional and SENSE VEC MRI: (a) ascending aorta flow, (b) main pulmonary artery flow.
turn affect accuracy if unanticipated aliasing occurs (19). The current study provides in vitro and in vivo validation regarding the accuracy of SENSE VEC MRI using
Figure 6. Comparison of flow volume rate measured by SENSE VEC MRI vs. conventional VEC MRI in the ascending aorta (N ⫽ 33). a: Correlation plot. The dashed line represents equality. b: Bland-Altman plot. The solid line is the mean difference, and the dashed lines are the upper and lower limits of agreement (mean ⫾ 2 SD).
Flow Quantification by MRI Using SENSE
681
Figure 7. Comparison of flow volume rate measured by SENSE VEC MRI vs. conventional VEC MRI in the main pulmonary artery (N ⫽ 24). a: Correlation plot. The dashed line represents equality. b: Bland-Altman plot. The solid line is the mean difference, and the dashed lines are the upper and lower limits of agreement (mean ⫾ 2 SD).
a reduction factor of 2. In a pulsatile flow circuit, flow measurements made with and without SENSE were in close agreement over a range of flow rates typically found in medium and large blood vessels. In subjects with congenital and acquired heart disease, the use of SENSE decreased the acquisition time by 50% and there was close agreement with conventional VEC MRI for flow measurements in the ascending aorta and the main pulmonary artery. Intra- and interobserver variability was low, with no significant difference between the techniques. In addition, our data show that utilization of SENSE resulted in an approximately 25% reduction in the SNR and the SNRv, as expected. The
close agreement between SENSE and conventional VEC MRI flow measurements in subjects indicates that the effect of lower SNR and SNRv on accuracy is negligible for clinical flow measurements in larger blood vessels. However, lower SNR may have a greater impact on accuracy when measuring flow in smaller blood vessels. The results of this study are in general agreement with the only other published comparison of SENSE and conventional VEC MRI in the clinical setting (27). Beerbaum et al (27) validated the use of SENSE VEC MRI in children with left-to-right shunts and in a flow phantom. The present study confirms their major findings on a different scanning platform, and in a larger cohort of patients with a wider spectrum of heart disease. Unlike Beerbaum et al (27), we found significant reductions in SNRv with the use of SENSE both in vivo and in vitro, which is in agreement with theoretical predictions (19). This study validates the use of SENSE VEC MRI for flow measurement in larger blood vessels in older children and young adults. However, these results may not be valid in smaller blood vessels and young children, where reduced SNR and increased phase shift variability may have a more significant impact. The use of SENSE reduction factors greater than 2 and receiver coils with more than eight elements was not studied. The effect of heart rate and temporal resolution on the accuracy of VEC flow measurements in general was not examined. Although conventional and SENSE flow measurements in subjects were performed within a few minutes of each other, the comparison may have been confounded by alterations in physiologic state and blood flow in the interim. In conclusion, VEC MRI flow measurements performed with a SENSE reduction factor of 2 had a 50% shorter acquisition time and agreed closely with the conventional technique in vitro and in vivo. This reduction in VEC MRI scan duration can be used to shorten the total examination time, which is particularly important for marginally cooperative patients and young children who are sedated. Alternatively, when examining smaller vessels, the increased efficiency achieved with SENSE can be used to perform flow measurements with more phase-encoding steps and higher spatial resolution without increasing the scan duration. In the future, the use of SENSE-optimized coils with a larger number of receiver elements and higher SENSE factors will likely allow for further reductions in scan duration.
Table 3 Intraobserver and Interobserver Variability for VEC MRI Flow Data Analysis N Intraobserver variability (%) In vitro 20 In vivo 10 Interobserver variability (%) In vitro 20 In vivo 10
VEC MRI 0.7 ⫾ 2 0.34 ⫾ 3 2.7 ⫾ 8 3.3 ⫾ 13
SENSE VEC MRI
P value
2.4 ⫾ 5 0.25 ⫾ 2
0.36 0.91
3.9 ⫾ 9 4.2 ⫾ 4
0.85 0.78
682
REFERENCES 1. Firmin DN, Nayler GL, Klipstein RH, Underwood SR, Rees RS, Longmore DB. In vivo validation of MR velocity imaging. J Comput Assist Tomogr 1987;11:751–756. 2. Powell AJ, Maier SE, Chung T, Geva T. Phase-velocity cine magnetic resonance imaging measurement of pulsatile blood flow in children and young adults: in vitro and in vivo validation. Pediatr Cardiol 2000;21:104 –110. 3. Evans AJ, Iwai F, Grist TA, et al. Magnetic resonance imaging of blood flow with a phase subtraction technique. In vitro and in vivo validation. Invest Radiol 1993;28:109 –115. 4. Frayne R, Steinman DA, Ethier CR, Rutt BK. Accuracy of MR phase contrast velocity measurements for unsteady flow. J Magn Reson Imaging 1995;5:428 – 431. 5. Kondo C, Caputo GR, Semelka R, Foster E, Shimakawa A, Higgins CB. Right and left ventricular stroke volume measurements with velocity-encoded cine MR imaging: in vitro and in vivo validation. AJR Am J Roentgenol 1991;157:9 –16. 6. Bogren HG, Klipstein RH, Firmin DN, et al. Quantitation of antegrade and retrograde blood flow in the human aorta by magnetic resonance velocity mapping. Am Heart J 1989;117:1214 –1222. 7. Hundley WG, Li HF, Hillis LD, et al. Quantitation of cardiac output with velocity-encoded, phase-difference magnetic resonance imaging. Am J Cardiol 1995;75:1250 –1255. 8. Hundley WG, Li HF, Lange RA, et al. Assessment of left-to-right intracardiac shunting by velocity-encoded, phase-difference magnetic resonance imaging. A comparison with oximetric and indicator dilution techniques. Circulation 1995;91:2955–2960. 9. Hundley WG, Li HF, Willard JE, et al. Magnetic resonance imaging assessment of the severity of mitral regurgitation. Comparison with invasive techniques. Circulation 1995;92:1151–1158. 10. Mohiaddin RH, Underwood R, Romeira L, et al. Comparison between cine magnetic resonance velocity mapping and first-pass radionuclide angiocardiography for quantitating intracardiac shunts. Am J Cardiol 1995;75:529 –532. 11. Powell AJ, Tsai-Goodman B, Prakash A, Greil GF, Geva T. Comparison between phase-velocity cine magnetic resonance imaging and invasive oximetry for quantification of atrial shunts. Am J Cardiol 2003;91:1523–1525. 12. Honda N, Machida K, Hashimoto M, et al. Aortic regurgitation: quantitation with MR imaging velocity mapping. Radiology 1993; 186:189 –194. 13. Sakuma H, Saeed M, Takeda K, et al. Quantification of coronary artery volume flow rate using fast velocity-encoded cine MR imaging. AJR Am J Roentgenol 1997;168:1363–1367.
Prakash et al. 14. Fratz S, Hess J, Schwaiger M, Martinoff S, Stern HC. More accurate quantification of pulmonary blood flow by magnetic resonance imaging than by lung perfusion scintigraphy in patients with fontan circulation. Circulation 2002;106:1510 –1513. 15. Osada H, Machida K, Honda N. Quantification of regional pulmonary flow with 9mTc-MAA SPECT and cine phase contrast MR imaging. Ann Nucl Med 2002;16:423– 429. 16. Beerbaum P, Korperich H, Barth P, Esdorn H, Gieseke J, Meyer H. Noninvasive quantification of left-to-right shunt in pediatric patients: phase-contrast cine magnetic resonance imaging compared with invasive oximetry. Circulation 2001;103:2476 – 2482. 17. Pruessmann KP, Weiger M, Scheidegger MB, Boesiger P. SENSE: sensitivity encoding for fast MRI. Magn Reson Med 1999;42:952– 962. 18. Pruessmann KP, Weiger M, Boesiger P. Sensitivity encoded cardiac MRI. J Cardiovasc Magn Reson 2001;3:1–9. 19. Thunberg P, Karlsson M, Wigstrom L. Accuracy and reproducibility in phase contrast imaging using SENSE. Magn Reson Med 2003; 50:1061–1068. 20. Zhang H, Halliburton SS, Moore JR, et al. Ultrafast flow quantification with segmented k-space magnetic resonance phase velocity mapping. Ann Biomed Eng 2002;30:120 –128. 21. Powell AJ, Geva T. Blood flow measurement by magnetic resonance imaging in congenital heart disease. Pediatr Cardiol 2000;21:47– 58. 22. Pelc NJ, Sommer FG, Li KCP, Brosnan TJ, Herfkens RJ, Enzmann DR. Quantitative magnetic resonance flow imaging. Magn Reson Q 1994;10:125–147. 23. Rebergen SA, van der Wall EE, Doornbos J, de Roos A. Magnetic resonance measurement of velocity and flow: technique, validation, and cardiovascular applications. Am Heart J 1993;126:1439 – 1456. 24. Pelc NJ, Herfkens RJ, Shimakawa A, Enzmann DR. Phase contrast cine magnetic resonance imaging. Magn Reson Q 1991;7:229 –254. 25. Bland JM, Altman DG. Statistical methods for assessing agreement between two methods of clinical measurement. Lancet 1986;1:307– 310. 26. Weiger M, Pruessmann KP, Kassner A, et al. Contrast-enhanced 3D MRA using SENSE. J Magn Reson Imaging 2000;12:671– 677. 27. Beerbaum P, Korperich H, Gieseke J, Barth P, Peuster M, Meyer H. Rapid left-to right shunt quantification in children by phase-contrast magnetic resonance imaging combined with sensitivity encoding. Circulation 2003;108:1355–1361.