Journal of Rock Mechanics and Geotechnical Engineering. 2010, 2 (2): 162–168
Quantification of dynamic tensile parameters of rocks using a modified Kolsky tension bar apparatus S. Huang1, Rong Chen1, 2, K. W. Xia1* 1
University of Toronto, Toronto, M5S 1A4, Canada
2
National University of Defense Technology, Changsha, 410073, China
Received in 12 May 2010; received in revised form 20 May 2010; accepted 23 May 2010
Abstract: For brittle materials, the tensile strength plays an important role in mechanical analyses and engineering applications. Although quasi-static direct and dynamic indirect tensile strength testing methods have already been developed for rocks, the dynamic direct pull test is still necessary to accurately determine the tensile strength of rocks. In this paper, a Kolsky tension bar system is developed for measuring the dynamic direct tensile strength of rocks. A dumbbell-shaped sample is adopted and attached to the bars using epoxy glue. The pulse shaping technique is utilized to eliminate the inertial effect of samples during test. The single pulse loading technique is developed for the effective microstructure analyses of tested samples. Two absorption devices are successfully utilized to reduce the reflection of waves in the incident bar and transmitted bar, respectively. Laurentian granite (LG) is tested to demonstrate the feasibility of the proposed method. The tensile strength of LG increases with the loading rate. Furthermore, the nominal surface energy of LG is measured, which also increases with the loading rate. Key words: Kolsky tension bar system; dynamic tensile strength; single pulse loading
1
Introduction
It is well known that the tensile strength of a brittle material is usually only a fraction of its compressive strength. It is thus important to quantify the tensile strength of brittle materials, which is defined as the failure stress of a cylindrical specimen under pure uniaxial tensile loading. Following this definition, direct pull test seems to be best suited for tensile strength measurement. Indeed, standards have been developed for quasi-static direct pull testing methods by various research societies [1, 2]. However, the indirect tension methods were used in practice more frequently. This is because compared with the direct pull test, indirect tests usually feature simple instrumentation and high repeatability [3]. However, it is usually difficult to interpret the results from indirect tests. As an example, the tensile strength measured with bending methods is usually larger than that obtained from direct pull test, and the strength value depends on the specimen geometry. Various strength Doi: 10.3724/SP.J.1235.2010.00162 *Corresponding author. Tel: +416-978-5942; E-mail:
[email protected] Supported by the Natural Sciences and Engineering Research Council of Canada (NSERC) through Discovery Grant (72031326)
values obtained from indirect tests thus may not present the true material parameter (i.e. tensile strength). Although difficult in instrumentation, direct pull test is still needed to accurately quantify the material tensile strength. In various engineering applications, brittle materials may be subjected to dynamic loading. The quantification of dynamic material parameter is thus critical. It is thus the objective of this work to develop a system to accurately determine the dynamic material tensile properties of brittle solids. In laboratory, there are two convenient ways to induce dynamic tensile loading: modified Kolsky bar and Kolsky tension bar. Until the 1960s, Kolsky bar was used in compression only. There have also been several attempts to measure dynamic tensile properties using modified Kolsky bar. Harding et al. [4] seemed to be the first ones to demonstrate a tension version of modified Kolsky bar technique, which involved generating a compression pulse in a tube surrounding a solid inner rod. The tube and rod were connected by a mechanical joint. When the compression pulse in the outer tube reached the joint, which was a free end, it reflected back through the solid inner rod as a tensile pulse. A threaded tensile specimen was attached to the inner rod to provide mechanical connection necessary to transfer the tensile
S. Huang et al. / Journal of Rock Mechanics and Geotechnical Engineering. 2010, 2 (2): 162–168
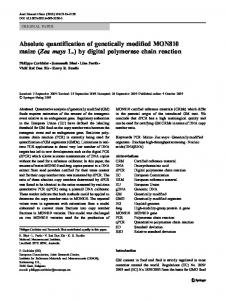
pulse through the specimen and into a second rod (Fig.1(a)). Lindholm and Yeakley [5] devised an alternate type of tension test based on the Kolsky bar technique. They utilized two Kolsky bars in compression test, one being a solid rod and the other a hollow tube. Tension was achieved through a complex hat-type specimen design, which was essentially a set of four very small tensile bars in parallel (Fig.1(b)). Although the test is easy to be performed, the specimen design requires considerable machining. In addition, it is not applicable for testing brittle solids. Nicholas [6] modified the Kolsky bar system by enclosing the threaded tensile specimen in a thick steel tube, which was in contact with the bar-ends attached to the tensile specimen. The compressive pulse was thus essentially sustained by the tube before it was reflected at the free end of the transmitted bar as tensile pulse. This pulse then loaded the sample because the tube could not sustain the tensile load (Fig.1(c)).
tension bar was presented in the pioneer work by Ogawa [9], who shot a tube striker to impact on the incident bar. The end of the incident bar was attached to a flange to generate a tensile loading pulse. This design was followed by many researchers [10–13] and became the standard loading design—Kolsky tension bar (KTB) [14]. The KTB technique gives not only the measurement of tensile strength, but also another important dynamic tensile property of rock, the dynamic surface energy utilizing the first law of thermodynamics. The resulted surface energy is comparable with those obtained from recent fracture tests on the same rock [15]. In this work, we adopt the striker tube idea. Furthermore, we use the pulse shaping technique to ensure that the dynamic force balance of the sample is achieved during the tests. It is shown that for dynamic compression, bending and fracture tests, the dynamic force balance is needed to guarantee valid testing results [16].
2 Flange Incident bar Specimen Transmitted bar Tube (a)
Incident bar Specimen Transmitted bar
Transmitted bar
(c)
(b) Mass
Mass
Incident bar
Specimen Transmitted bar
Explosive
Experimental techniques
Striker
Thick tube
Incident bar Specimen
163
Mass
(d)
Fig.1 Dynamic tension designs.
Another way to introduce dynamic tensile load to the sample is to directly generate the tensile loading pulse in the bar system. The earliest version of this Kolsky tension bar was developed by Albertini and Montagnani [7], who utilized both an explosive loading device and a rapid fracture of a clamp in a prestressed bar to generate the tensile pulse into the incident bar (Fig.1(d)). Goldsmith et al. [8] generated a tensile pulse by a ballistic impact. They attached a short plate to one end of the incident bar and shot a ball at the plate using a gas gun, which was placed in parallel to the bar. The resulted tensile pulse in the bar suffered from the bending wave generated by the asymmetric loading. The modern design of Kolsky
2.1 Generic working principles of KTB The KTB system is used to measure the dynamic tensile strength of Laurentian granite (LG). In our design, KTB is composed of a striker tube, an incident bar, a transmitted bar, and two absorption bars (Fig.2). Two stain gauges are mounted on the incident bar and transmitted bar, respectively. A dumbbell-shaped specimen is attached to the incident bar and the transmitted bar by epoxy glue. Because of the application to ductile materials, the screw thread connection was widely used in traditional KTB system to mount the specimen on the bar system. The unavoidable gaps in screw thread connections usually give rise to oscillations in stress waves due to multiple mini-impacts t
Separation point
Separation point
t
r i Absorption bar 1
i Strain gauge
Barrel
t
x Absorption bar 2
T1 T2
r Flange
Sample
Incident bar Adapter Flange Tube striker Transmitted bar
Fig.2 Sketch of KTB and x-t diagram.
S. Huang et al. / Journal of Rock Mechanics and Geotechnical Engineering. 2010, 2 (2): 162–168
Fig.3 Sketch of a dumbbell-shaped sample in KTB.
The striker tube is placed between the gun barrel and the incident bar, and is launched by a low speed gas gun. The impact of the striker tube on the flange of the incident bar generates a longitudinal tensile wave propagating in the incident bar as incident wave i . When the incident wave reaches the bar-specimen interface, part of the wave is reflected back as reflected wave r , and the remainder passes through the specimen and then enters the transmitted bar as transmitted wave t . These three waves are measured using strain gauges to infer the dynamic response of the material (i.e. stress-strain curve) subsequently. Using these three waves, the forces T1(t) and T2(t) on both ends of the specimen can be calculated:
T1 (t ) EA[ i (t ) r (t )]
(1)
T2 (t ) EA t (t )
(2)
where E and A are the Young’s modulus and the crosssectional area of the bars, respectively. The stress and strain of the sample are given by
s (t )
EA t (t ) As
s (t )
2C t r d Ls 0
striker tube are 25.4 and 38.1 mm, respectively. The diameters of the incident bar, the transmitted bar and the absorption bars all are 25.4 mm. The density is 7.8 Mg/m3, P-wave velocity is 5 063 m/s, and the Young’s modulus is 200 GPa at room temperature. The lengths of the striker tube, the incident bar, the transmitted bar and the absorption bars are 150, 2 000, 1 000 and 800 mm, respectively. 2.2 Dynamic force equilibrium The pulse shaping technique is employed to achieve dynamic force balance during the dynamic loading. Frew et al. [16] had a detailed discussion about the inertial effect induced by the mismatch of loads applied to both ends of samples during SHPB test; and they developed a pulse shaping technique to achieve a dynamic force equilibrium on samples. The pulse shaping technique in SHPB is especially useful for investigating dynamic responses of brittle materials such as rocks [16, 17]. This technique was introduced to the KTB system by Chen et al. [10]. Figure 4 shows a typical tensile test performed without the pulse shaping technique by the KTB system. The long unloading tail in the incident wave is caused by the cross-section mismatch between striker tube and incident bar (1.25:1), which is discussed by Song et al. [18]. According to Eqs.(1) and (2), the dynamic force on one side of the specimen, T1, is proportional to the sum of the incident and reflected stress waves, and the dynamic force on the other side, T2, is proportional to the transmitted wave. The force mismatch between T1 and T2 can be observed from the figure, which introduces error in subsequent data reduction for tensile strength. 100 Force (kN)
in the gaps, leading to significant error in the data reduction. Taking advantage of the brittleness of the interesting material, epoxy glue is used instead of attaching the sample to the bars. The quality of the waves is significantly improved. The dimensions of sample are illustrated in Fig.3.
Incident wave Reflected wave
50 0 50
100
(3)
0
25
50
(4)
where s (t ) and s (t ) are the stress and the strain of samples, respectively, assuming that the sample is in dynamic stress equilibrium; C is the longitudinal elastic wave velocity of the bar; and Ls and As are the length and the cross-sectional area of samples, respectively. The gun barrel, striker tube, incident bar, transmitted bar and absorption bars are made of high carbon steel (AISI1566). The inner and outer diameters of the
75 100 Time (s) (a)
125
150
175
125
150
175
15 T1 T2
10 Force (kN)
164
5 0 5 10
0
25
50
75 100 Time (s) (b)
Fig.4 Dynamic force balance check for a typical KTB test without the pulse shaping technique.
S. Huang et al. / Journal of Rock Mechanics and Geotechnical Engineering. 2010, 2 (2): 162–168
To achieve dynamic force balance, two C11000 copper discs are used as pulse shapers, which are emplaced symmetrically on the incident flange. The striker tube deforms two discs before it loads the incident flange, which generates a smooth rising tensile pulse propagating into the incident bar. This smooth pulse is loaded on the sample slowly, thus the dynamic force balance of the specimen is achieved. The first loading section in Fig.5 shows the forces on both ends of the sample in a representative test. It can be seen that the dynamic forces on both sides of the specimens are almost identical during the entire dynamic loading period. The inertial effects are thus eliminated because there is no global force difference in the specimen to induce inertial force. Incident wave
Force (kN)
The first loading
t
The second loading
Figure 6 compares two cases with and without front absorption. The second loading in the incident bar is reduced by 90% with the absorption design.
0 40 100
0
200
900 Time (s)
1 000
1 100
0.2 Amplitude (V)
15 10
T1 T2
5 0 5 10 15
With front absorption Without front absorption
0.3
(a)
Force (kN)
(5)
0
40
80
second reflected wave) has the similar amplitude with the first transmitted wave. The second loading is thus large enough to damage the sample. As a matter of fact, the fragment attached to the incident bar end suffers from spalling fracture in the real test. To avoid reflection from the free end of the incident bar, we follow the design by Nemat-Nasser et al. [14] for front wave absorption. In this design, the absorption bar 1 is placed in front of the incident bar with a precise gap. The impact of the striker tube with the incident wave will close up the gap. We require that when the reflected wave arrives at the impact end, the incident bar is in contact with the absorption bar 1. The reflection in the incident bar can thus be trapped in the absorption bar 1 (Fig.2). The gap d can be calculated as d 2C i d
Reflected wave
80
165
0.1
Reflected wave
0.0 Incident wave
0.1
Secondary incident wave
0.2 0.3 0
100
200
900 Time (s) (b)
1 000
1 100
Fig.5 Dynamic force balance check for a typical KTB test with pulse shaping.
2.3 Single pulse loading technique The single pulse loading technique was firstly introduced by Nemat-Nasser et al. [14]. In a traditional KTB test, the reflected and transmitted waves reverberate many times before they attenuate in the incident and transmitted bars. In tensile tests, specimens are glued or threaded to bars; the second pulses reflected from both the incident bar end and the transmitted bar end will further damage the sample. An example test illustrating the second loading is shown in Fig.5. For this test, the sample actually fails under the first load. However, the fragments are still attached to the bar ends. Examining the waves in the incident bar, we can see that the amplitude of the second loading (the second incident wave plus the
0
400
800
1 200
1 600
Time (s)
Fig.6 Comparison of waves in the incident bar with and without front absorption.
To avoid the reflection in the transmitted bar, the back absorption technique is developed, in which the absorption bar 2 is attached to the back end of the transmitted bar using a special joint (Fig.2). The absorption bar 2 has a flange attached to its front end. Before test, the absorption bar 2 is pulled away from the transmitted bar so that this joint is able to sustain tensile load. When the tensile load is reflected at the back end of the absorption bar, it becomes a compressive load (Fig.2). The joint can not sustain compressive load and thus the reflected wave is trapped in the absorption bar 2. Figure 7 illustrates the function of the back absorption. It can be seen that with the absorption method, the reflection is significantly reduced.
166
S. Huang et al. / Journal of Rock Mechanics and Geotechnical Engineering. 2010, 2 (2): 162–168
0.04
propagation toughness with semi-circular bend method. The energy carried by the three waves [21] is
With back absorption Without back absorption
W E 2 ACd t
0.02 Amplitude (V)
(6)
0
The total energy absorbed by the specimen then is DW = Wi - Wr - Wt
0.00 Transmitted wave 0.02 Reflected wave 0.04 0
200
400
600
800
1 200
1 000
1 400
Time (s)
Fig.7 Comparison of waves in the transmitted bar with and without back absorption.
3
3.1 Determination of loading rate The strength of rocks is affected by the dynamic loading rate [15, 19]. The loading rate is obtained from the time evolution of local tensile stress. Figure 8 shows the dynamic loading history of a typical test. There exits a regime of approximately linear variation of stress with time from 75 to 100 µs. The slope of this region is determined by least squares fitting, shown as a dotted line in the figure, and its slope is used as the loading rate. 20
Stress (MPa)
15
= 534 GPa/s 10
534 1
5
0 0
30
60
where Wi, Wr and Wt are the energies carried by the incident, reflected and transmitted waves, respectively. The fracture energy WG = DW . We assume that all fracture energy is used to create the new surface. Then the surface energy Gs is determined as Gs = WG / As
4
Data reduction scheme
90
120
(7)
(8)
Results and discussions
LG adopted in this research is a typical kind of homogeneous, isotropic and fine-grain granite. For tensile test, LG cores with 25 mm in diameter are first drilled from blocks. These cores are then sliced to cylinder with a nominal length of 38 mm. Then the diameter of center part is gradually reduced to 22 mm (Fig.3). The basic physico-mechanical properties of LG [22] are provided in Table 1. Table 1 Basic physico-mechanical properties of LG [22]. Density
Porosity Young’s modulus Poisson’s Uniaxial ompressive
(g/cm3)
(%)
(GPa)
ratio
strength (MPa)
2.63
0.64
92
0.21
220
Figure 9 shows a tested dumbbell-shaped sample. Sample fragments are still attached to the bars by epoxy glue. After test, the samples are split into two halves approximately along the center of the cylinder. Figure 10 shows the tensile strength values as a function of the loading rate. It can be seen that the tensile strength of LG is rate dependent: the tensile strength increases with the loading rate. This trend is characterized by a linear fitting in Fig.10 as
Time (s)
Fig.8 A typical tensile stress-time curve for determining loading rate.
3.2 Determination of surface energy An energetic method is used to calculate propagation fracture energy and fracture toughness. A similar method was used by Zhang et al. [20], who used a high-speed camera instead to estimate the fragment residual velocities. Chen et al. [15] used this method to calculate the surface energy of LG then
Fig.9 A typical tested LG sample.
S. Huang et al. / Journal of Rock Mechanics and Geotechnical Engineering. 2010, 2 (2): 162–168
surface energy increase with the loading rate, is not enough to accommodate the increase in the energy. Volumetric damage of materials adjacent to the fracture plane is more efficient to sink the energy. This mechanism was first observed and suggested for earthquake ruptures [25]. Although direct comparison is not possible, the values of surface energy of LG obtained in this work are comparable to those of fracture energy of LG measured earlier [15].
20
Tensile strength (MPa)
18
16
14
167
Fitting curve
12
5
10 0
100
200
300
400
500
Conclusions
600
Loading rate (GPa/s)
Fig.10 Dynamic tensile strength of LG.
11.6 0.010 8
(9)
where is the tensile strength of LG. This loading rate effect was reported in Refs.[22, 23] and the mechanism was discussed by Grady and Kipp [24]. Dai et al. [22] found similar phenomena in the indirect tensile tests for LG, i.e. Brazilian disc test and semi-circular bend test. This rate effect was accredited to the interaction of microcracks in rocks by Grady and Kipp [24]. In static tests, the main crack dominates the failure of samples. However, in dynamic tests, the interaction of microcracks plays an important role in the increase in sample strength before catastrophic failure. The nominal surface energy of LG is plotted in Fig.11 as a function of the loading rate. It is apparent that the surface energy increases with the loading rate. The physical reason of this loading rate dependence is of the same nature as the loading rate dependence of the fracture energy for the same rock [15]. It is noted that the increase in the surface roughness, which is commonly believed to be the main mechanism of 2.0
In this work, we developed a modified Kolsky tension bar system to investigate the dynamic tensile response of rocks. The pulse shaping technique using pulse-shaper was utilized to achieve the dynamic force balance. The dumbbell-shaped rock specimen was attached to the bars using high strength epoxy glue to improve the quality and accuracy of loading waves. Two absorption bars were used to trap the reflections in both the incident and the transmitted bars. The resulted single pulse load ensures valid damaged sample examination. The application of the KTB to LG reveals that the tensile strength is loading rate dependent. The rock surface energy was first measured using the KTB technique. It is discovered that the nominal surface energy is also loading rate dependent. The rate dependence may be related to the volumetric damage adjacent to the fracture or failure plane as suggested for earthquake ruptures.
Acknowledgements The support from China Scholarship Council is gratefully acknowledged. References [1]
American Society for Testing and Materials. ASTM D2936-08
Surface energy (kJ/m2)
Standard test method for direct tensile strength of intact rock core 1.5
specimens. Philadelphia: American Society for Testing and Materials, 2008. [2]
1.0
International
Society
for
Rock
Mechanics
Commission
on
Standardization of Laboratory and Field Tests. Suggested methods for determining tensile-strength of rock materials. International Journal of
0.5
Rock Mechanics and Mining Sciences and Geomechanics Abstracts, 0.0
1978, 15 (3): 99–103. 100
200
300
400
500
600
Loading rate (GPa/s)
Fig.11 Nominal surface energy of LG as a function of the loading rate.
[3]
Hudson J A, Brown E T, Rummel F. The controlled failure of rock disks and rings loaded in diametral compression. International Journal of Rock Mechanics and Mining Sciences and Geomechanics Abstracts, 1972, 9 (2): 241–248.
168 [4]
S. Huang et al. / Journal of Rock Mechanics and Geotechnical Engineering. 2010, 2 (2): 162–168 Harding J, Wood E D, Campbell J D. Tensile testing of materials at impact rates of strain. Journal of Mechanical Engineering Science,
[5]
1960, 2 (2): 88–96.
brittle materials with a split Hopkinson pressure bar. Experimental
Lindholm U S, Yeakley L M. High strain-rate testing: tension and
Mechanics, 2002, 42 (1): 93–106.
compression. Experimental Mechanics, 1968, 8 (1): 1–9. [6]
Nicholas T. Tensile testing of materials at high-rates of strain. Experimental Mechanics, 1981, 21 (5): 177–185.
[7]
[8]
[9]
1 268–1 276. [16] Frew D J, Forrestal M J, Chen W. Pulse shaping techniques for testing
Albertini C, Montagnani M. Testing techniques based on the split
[17] Frew D J, Forrestal M J, Chen W. A split Hopkinson pressure bar technique to determine compressive stress-strain data for rock materials. Experimental Mechanics, 2001, 41 (1): 40–46. [18] Song B, Connelly K, Korellis J, et al. Improved Kolsky-bar design for
Hopkinson bar. London: Institute of Physics, 1974.
mechanical characterization of materials at high strain rates.
Goldsmith W, Sackman J L, Ewert C. Static and dynamic fracture
Measurement Science and Technology, 2009, 20 (11): 115701.
strength of Barre granite. International Journal of Rock Mechanics and
[19] Dai F, Xia K, Luo S N. Semicircular bend testing with split Hopkinson
Mining Sciences and Geomechanics Abstracts, 1976, 13 (11): 303–309.
pressure bar for measuring dynamic tensile strength of brittle solids.
Ogawa K. Impact-tension compression test by using a split Hopkinson bar. Experimental Mechanics, 1984, 24 (2): 81–86.
Review of Scientific Instruments, 2008, 79 (12): 1–6. [20] Zhang Z X, Kou S Q, Jiang L G, et al. Effects of loading rate on rock
[10] Chen W, Lu F, Cheng M. Tension and compression tests of two
fracture: fracture characteristics and energy partitioning. International
polymers under quasistatic and dynamic loading. Polymer Testing,
Journal of Rock Mechanics and Mining Sciences, 2000, 37 (5):
2002, 21 (2): 113–121. [11] Li M, Wang R, Han M B. A Kolsky bar: tension, tension-tension. Experimental Mechanics, 1993, 33 (1): 7–14. [12] Nie X, Song B, Ge Y, et al. Dynamic tensile testing of soft materials. Experimental Mechanics, 2009, 49 (4): 451–458.
745–762. [21] Kolsky H. Stress waves in solids. Oxford: Clarendon Press, 1953. [22] Dai F, Xia K W, Tang L Z. Rate dependence of the flexural tensile strength of Laurentian granite. International Journal of Rock Mechanics and Mining Sciences, 2010, 47 (3): 469–475.
[13] Ross C A, Thompson P Y, Tedesco J W. Split-Hopkinson pressure bar
[23] Zhao J, Li H B. Experimental determination of dynamic tensile
tests on concrete and mortar in tension and compression. ACI Materials
properties of a granite. International Journal of Rock Mechanics and
Journal, 1989, 86 (5): 475–481.
Mining Sciences, 2000, 37 (5): 861–866.
[14] Nemat-Nasser S, Isaacs J B, Starrett J E. Hopkinson techniques for
[24] Grady D E, Kipp M E. Continuum modeling of explosive fracture in
dynamic recovery experiments. Proceedings: Mathematical Physical
oil-shale. International Journal of Rock Mechanics and Mining
and Engineering Sciences, 1991, 435 (1 894): 371–391.
Sciences and Geomechanics Abstracts, 1980, 17 (3): 147–157.
[15] Chen R, Xia K, Dai F, et al. Determination of dynamic fracture
[25] Poliakov A N B, Dmowska R, Rice J R. Dynamic shear rupture
parameters using a semi-circular bend technique in split Hopkinson
interactions with fault bends and off-axis secondary faulting. Journal of
pressure bar testing. Engineering Fracture Mechanics, 2009, 76 (9):
Geophysical Research, 2002, 107 (B11): ESE 6.1–ESE 6.18.