American Journal of Geographic Information System 2012, 1(2): 17-28 DOI: 10.5923/j.ajgis.20120102.01
Quantification of Land Transformation Using Remote Sensing and GIS Techniques Arshad Amin* , Shahab Fazal Department of Geography Aligarh M uslim University Aligarh 202002 India
Abstract
Urbanization is an inevitable part of economic development. Urbanization results in to changes in the landscape, specifically the proliferation of concrete and impervious surfaces, and the displacement of agriculture and forestland. Understanding these interactions between human activities and their consequences in landscape, is especially important in areas of the world that are experiencing rapid change, where the cu mulat ive impacts of development may be realized too late to trigger mitigation measures. The present study of land transformat ion in Srinagar city aims to demonstrate the utility of integrating existing maps with the satellite data and related geographic info rmation to dynamically map urban land transformation characteristics. This study provides a visual portrayal of gro wth and trends of transformat ion and conveys how the progress of modern urbanizat ion results in changes to the landscape. The analysis revealed that there has been a large scale land use/land cover change and transformat ions in Srinagar city during the study period of 30 years (1981-2011). Such change was validated by carrying out the estimat ion of Land Consumption Rate and Land Absorption Coefficient. Moreover, the study also projects the likely changes that might occur till the year 2021. The projections for change by the year suggest that there will be further expansion of the city on the fertile agricultural fields in its fringe area as of 1981-2011 study period. This research wo rk could present the diagnostic approach to the cause and effect relationship in in spatio temporal framework of urban geography.
Keywords Urbanization, Econo mic Development, Landscape, Land Transformation, GIS
1. Introduction Rapid pace of urbanizat ion is a global phenomenon in most of the developing countries. The urban population in these countries has grown by 40% between 1900 and 1975. Estimations suggest that 60% of the world’s population will be liv ing in the urban areas by the year 2025[1]. Similarly, India experiences rapid growth of population and urban expansion which has become a serious issue for the environmental scientists because of the intensifying problems of urban congestion, poor housing, irregula r and crowded transportation, lack of basic services and high employ ment rates. Urban g rowth brings the conversion of fert ile agricultural area, vegetation and wetlands to urban areas, increase in imperv ious surfaces and even the extinction of few land use/cover features e.g., natural drainages[2,3]. Land use/land cover pattern is an outcome of natural and socio-economic factors and their utilization by man in time and space. Land cover is the biophysical state of the earth’s surface and immed iate subsurface[4]. It deals with, for examp le, the quantity and type of surface vegetation, water, * Corresponding author:
[email protected] (Arshad Amin) Published online at http://journal.sapub.org/ajgis Copyright © 2012 Scientific & Academic Publishing. All Rights Reserved
and earth materials[5]. Land use concerns the function or purpose for which the land is used by the local hu man population and can be defined as the human activities which are directly related to land, making use of its resources or having an impact on them[6]. It is estimated that 1 to 2 million hectares of cropland is being converted to other urban land uses every year in developing countries to meet land demand for housing, infrastructure, industry and recreation[7]. Similarly, about 400,000 hectares of vegetation globally has been confirmed to be lost annually[8]. The understanding of land use/cover change has moved fro m simplicity to greater realis m and co mp lexity over the last decades[9]. In 1991, a new and expanded approach to the study of global environmental change was attempted where global change scientists were joined by social scientists to examine both human causes and global consequences of altered land use pattern on the earth[5]. Imp roved understanding of the complex dynamic p rocesses underlying land-use change will allow mo re reliab le project ions and more realistic scenarios of future changes. Crucial to projections is understanding of factors that control positive and negative feedback in land-use change. Similarly, understanding of processes of land-use change has led to a shift fro m a v iew condemning hu man impact on the environ ment as leading mostly to a deterio ration of earth system processes to emphasis on the potential for ecolog ical restoration
18
Arshad Amin et al.: Quantification of Land Transformation Using Remote Sensing and GIS Techniques
through land management[10]. Land use information can be used to develop solutions for natural resource management issues. Remote sensing (RS) and GIS techniques provide new tools for advanced land use management. GIS based multi-temporal land use data provides a historical vehicle for determining and evaluating long term changes in land use due to urbanization. The collection of remotely sensed data facilitates the synoptic analyses of Earth-system function, patterning, and change at local, regional and global scales over time; RS and GIS data also provides an important lin k between intensive, localized ecological research and regional, national and international conservation and management of bio logical diversity[11]. However, the objective of the present study is to attempt mapping out the LULC status of Srinagar city between1981-2011 with a view of detecting the land con-
sumption rate and land absorption coefficient. Lastly, the study tries to project the changes that might take p lace in the coming decade.
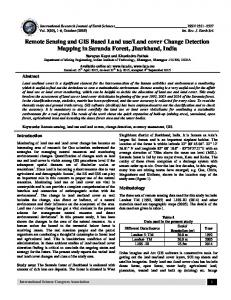
2. Study Area The study area is described in the follo wing paragraphs: The present study is done on Srinagar city wh ich lies between 33o 59'14'' N and 34o 12'37'' N lat itude and 74o 41'06'' E and 74o 57'27'' E longitude. The city is located on both sides of the River Jhelu m, locally called Vyeth in Kashmir (Figure 1), spreads between the plains of vale of Kashmir. It represents one of the, ecologically frag ile, economically developing, tectonically unstable and one of the densely populated mountain ecosystems.
Figure 1. Location map of srinagar city
American Journal of Geographic Information System 2012, 1(2): 17-28
19
Table 1. Details of satellite data used in the study S. No.
Data type
Path/Row
Date of Production
1
IRS-1D LISS-III
92/46
10-10-2010
2
IRS-1D PAN
92/46
10-10-2010
Wave length width in µm/Band 0.52-0.59 0.62-0.68 0.77-0.86 1.55-1.70 0.5-0.75
Spatial resolution (meter)
Swath (km)
Source
23.5
142
NRSA
5.8
70
NRSA
The general relief of the study area is 1580 m above mean sea level. The general terrain is moderate and represents hill topography. From t ime to time, the city was ruled by various rulers, belonging to different religions, regions and dynasties, shaping its land use according to their desires. Mughals in the 16th century designed the city as per their requirements and its imprints are found today also. Presently, it is summer cap ital of the state of Jammu and Kashmir and has grown with time and gained primacy in terms of functions associated with polit ics, administration, commerce, economic develop ment and tourism etc. It is an important urban centre of the state. Its population has increased more than five times during the past 50 years. The population of Srinagar city in 1951 was 2,55,679 which increased up to 9,52,324 in 2001, recording a growth of +51.06 per cent (the provisional population for 2011 is about 1.25 million). Social transformation in the city led to economic development resulting into land transformat ion.
limits of Srinagar city) was extracted by sub-setting of the town planning map. The images were interpreted and then digitized in GIS environ ment using ArcGIS 9.3 software in the form of polygons representing different land use/land cover categories. Ground control points were determined fro m the field global positioning system readings. Road centrelines were dig itized for all paved and unpaved roads at the time of map comp ilation. Level 1 classification system was follo wed and the data was classified into 9 land use land cover classes spread over a total area of 23446 hectares of the Srinagar city (wh ich is also the Municipal limits). The trend and pattern of urban expansion was calculated and every polygon representing the particular class was quantified and displayed in respective maps. Further the study carried out the land transformation analysis by superimposing these two time period land use/cover maps in GIS environment. The objective was to fill a mat rix showing transitions between the classified land use/cover categories.
3. Data Sets and Methodology
4. Statistics Applied
The data and the methodology used in this research work is explained in the below: The present study makes an attempt to evaluate the land use/land cover change and transformation and estimate the land consumption rate and land absorption ratio. The spatial data were developed for two points in time i.e., 1981 and 2011, processed in Geographic Information System (GIS). For the p reparation of early date Land use/land cover of the study area, Town planning map of Srinagar city 1981 on 1:15,000 scale was used. Similarly, the land use land cover for the later date was carried out using IRS-1D LISS III + PAN 2011 merged satellite imagery procured fro m Nat ional Remote Sensing Agency, Hyderabad, India (Table 1). A ll data were developed into Universal Transverse Mercator (UTM ) coordinate system, zone 43, with World Geocoded system (UTM W GS 84) project ion parameters. Both the images were first geo-corrected and geo-referenced in Earth Resource Data Analysis System (ERDAS) Imagine 9.0 software. Further for assistance in the process of interpretation SOI toposheet No. 43J/16 was also geo-referenced and was given similar pro jection and datum. Satellite imagery was stacked into different bands to produce a false colour co mposite; the area of interest was extracted by sub-setting of the image. The area of interest (Municipal
The statistical techniques applied in the present study are mentioned below: The comparison of the land use/land cover statistics assisted in identify ing the percentage change, trend and rate of change between 1981 and 2011. In achieving this, the first task was to develop a table showing the area in hectares and the percentage change for each year (1981 and 2011) measured against each land use/land cover type. Percentage change to determine the trend of change can then be calculated by dividing observed change by the earlier area mu lt iplied by 100. 1. Percentage change (trend) = observed change * 100 Sum of change 2. Rate of change in percent is calculated as change in between the two study years per total change of these years divided by the time interval times 100. 3. Land Consumption Rate = A P A = areal extent in hectares P = population 4. Land Absorption Coefficient = A 2 – A 1 P2 – P1 A 1 and A2 are the areal extents (in hectares) for the early and later years, and P1 and P2 are population figure for the
20
Arshad Amin et al.: Quantification of Land Transformation Using Remote Sensing and GIS Techniques
early and later years respectively[12]. ● L.C.R = A measure of co mpactness which indicates a progressive spatial expansion of a city. ● L.A.C = A measure of change in consumption of new urban land by each unit increase in urban population. The future expansion for the year 2021 was forecasted by correlating the current rate of expansion with the projected one. The 2021 population figures were estimated fro m the available 2011 population (provisional) figures of Srinagar city respectively for pro jecting the L.C.R and L.A.C. The first task to estimating the population figures was calculated by the formu la below: n = r/ 100 * Po (1) Pn = Po + (n * t) (2) Where: Pn = estimated population (2021) Po = base year population (2011 population figure) r = growth rate (2%) n = annual population growth
t = nu mber of years project ing for
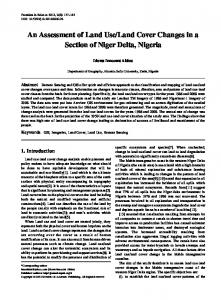
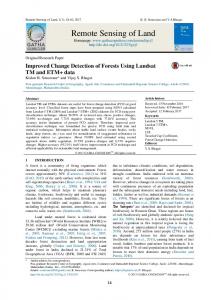
5. Results and Discussions The results and discussions which came out fro m the present study are exp lained under the following sub heads: 5. 1. Land Use/ Land Cover Distri bution of Srinag ar City Land use/cover was classified into 9 categories spread over 23446 hectares of Srinagar city conforming to the Municipal limits. These classes include, Built-up, Parks/ Gardens & Playgrounds, Vacant, Agricu lture, Plantation/Orchards, Forest, Barren, Marshy, Water body Figure 2 & 3). The rapid urbanization in the city has resulted into increase in built-up area and the resultant expansion (Figure 5). The statistics derived of different land use/cover classes is given in table 2 and the detailed explanation and the distribution of the above mentioned land use/land cover classes is given as follows:
Figure 2. Land use/land cover of srinagar city - 1981
American Journal of Geographic Information System 2012, 1(2): 17-28
Figure 3. Land use/land cover of srinagar city - 2011
Figure 4. Land transformation in srinagar city (1981 – 2011)
21
22
Arshad Amin et al.: Quantification of Land Transformation Using Remote Sensing and GIS Techniques
Table 2. Land use/Land cover Distribution of Srinagar city: 1981 & 2011 Land use/ Land cover Built-up area Parks/Gardens & Playground Vacant Agriculture Plantation/Orchard Forest Barren Marshy Water body TOTAL
1981
2011
2416
6251
(10.30%)
(26.66%)
140
372
(0.59%)
(1.59%)
517
255
(2.2%)
(1.08%)
14408
10949
(61.45%)
(46.7%)
1266
2622
(5.40%)
(11.18%)
and marshy areas covers more than 10% of the total area. Similarly, Srinagar city is an important tourist destination where people fro m all direct ions visit. Tourists flock its famous parks and gardens explicitly the Mughal gardens of 16th century. The different parks/gardens in the city covers about 2% of the total area of the city. The State is capable with good quality touris m potential ranging fro m the historical and natural sites to its scenic beauty. The state Tourism Depart ment generated revenue of Rupees 7346.51 lakh during the years 2004-05 to 2006-07[13]. 5.2. Land Use/Land Cover Change in Srinagar City
346
153
(1.47%)
(0.65%)
During the study period significant changes in land use/land cover were witnessed in Srinagar city (Table 3) which are exp lained below: Table 3. Land use/land cover change: Trend, Rate and Magnitude
539
480
(2.3%)
(2.05%)
1667
468
Land use/ Land
(7.1%)
(2%)
cover
2145
1895
(9.15%)
(8.08%)
23446
23446
Note: Area in hectares. SOURCE: Based on Town planning map of Srinagar city 1981 on 1:15000 scale and IRS-1D LISS III + PAN 2011 merged satellite imagery of Srinagar city
Srinagar city is the centre of trade, education, Arts and Crafts etc in the state of Jammu and Kashmir ever since its evolution. It has functioned as a central place in socioeconomic life, hub of political activit ies, place of important religious activities and the centre in the spatial framework. Therefore, Built-up contributes more than 26% land area to the total land use/cover of the Srinagar city Jammu and Kashmir is predominantly an agricultural state. Agriculture in its broad sense is the important industry of the state. Even those engaged in other sectors; depend on agriculture for food and raw materials. Agriculture class covers more than 46% of the total study area. Horticulture plays a significant role in the econo my of Jammu and Kashmir. It covers more than 11% of the total study area. It has an annual turnover of `2000 crores fro m fruits and dry fru its[13]. This sector has mainly g rown through People’s own determinant efforts, with meager support fro m the government. Since, it provides ample opportunities for sustaining large number of agro industries which generate substantial emp loyment opportunities. This activity is more remunerative than the crop growing activities. There are numerous places in Srinagar wh ich bear the names of different orchards e.g., Raj Bagh, Ghulab Bagh, Wazir Bagh, Mander Bagh etc. “Bagh” in locally means “an orchard” or “garden of fru its”. The city is having a network of lakes, rivers, ponds, reservoirs and wetlands giving a different look to the city landscape. These features also differentiate the city fro m the cities located elsewhere in the plain areas. These water body
Percentage
Annual Rate of
1981
2011
Change
2416
6251
3835
35.36
10.61
140
372
232
2.13
0.64
Vacant
517
255
-262
2.41
-0.72
Built-up area Parks/Gardens & P.G
change
Change
Agriculture
14408
10949
-3459
31.89
-9.56
Plantation/Orchard
1266
2622
1355
12.49
3.74
Forest
346
153
-193
1.18
-0.53
Barren
539
480
-59
0.54
-0.16
Marshy
1667
468
-1199
11.05
-3.31
Water body
2145
1895
-250
2.30
-0.69
TOTAL
23446
23446
10844
5.2.1. Bu ilt Up In the present study, built-up includes area of intensive use with much of the land covered by structures i.e., residential, scattered settlement, co mmercial, industrial, restricted and others (Educational, governmental, hospital and relig ious) land use categories. Analysis shows that the built up land has increased fro m 2416 hectares in 1981 to 6251 hectares in 2011 (increase of 178 percent) (Figure 5). This increase in built up area is attributed to increasing demand of land fro m growing population and the development made in secondary and tertiary sectors. The general trend of expansion has taken place along the roads which are in the radial pattern. The places where new unplanned residentials came into existence during the study period includes Zainakot, Malura, Parimpora and Bemina in west, Soura and Ahmad Nagar in the northern end and Magarmal Bagh in southwest of the city. Whereas newly planned residentials came into existence at Lal bazar in the north and Chanapora, Natipora, Bhagat Barzulla, Rawalpora in south and Bemina in the west. Unplanned residential area in the year 1981 was confined mo re or less to the core area on east and west bank of River Jhelu m.
American Journal of Geographic Information System 2012, 1(2): 17-28
Figure 5.
Built up expansion in srinagar city (1981 – 2011)
Figure 6. Non built-up area of srinagar city1981 & 2011
23
24
Arshad Amin et al.: Quantification of Land Transformation Using Remote Sensing and GIS Techniques
Co mmercial area was observed at Boulevard, Karan Nagar, Habba Kadal, Residency road, Po lo v iew, Court road, Kokar bazar, Maisuma, Wazir Bagh, Shaheed Gunj, Dal gate, all are located in and around the city centre i.e., Lal Chowk (CBD). A lso, Hazratbal area ad joining to Dal Lake, Fru it mandi area at Parimpora in the west are some other commercial areas which are away fro m the city centre. Industrial areas includes; Hindustan Machine Tools Watch factory at Zainakot in northwest. Bagh-i- Ali mardan Khan light industrial area, Khrew and Khanmou cement manufacturing industrial area in southeast of the city. Wineer industrial area at Parimpora located in the southwest of the city. Restricted area was observed at Badami Bagh cantonment area located on right bank of River Jhelu m to the north east of city centre, Tattoo ground military camp located in the far west of city centre, Srinagar Airport area (Army base) at Hu mhama in south of the city, Police colony at Khumani Chowk in south west, Raj Bhavan; governor’s residence at Chashma Shahi in East (at the foot hill of Zabarwan mountain). Sharifabad cantonment area; is the army base camp of Indo-Pak border in northwest of the city outskirts. It is also one of the oldest and largest cantonment areas of Srinagar. Educational class includes government and private schools, colleges, universities; Governmental class includes government offices, residential and quarters. Most of the government and educational offices are confined in the core area of the city, leading to excessive public dealings. Government and private hospitals and health centres were included in hospital category. Similarly, different graveyards, cremation grounds, and relig ious places were grouped in religious land use. 5.2.2. Parks/Gardens & Play grounds This class includes various parks/gardens and playgrounds where people carry out recreat ional activ ities and these form an important part of the city’s culture. In the year 1981 total land area under this class was 140 hectares (0.59% of the total study area) which increased to 372 hectares (1.59% of the total study area) in 2011. Despite urban expansion, the total area under this class increased by 232 hectares, because of being the important tourist destination and also one of the obvious indicators of urban sustainable development is the quality and quantity of green spaces in the city[14]. The Parks/ Gardens & Play grounds mapped include the famous Mughal gardens and others like Shalimar Bagh, Harwan garden, Nishat Bagh, Botanical garden, Tulip garden, Zabarwan Park, Golf course, Polo ground, Nehru Park, Cricket pavilion, Sher-i-Kashmir Park and Iqbal Park etc. 5.2.3. Vacant Vacant land includes the land belonging mostly to locals who left crop cultivation, most of which is speculative land holding. This class also includes the abandoned government land. In the year 1981, the total land area under this category was 517 hectares (2.2% of the total study area), which de-
creased to 255 hectares (1.08% of the total study area) in 2010 (i.e., decreased by 262 hectares). Capture of land market by the speculative developers and property dealers also the increasing demand from growing population, land prices have soared high. Therefore, some farmers d iscontinued the agricultural act ivities and left their lands unattended. They aim to sell off their land area at a good price in the near future. The existing vacant land was observed at Zakura & Tailbal in the northern end of the city, about 10-12 km away fro m city centre. Also good proportion of vacant land was mapped in the west and some patches at Ahmad Nagar in the west and northwest of the city. Although, vacant land was observed away fro m the city centre, but at the same time these areas are well connected with the roads. Increasing population pressure led to the movement of the well o ff people fro m the congested core area to the outskirts of the city. They purchase these vacant lands for residential purposes at very high prices. 5.2.4. Agriculture Agriculture class includes mostly Paddy land, Floating/vegetable gardens (Radh) and Saffron Karewa fields. In the year 1981 the total area under agricultural land use was 14408 hectares (61.45% of the total study area) which decreased to 10949 hectares (46.7% of the total study area) in 2011. Therefore 3459 hectares of agricultural land have been lost during the period of 30 years in the study area. Paddy is the dominant crop in agricultural land use. The decrease in its area is attributed to the expansion of the built up area on fertile agricultural land and occupational shift of the people fro m primary to secondary and tertiary activities. Moreover the shift fro m crop growing activ ities to the horticulture activities by many agricultural land owners led to the decrease in the total area under agricultural land use. The dominant Paddy growing areas were mapped in the west, south and also in north eastern hilly areas. The practice of vegetable gardens/Floating garden are predominantly observed in the western parts of Dal Lake and Khushalsar wet land in the north. These gardens are owned by the boatmen (locally called Hanjis) who cu ltivate vegetables on these movable lands on water surfaces. Saffron cult ivation is practiced on the famous Karewas in the southeast of the city which is an outstanding land use feature of Kash mir, where world’s best Saffron is grown. 5.2.5. Plantation/Orchard This class includes Willow p lantation, Apple, Cherry, Almond, Walnut orchards, distributed all over the city away fro m the core area. In the year 1981 the total area under this class was 1266 hectares (5.40% of the total study area) which increased to 2622 hectares (11.18% of the total study area) in 2011. This class has increased by 1355.5 hectares. Significant proportion of land under orchards was observed in north, some patches were also mapped in southwest and southern end of the study area. Similarly, willo w p lantation was observed in small
American Journal of Geographic Information System 2012, 1(2): 17-28
patches spread all over the study area. Significant area under willow plantation was observed along the banks of River Jhelu m in the west. So me Willow plantation was also observed in the east along the foot hills of Zabarwan mountains, also in Lokut Dal area where marshy area has been transformed into willow p lantation area by Boatmen (Hanjis). The crop cultivators replaced significant area with horticulture activities which has made dependency of significant share of the economy on these orchards.
25
Nambal located in the core area, small patches at Bemina and Parimpora in the West etc. Presently these areas are inhabited by boatman (Hanjis) who earn their inco me fro m these marshy areas by cultivating those fruits and vegetable which need water throughout their growth period. 5.2.9. Water body
Water body class includes the rivers, lakes and water reservoirs of the city. In the year 1981, the total area mapped under this category was 2145 hectares (9.15% of the total 5.2.6. Forest study area) which decreased to 1895 hectares (8.08% of the Forest class includes the dense vegetation cover observed total study area) in 2011. Because of anthropogenic pressure in the hilly areas of the study area. In the year 1981, the total almost all the water bodies have decreased by more than 250 area under this class was 346.5 hectares (1.47% of the total hectares during the study period. study area) wh ich decreased to 153.5 hectares (0.65% of the The existing water bodies of the city wh ich have been total study area) in 2011, hence decreased by 193 hectares. observed in this study includes; the Dal Lake, Nigeen Lake, Forest cover has decreased because of increased anthropo- River Jhelum, Brari nambal, Tailbal Nallah and Harwan genic pressure. Poor people who could not manage to get water reservoir. The lakes are the centres of tourist attraction land on the plain areas cleared the forest areas in the foot hills adding to the total revenue in tourism industry. But at the and managed to live there. It was observed in the hilly areas same t ime, these water bodies are getting deteriorated both in of the city i.e., Koh-i-Maran and Koh-i-Sulaiman, and also in area as well as in their quality of water. Shikaras (ferry) and the southeast at Zabarwan foot hills. the Houseboats are the major attraction in these water bodies. River Jhelum is another important water body of Srinagar 5.2.7. Barren city, which originates in the south east of Kashmir at a spring In this study, barren class includes the bare exposed rocks, (Verinag). During its course, it dissects Srinagar city dialong with some quarrying area. These are the areas of less agonally in southeast to northwest direction. Also, various vegetation and have limited ability to support life. In the year other small t ributaries jo in it during its course. Northern area 1981 the total area under this class was 539.5 hectares (2.3% of Brari nambal in the core area, Tailbal Nallah located to of the total study area) which decreased to 480 hectares (2.05% the northeast of Dal Lake which also feeds the Lake. Harwan of the total study area) in 2011, thereby losing 59.5 hectares. water reservoir at Harwan in the northeast of city, feeds most This class has been mapped in the rocky areas of the study parts of the city. area i.e., the bare rock surfaces of Koh-i-Maran and Koh-i-Sulaiman hills. Similarly, some patches in the north- 6. Land Transformation in Srinagar west, Khanmou quarrying site in the southeast, also some City patches were mapped in north at Alestang and New Theed’s hilly areas. The decrease in area is attributed to the capturing Land is in a continuous state of transformation as a result of barren land by other built-up classes because of increasing of various natural and man-made processes[15]. Land demand for land fro m the growing population. transformation has been asserted as one of the important fields of human induced environmental t ransformat ion[16]. 5.2.8. Marshy An important aspect of change detection is to determine what Marshy area is included in the wetlands category. It in- is actually to what i.e., which land use class is changing to cludes the wet lands observed in and around the water bodies the other. This informat ion reveals both the desirable and of the city. In these areas water table is at, near, or above the undesirable changes and classes that are relatively stable land surface for a significant part of the year. In the year overtime. Th is information also serves as a vital tool in 1981 the total area under this category was 1667 hectares management decisions. During the study period, Srinagar city has not only ex(7.1% of the total study area) wh ich decreased to 468.5 hectares (2% of the total study area) in 2011. A mong all the panded from its original size but there was significant inland use/land cover classes, marshy class is the prime v ictim terchange of land among various land use/cover classes. of urban expansion in Srinagar city. It lost 1198.5 hectares These changes are because of the development of city reduring the period of 30 years. Because of population growth sulting in increased demand of land for residential, co mand poor implementation of government proposals, signifi- mercial, industrial etc. purposes. This demand o f land along cant areas fro m these marshes have been converted into with site attraction, functional convenience, functional residential areas. Most of them have got completely ext inct magnetis m and the land value of that particu lar area u ltie.g., Rakh-i-Gandakshah and Rakh-i-Arat marsh in the west. mately influence the pace and direction of urban land Presently, it exists only at few locations i.e., in the eastern transformation. Table 4 and Map 3, shows this transformation between part of Dal Lake, Khushalsar marsh in the north, Brari
26
Arshad Amin et al.: Quantification of Land Transformation Using Remote Sensing and GIS Techniques
1981 and 2011. It was observed that the growth has taken place away fro m the city core area following the theory of city growth as propounded by Christaller (1933). Transformat ion process is evident all over the city explicitly towards the outer areas. Thus shows the expansion of the city towards its periphery. Significant land transformation was witnessed among built-up area, vacant, plantation/orchards, agriculture and water bodies/marshy lands. Bu ilt-up area increased by 3835 hectares, capturing land main ly fro m agricu lture, vacant, plantation/orchards and marshy area. Parks/ Gardens and play grounds increased by 232 hectares, gain ing area fro m plantation and forest area. Plantation/orchards land lost 689 hectares; this loss was gain for built-up, parks and orchards, and vacant area. At the same t ime plantation/orchard gained by 1355 hectares from agriculture, vacant, marshy, water body and forest classes. Vacant lost its 262 hectares to built-up area for residential and co mmercial development and also for agricu lture and horticu lture area expansion. Agriculture lost 3459 hectares of land for residential, co mmercial, industrial, parks and gardens and plantation/orchards. Marshy area and water bodies lost 1449 hectares area mainly to agriculture, p lantation/orchards, residential and governmental land use. The urban expansion in Srinagar city has also brought
ecologically important land use classes under the transformat ion process. For examp le, forests have been cleared down for bringing up settlements, parks/gardens and play grounds, plantation/orchards etc for various socio-economic purposes, which is a loss to the ecology. At the same time, rocky surfaces i.e., the barren land was brought under residential, parks and gardens. This is scientifically indifferent pattern of land transformation, but the widening gap between the growing population and the available land led to the emergence of such situation. Unorganised planning and political instability in the Kashmir region has also played its part in transforming the city into unplanned one. Most of the vacant land best suited for co mmercial purposes has been consumed unplanned. Unemployed youth try to establish business activities of their own without proper registrations from the government organization hence leading to self selection of locations. Further development in the city will further lead to the land transformation. Though the Master plan for the state is already prepared still the implementations are lacking. Analysing the nature of the change under stability i.e., areas with no change and instability loss or gain by each class between 1981 and 2011 as observable in table 4, stability seems to be a relative terms as no class is actually stable during this period.
Table 4. Srinagar City: Land Transformation (1980 - 2010) 1 Built-up
Land Use 1. Built-up 2. Parks & Gardens 3. Vacant 4. Agriculture 5. Plantation/Orchards 6. Forest 7. Barren 8. Marshy 9. Water body
2 Prk/gr
2416
3 Vac
4 Agr
5 Pl/Orc
6 For
7 Bar
8 Mar
9 Wat
385
2932
71 83
59
126
03
517 109 215
185 14408 1854
258 149 68.5 214 1266
1041.5 88
148 42
1667 35
92 2145
140
39 346 539
TOTAL Area (2010) 6251 372 255 10949 2622 153 480 468 1895
Note: Area in hectares. Figures in bold (diagonally) are area under that particular land use in 1981, while the figures in the same column represent the conversion in area to other land uses. Similarly, figures in the same row are increas es in area, captured from other land uses. SOURCE: Based on IRS-1D LISS+PAN Satellite imagery (2011) and Town planning map (1981) of Srinagar city.
Table 5. Land Consumption Rate and Consumption Ratio YEAR
LAND CONSUMPTION RATE
YEAR
LAND ABSORPTION COEFFICIENT
1981
0.004
1981/2011
0.006
2011
0.005
2011/2021
0.005*
2021
0.005
*Estimated
Table 6. Population figures of Srinagar city, 1981, 2011 & 2021 YEAR
POPULATION FIGURE
SOURCE
1981
6,17,672
Census of India
2011
12,50,000
Census of India
2021
15,00,000
Estimated
American Journal of Geographic Information System 2012, 1(2): 17-28
27
Table 7. Land Use Land Cover Projection for 2021 Land use Land cover classes 2021
BUP
PRK
VAC
AGRI
PL/OR
FOR
BAR
MAR
WAT
Area in Hectares
8051.33
499.33
157.67
9286
3027.66
77.67
467.34
78.34
1801.5
Area in Percentage
34.33
2.12
0.67
39.60
12.91
0.33
1.99
0.33
7.68
7. Land Consumption Rate, Consumption Ratio and Future Projections Land consumption rate which is a measure of co mpactness indicates a progressive spatial expansion of a city (Table 5); being high in 1981/ 2011 and as per the projected land use, it will further increase between 2011 and 2021, because of the growing population (Table 5 & 6). Also, land absorption coefficient being a measure of consumption of new urban land by each unit increase in urban population was significant between 1981 and 2011. Th is therefore suggests that the rate at which new lands are acquired for develop ment is high. As per the projected expansion it will be high between 2011 and 2012. This may also be the trend in 2011 to 2021 as there seems to be the expansion of the city centre towards the outskirts. This is because of the fact that the city core area has become congested. Govern ment has made strategies to decongest the core area where in various government and private offices have been shifted to the west of the city. Moreover, the well off people fro m the core areas prefer to move towards the outskirts on open spaces. Table 7 shows the statistics of land use/land cover projection for 2021. This step is taken with the intention of giving an insight to what LULC situation of Srinagar city will look like by the year 2021. Co mparing the figures with table 2 there exist significant changes in classes between 2011 and 2021. Thus the projected figures reveal that agriculture maintains the highest share in the total land use followed by built-up class. Vacant, forest and parks and gardens retains the lowest position. Plantation/orchards and water body maintains significant share among all the other land uses.
8. Conclusions The above discussed study can be concluded as follows: Located in the heart o f the bowl of Kash mir valley; Srinagar city is its capital city, ever since its creation. The analysis reveals that besides the physiographic limitations, there has been widespread urban expansion in Srinagar city during the study period of 30 years (1981-2011). Built-up area has increased by 3835 hectares, which is the combination of anthropogenic activities and it is the one that affects the other land use/cover classes. In ach ieving this Land Consumption Rate and Land Absorption Coefficient were introduced in this research work. The widening gap between the available land and the growing population has resulted into increase in land consumption rate and land absorption
coefficient, which shows the urban expansion. Further, the estimated projected population observed that change by 2021 may likely fo llo w the trend of 1981/2011 all conditions being equal. This could lead to more built-up congestion and expansion of the city on the fertile agricultural land in its fringe area. The economic development in the city has triggered social transformation lead ing to the change and interchange of land use/cover classes. Its land use accommodates every decision making centre and various other government and private resource centres which sets a chain of interaction, and boosts activities of the population of capital city with the people of different areas and urban centre of Kashmir valley. This has triggered the movement of people fro m rural areas to the city, which has accentuated the process of land use change and transformation. Agriculture land has been witnessed as the prime v ictim of this land transformation which has lost 3459 hectares during the study period. Vacant, forest, barren marshy and water bodies are the other pro minent victims of land transformation in Srinagar city.
REFERENCES [1]
Adesina FA, Siyanbola WO, Okelola FO, Pelemo DA, Ojo LO, Adegbulugbe AO (1999). Potentials of agroforestry for climate change mitigation in Nigeria, some preliminary estimates. Glob. Ecol. Biogeogr. Lett., 8: 163-173.
[2]
Amin A and Fazal S, (2012) Land Transformation Analysis using Remote Sensing and GIS Techniques (A Case Study), Journal of Geographic Information System, vol 4(3) in press.
[3]
Amin, A., Amin A., Singh, SK., (2012) “Study of urban land use dynamics using geospatial approach”, Bulletin of Environment and Scientific Research, vol 1(No 2), pp. 18-24.
[4]
Burley, T.M., (1961) “Land use or land utilization?” Professional Geographer, vol. 13, (6), pp. 18-20.
[5]
Doos BR. 2002. Population growth and loss of arable land. Glob. Environ. Change: Hum. Policy Dimens. 12(4):303–11.
[6]
FAO (Food and Agriculture Organizat ion) (1995) “Planning fo r Sustainable Use of Land Resources”. FAO Land and Water Bulletin 2. Ro me: Food and Agriculture Organization of the United Nat ions, p 21.
[7]
Fazal, S and Amin, A., (2011), Impact of urban land transformation on water bodies in Srinagar city, India. Journal of environmental protection, vol 2 (No 2), pp. 142-153.
[8]
Herold, M ., Goldstein, N. and Clarke, K., (2003) The Spatiotemporal form of urban growth: M easurement, analysis and
28
[9]
Arshad Amin et al.: Quantification of Land Transformation Using Remote Sensing and GIS Techniques
modeling. Remote sensing of Environment Vol. 86(3), pp.286-302.
ronment and Urbanization, Vol. 12. No. 2, pp 133-149. doi:10.1177/095624780001200211.
Herold, M ., Roberts, D., Gardner, M . and P. Dennison (2004) Spectrometry for urban area remote sensing - Development and analysis of a spectral library from 350 to 2400 nm, Remote Sensing of Environment, 91, 3-4, 304-319.
[16] Socio economic profile of Jammu and Kashmir (2008), Directorate of economics and statistics, Jammu and Kashmir, pp, 82-89.
[10] Huang, S.L., Wong, J.H & Chen, T.C (1998) A framework of indicator system for measuring Taipei’s urban sustainability. Landscape and urban planning, Vol, 42, pp. 15-27. [11] Ifatimehin, O.O. (2007). “An Assessment of Urban Heat Island of Lokoja Town and Surroundings Using Landsat ETM Data”. FUTY Journal of the Environment, Volume2 (1): 100-108. [12] Jenson, J.R., and Cowen, D. C. (1999). Remote sensing of urban/suburban infrastructure and socio-economic attributes. Photogrammetric Engineering and Remote Sensing, Vol. 65(5), pp.611-622. [13] Lambin, E.F., Geist, J.H., and Lepers, E., (2003) Dynamics of land use and land cover change in tropical regions, Annual Review of Environmental Resource, p-207. [14] M eyer, W.B and Turner II, B.L (1994) (editors), Changes in Land use and Land cover: A Global Perspective, The press syndicate of University of Cambridge, U.K. [15] S. Fazal, (2000) “Urban Expansion and Loss of Agricultural Land,” A GIS Based Study of Saharanpur City, India. Envi-
[17] Turner, B.L. II., Skole, D., Sanderson, S., Fischer, G.,
Fresco, L and Leemans, R., (1995) “Land Use and Land Cover Change”, Science/Research Plan. IGBP Report No.35, HDP Report No.7. IGBP and HDP, Stockholm and Geneva, pp. 20-25.
[18] UNPF (1999). The State of World Population, pp. 76. New York: United Nations Publications. [19] USEPA (2001). “Our Built and Natural Environment: A Technical Review of the Interactions Between Land Use”. Transportation and Environmental Quality. Pp. 4. [20] Victor DG, Ausubel JH. 2000. Restoring the forests. Foreign Aff. 79(6):127–44. [21] Vitousek, P.M ., M ooney, H.A., Lubchenco, J and M elillo, J.M ., (1997) “Human domination of Earth’s ecosystems.” Science, vol. 277, pp. 494-499. [22] Wilkie DS, Finn JT (1996). Remote Sensing Imagery for Natural Resources M onitoring. New York: Columbia University Press, p. 295. [23] Yeates, M and Garner, B. (1976). The North American City, Harper and Row Pub. New York.