Research Notes Quantification of the Spatial Distribution of Surface Temperatures of Broilers Ö. Cangar,* J.-M. Aerts,* J. Buyse,† and D. Berckmans*1 *Katholieke Universiteit Leuven, Faculty of Bioscience Engineering, Biosystems Department, Measure, Model & Manage Bioresponses, M3-BIORES, Kasteelpark Arenberg 30, B-3001 Leuven, Belgium; and †Katholieke Universiteit Leuven, Faculty of Bioscience Engineering, Biosystems Department, Laboratory for Physiology, Immunology and Genetics of Domestic Animals, Kasteelpark Arenberg 30, B-3001 Leuven, Belgium ABSTRACT Thermal comfort is of great importance in chickens to preserve body temperature homeostasis during the growth period and during environmental thermal challenges. Because surface temperatures contribute much to thermal comfort, this research is aimed at studying spatial distribution of surface temperatures of broiler chickens. For this purpose, temperatures of 26 different parts on the chicken body surface were measured using thermography during the growth period of 6 wk. It was observed that there were significant differences in spatial distribution of broiler surface temperatures. The greatest temperatures were measured at the positions with little or no feathering (i.e., cheek, skull,
and inner thigh). The least temperatures were observed on the places with thickest feather cover (i.e., wing and breast). The surface temperatures decreased as a function of age from approximately 36 to 28°C. The spatial temperature range on the surface of the bird varied from 6°C in wk 1 to 15°C on wk 6. Temperature differences between the surface of the chicken and its surroundings were also studied, and it was found that in the range of 1 to 6 wk the age of the bird had significant effects on temperature difference (P < 0.0001). The temperature difference between the surface of the chicken and environment was at a maximum on wk 4 during the growth period of 6 wk.
Key words: temperature difference, temperature gradient, thermoregulation, broiler 2008 Poultry Science 87:2493–2499 doi:10.3382/ps.2007-00326
INTRODUCTION Quantifying an animal’s surface temperatures and its relation with the thermal environment is of prime importance in thermal biology. The difference between the temperatures of animal surface and the thermal environment is the driving force of sensible heat transfer (convection and radiation). Heat flow from and to the environment is a function of the temperature of the exposed surface (Prosser and Heath, 1991; Yahav et al., 2004). The contribution to heat exchange of surfaces whose temperature is close to the environmental temperature is small, whereas the surface whose temperature is constantly greater or lesser than the environmental temperature contributes significantly to heat exchange. Thus, in calculations of sensible heat transfer of different surface parts (of a bird) surface temperature measurement is a key element (Yahav et al., 2005). It has been found that the temperatures of the core and feathered skin of a broiler chicken varied by not more than 5°C when exposed to a range of ambient ©2008 Poultry Science Association Inc. Received August 6, 2007. Accepted August 2, 2008. 1 Corresponding author:
[email protected]
temperature from 20 to 40°C. However, the surface body parts such as comb, shank, and toe varied by up to 20°C and exhibited wide fluctuations in constant environmental conditions (Richards, 1971). Skin temperature variation in time was observed during the course of the day as well as a function of age (Tessier et al., 2003). Physiologically, control over the rate of heat transfer is exercised by altering the flow of blood to the body surface or by altering the rate of evaporation of water from the skin (perspiration) or respiratory tract (evaporation). Birds possess a thick, highly insulating coat of feathers over most of the body surface and lack sweat glands. Surface temperature changes according to the age of the animal (Richards, 1970). Change in time is dependent on number and quality of the feathers in different places, which act like an insulation layer. At greater temperatures evaporative cooling becomes increasingly important, and when environmental temperature equals the temperature of the body surface it finally represents the only way for loss of heat (Kleiber, 1961). In their study with naked neck chickens, Yahav et al. (1998) proved the ability of the naked neck chickens, on the one hand, to thermoregulate at low ambient temperatures and, on the other hand, their slightly better
2493
2494
Cangar et al.
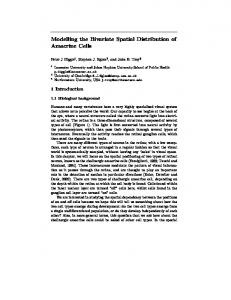
Figure 1. Overview of the different positions on the chicken used in the 3-dimensional analysis of surface temperature. Side view (S): (1) cheek, (2) skull, (3) neck, (4) crop, (5) breast, (6) wing, (7) thigh, (8) drumstick, (9) shank, (10) pelvis, (11) cloaca. Bottom view (B): (1) crop, (2) upper part of breast, (3) mid part of breast, (4) abdomen, (5) cloaca, (6) upper wing, (7) inner thigh. Top view (T): (1) comb, (2) skull, (3) neck, (4) shoulder, (5) back, (6) sternum, (7) upper wing, (8) wing.
capacity to maintain body temperature at high ambient temperatures. Regulation of body temperature in dehydrated chickens was studied by Zhou et al. (1999). They suggested that dehydration leads to a lesser blood volume, which results in a decrease in blood flow to heat exchange organs and surfaces in broilers. This induces less sensible heat loss from extremities, less evaporative heat loss, and a greater sensible heat loss from trunk, subsequent to regulating their body temperature at a greater level of deep body temperature. Thermography can be useful to study temporal skin temperature variations related to cellulitis lesions. Therefore skin temperature measurement using thermography in broiler chickens was studied by Tessier et al. (2003). Effects of potential confounding factors, such as bird’s handling duration, abdominal size, age, and time of day, were also estimated. Mean skin temperature was estimated from thermogram pictures by computer image analysis of a predetermined abdominal area. Spatial gradients of surface temperatures in chickens were also studied by other researchers. Richards (1971) measured surface temperatures on 7 places by a surgical implantation of thermocouples. Using a similar thermography method, Yahav et al. (1998) quantified the surface temperatures, but the research did not consider the effect of the bird’s age on the results. Making use of thermography as well, Tessier et al. (2003) deter-
mined only the distribution at the abdominal area and only 3 discrete times during the rearing period. The objective of this study was to quantify the spatial temperature distribution of 26 different points on the surface of broiler chickens using thermography. Although it was not aimed to calculate the exact heat losses from the birds, differences in surface temperature and the environmental air temperature were also studied to have an idea on the driving force in heat loss from the broiler chicken through its commercial growth period of 6 wk. In addition to that age-associated variation in temperature was studied to evaluate age-related changes in body temperature. Thus, in the light of past research, this study proposes a further detailed analysis on the spatial gradient of surface temperatures on 26 different places on the bird body surface continuously during the rearing period.
MATERIALS AND METHODS Birds and Housing The measurements described here were conducted during larger growth control experiments (Aerts et al., 2003a,b). The ethical commission of the Katholieke Universiteit Leuven approved the performed experiments. All the experiments were conducted with Ross 308 broilers, mixed-sex, obtained from a local hatchery
1.0a 2.7ab 1.4ab 1.7ab 4.7ab 1.5b ± ± ± ± ± ± 34.4 35.9 35.6 35.9 31.7 30.6 1.6 2.6ab 0.9ab 2.9ab 4.5ab 1.0b ± ± ± ± ± ± 35.2 36.3 34.6 34.4 33.0 27.3 2.0 5.2 1.6 1.4 1.0 2.2 ± ± ± ± ± ±
Pelvis Shank
38.8 37.8 39.3 40.2 38.4 37.3 1.2 3.0ab 1.6ab 1.9ab 0.9b 1.1a 0.6 2.6ab 3.1ab 2.8ab 2.7b 1.1a
36.0 36.4 35.8 35.1 30.4 28.3
± ± ± ± ± ±
a
Drumstick
1.6 2.8ad 1.2bd 0.7bc 1.0c 1.3c
36.3 35.6 35.6 35.9 32.1 28.1
± ± ± ± ± ±
a
Thigh
a–d
Means within a column with no common superscript differ significantly (P < 0.05). The temperatures were measured once a week during the rearing period of 6 wk. Mean ± SD, n = 5.
± ± ± ± ± ± 34.1 34.2 33.8 32.1 30.7 26.0 0.3 2.3ab 0.6ab 2.8ab 0.6b 2.1ab ± ± ± ± ± ± 34.4 34.9 33.9 33.2 28.7 29.1 1.0 1.4abc 0.4b 1.3ab 2.1ab 0.2c ± ± ± ± ± ± 34.7 34.2 32.1 32.2 30.5 27.8 1.0 2.5abc 1.2abc 1.4b 0.5ab 1.1c ± ± ± ± ± ± 36.5 36.5 34.4 33.2 32.3 30.0 0.7 1.7 0.3 0.7 1.0 0.5 ± ± ± ± ± ± 39.4 39.5 39.1 39.9 39.4 38.7 3 16 30 52 130 172 ± ± ± ± ± ± 71 166 362 617 1,301 1,660 3 10 15 22 30 37
1
1.3 1.6ab 1.7ab 2.1ab 1.7b 0.5a
36.5 34.1 31.9 29.8 28.6 26.7
± ± ± ± ± ±
a
Wing
a
Breast
a
Crop
ac
Neck
ac
Skull Cheek Weight Day
Table 1. The weight (g) and absolute temperatures (°C) on certain parts of the chicken body surface as seen by the side view1
2495
(Willem Spoormans N.V., B-2370 Arendonk, Belgium). Female broiler breeders were about 45 wk old. In the hatchery the chicks were vaccinated against Newcastle disease (ND Hitchner G149, Antec International Ltd., Sudbury, UK). The birds were treated at arrival against infectious bronchitis (Nobilis, IB H120, Intervet International, Boxmeer, the Netherlands) followed by a booster vaccination (Nobilis, ND Clone 30, Intervet International) at d 15 against Newcastle disease. Measurements were performed in a compartment with 2,900 birds kept on chopped straw (stocking density of 16 birds per m2). A conventional lighting schedule of 23 h of light and 1 h of darkness was used. Mean air temperature in the room temperature decreased from 29 to 23°C during the 6 wk of growth. Water was freely available to all birds. Five individual broiler chickens were randomly chosen for measurement and analyzed once a week during the rearing period of 42 d. The compartment was equipped with 4 weighing platforms connected to a weighing computer (747 version A1, Fancom B.V., Panningen, the Netherlands) for measuring the average weight of the flock birds every 24 h. Feed consumption was recorded daily. The compartment was equipped with an automatic feeding system (Minimax, Roxell N.V., Maldegem, Belgium). The testing facility was situated in a broiler house of the Agricultural Research CentreGhent in Belgium.
a
Cloaca
BROILER SURFACE TEMPERATURE DISTRIBUTION
Diets The broilers were given ad libitum commercial starter feed followed by a grower feed. A starter diet with 211 g/kg of CP and 2,960 kcal of AMEn/kg was given until 10 d of age. From d 11 until d 42, a grower diet with 209 g/kg of CP and 3,060 kcal of AMEn/kg was offered.
Measurements Air temperature (Ta) was measured in the ridge and at 2 positions near the side walls (about 1 m above the floor) by means of thermocouples (Techmark Inc., Lansing, MI; 0.5°C accuracy). The mean air temperature of the 3 sensors was used for calculating mean Ta. Because the study is more focused on surface temperatures and is not aimed to calculate exact heat losses, air humidity was not measured. Air velocity (v) was measured with a unidirectional air velocity sensor (TSI 8455, accuracy = 2% of reading). Air velocity was measured at 0.3 m above the litter, and the sensor was positioned to measure the airflow along the longitudinal axis of the house. Every measuring day, measurements were made at 5 different positions in the first half of the house, and the average value was calculated once for each week during 6 wk. The surface temperatures of the broilers (Tc) were as determined based on images of an infrared camera (AGEMA Thermovision 570, 0.1°C nominal sensitiv-
2496
Cangar et al.
Table 2. The weight (g) and absolute temperatures (°C) on certain parts of the chicken body surface as seen by the top view1 Day 3 10 15 22 30 37
Comb 37.0 37.0 36.1 36.5 34.7 31.4
± ± ± ± ± ±
Skull a
1.0 1.6ab 1.3ab 1.5ab 2.1ab 2.4b
36.2 35.7 33.4 35.9 36.1 27.0
± ± ± ± ± ±
Neck a
1.1 2.6ab 1.6ab 0.9ab 1.6ab 1.6b
33.5 33.0 30.2 31.3 31.2 25.4
± ± ± ± ± ±
Shoulder a
1.0 2.0ab 0.5b 1.2ab 2.5ab 1.0a
34.5 36.4 33.9 34.8 31.4 24.8
± ± ± ± ± ±
a
1.5 1.4ab 1.8ab 2.4ab 3.4ab 0.6b
Back 35.3 36.3 34.1 35.8 32.0 26.1
± ± ± ± ± ±
Sternum a
1.2 1.4ab 2.0ab 3.0ab 1.6b 2.2a
34.1 34.7 31.8 32.1 29.2 23.8
± ± ± ± ± ±
a
0.8 2.8ab 1.2b 1.9ab 0.7a 0.6ab
Upper wing 34.5 37.4 35.2 36.4 33.6 24.6
± ± ± ± ± ±
a
1.7 2.1ab 3.2ab 3.0ab 4.1ab 0.5b
Wing 33.9 33.2 29.3 32.0 30.1 24.9
± ± ± ± ± ±
0.8a 2.0ab 1.0b 1.0ab 1.0ab 1.0a
a–c
Means within a column with no common superscript differ significantly (P < 0.05). The temperatures are measured once a week during the rearing period of 6 wk. Mean ± SD, n = 5.
1
ity, 7.5- to 13-μm infrared spectrum, 24° lens, thermal emissivity set to 0.95). Per bird, 3 images were taken (left side view, top view, and bottom view—see Figure 1). The birds were picked up and placed on a wooden plate, and the images were taken as fast as possible to reduce stress effects. The birds were handled by wearing latex gloves to avoid influences of heat and moisture of the hands on the temperature of the feathers. During the growing period, measurements of Tc, Te, and v were performed on d 3, 8, 16, 23, 30, 37, and 42. The values of the air temperature Ta and average weight of the birds were registered daily from the process controllers. For more information about the experimental setup, please refer to Aerts et al. (2003a,b). To measure the surface spatial temperature distribution, different body parts of the birds were labeled in the images. Temperatures in those parts were recorded weekly during the growth period of 42 d (See Figure 1).
Data Analysis The temperature data were analyzed and observations were categorized in 4 main subjects as follows: 1) Spatial gradients of absolute surface temperatures of broiler chickens measured once a week during 6 wk of growth period. Spatial gradient stands for the difference in temperatures on different areas of the surface of the bird. 2) Change of absolute surface temperatures and the spatial distribution as a function of age. 3) Spatial distribution of temperature differences measured once a week during 6 wk of growth period. Temperature difference (∆T) represents the difference in temperatures of the certain sur-
face body part and the environmental air temperature. 4) Change of differences between the surface and air temperature as a function of age. Inequalities between the means were established using Tukey’s honestly significant difference test. An analysis of covariance (ANCOVA) test was applied for testing the effects of 2 main factors, the age (in weeks), and the body part of the chicken, together with continuous variables air temperature and air velocity on ∆T for 3 different views. Calculations were performed using the SAS Statistics Software release 9.1.3 (SAS Institute Inc., Cary, NC) and Statistics Toolbox of Matlab Software (The Mathworks, Natick, MA).
RESULTS AND DISCUSSION In this study, the temperatures on 26 different points on the surface of 5 individual broiler chickens were measured and analyzed once a week during the rearing period of 42 d.
Spatial Gradient of Absolute Surface Temperatures of Broiler Chickens at Certain Age Large spatial gradients were observed on the 3-dimensional surface of the broiler chickens. The gradients ranged up to more than 10°C, depending on the body part and the age of the bird (see Tables 1, 2, and 3). The warmest areas of the bird were the cheek and the inner thigh and were always between 39 and 41°C due to the absence of isolating feathers. Also in the inner thigh, there is an absence of feather growth in this district band that run dorsally from the vent (Leeson and
Table 3. The weight (g) and absolute temperatures (°C) on certain parts of the chicken body surface as seen by the bottom view1 Day 3 10 15 22 30 37
Crop 34.8 35.9 35.2 35.9 33.8 24.9
a,b
± ± ± ± ± ±
Upper part of breast a
1.5 1.9ab 1.2ab 1.1ab 3.8ab 0.9a
36.1 38.2 37.7 38.8 39.1 37.0
± ± ± ± ± ±
0.6 2.0 0.5 0.3 1.2 1.1
Mid part of the breast 36.6 39.4 38.5 38.6 38.3 34.7
± ± ± ± ± ±
a
1.3 1.7b 0.8ab 1.2ab 1.8ab 2.2a
Abdomen 36.2 38.7 38.1 39.3 36.3 32.0
± ± ± ± ± ±
a
1.6 1.6ab 1.3ab 1.0b 2.5ab 2.5a
Cloaca 34.8 35.7 34.1 36.1 34.0 28.5
Means within a column with no common superscript differ significantly (P < 0.05). The temperatures are measured once a week during the rearing period of 6 wk. Mean ± SD, n = 5.
1
± ± ± ± ± ±
Upper wing a
1.7 3.4ab 1.7ab 2.2ab 3.0ab 3.8b
34.5 36.5 34.2 35.7 31.5 27.4
± ± ± ± ± ±
a
1.2 1.6ab 0.5ab 2.5ab 1.5b 5.3ab
Inner thigh 38.0 39.3 40.0 40.7 40.6 37.3
± ± ± ± ± ±
0.6a 1.5ab 1.5b 1.1ab 1.4ab 5.4ab
2497
BROILER SURFACE TEMPERATURE DISTRIBUTION
contributed to this phenomenon of feather increase. All absolute surface temperatures as a function of age can be seen in Tables 1, 2, and 3.
Spatial Distribution of Temperature Differences at Certain Ages
Figure 2. Air temperatures (Ta, °C) and air velocity (m/s) during the rearing period of 6 wk. The difference between the surface temperature and the air temperature [∆T (Tc − Ta)] as the driving force in heat loss for different views can be found in Figure 3.
Walsh, 2004). Due to absence of feather growth in these areas, the heat flux was larger to the air. The coldest areas were the neck, wings, and sternum. This is probably due to the strong isolating properties of the feathers on these areas. The least temperature on these areas decreased from 33 to 24°C as the birds grew.
Change of Absolute Surface Temperatures and the Spatial Gradient as a Function of Age As the birds grew, the temperature gradient on the surface of the broilers increased most likely due to less uniform feather cover. At wk 1, the gradient was (maximum – minimum) 6°C, but on wk 6 it reached 15°C on the whole body surface. This increase was observed in all views and occurred almost linearly (R2 = 0.94). When only the absolute surface temperatures were considered, the overall trend was an average (of all chickens and body parts) decrease with time from approximately 36 to 28°C. Richards (1970) suggested that the decrease in surface temperatures could be the result of increasing number and quality of the feathers in different places that act like an insulation layer. Decreasing of inside temperature (as seen in Figure 2) probably
Temperature differences between the body surface and air temperature (DT = Tc - Ta ) were also calculated and analyzed. Different body parts had different ∆T. In the top view the comb had the greatest temperature gradient, whereas the wing had the least. It is mentioned in the literature that the head and neck region and perhaps some around the abdomen are poorly feathered; hence, insulation is quite poor in those areas (Leeson and Walsh, 2004). The ∆T was greatest in the top wing and least in the inner thigh in the bottom view. Cheek had the greatest ∆T. Wing on the other hand had the least ∆T.
Change of Differences Between the Surface and Air Temperature as a Function of Age A 2-way ANCOVA test was applied for testing the effects of 2 main factors, the age (in weeks) and the body part of the chicken, together with the continuous factors of air temperature and air velocity on the mean of the ∆T for 3 different views. Results can be seen in Table 4. Additionally, Ta (°C) and the air velocity (m/s) during the rearing period of 6 wk can be found in Figure 2. The inside air temperature was controlled by a controller to a desired trajectory dependent on age of birds. Ventilation system helped to maintain the inside temperature to these preset values. Therefore the increase in ventilation and consequently air velocity during the last week of the experiment was due to exceptionally warm outside climate (June 2002). The main effect age of the chickens revealed a significant result on the temperature difference for all views because the P-values were all less than 0.0001 (confidence intervals were set to 95%). Body part, as the second main effect, was significant for side view but insignificant for the top and bottom views (P = 0.0049, 0.7125, and 0.6177, respectively). There was a
Table 4. Results of analysis of covariance test1 Item Side view Age Body part Age × body part Top view Age Body part Bottom view Age Body part Age × body part 1
Degrees of freedom
Type III sum of squares
Mean square
F-value
P>F
1 6 6
859.4 96.1 104.9
859.4 9.6 10.5
232.5 2.6 2.8