micromachines Article
Quantification of Vortex Generation Due to Non-Equilibrium Electrokinetics at the Micro/Nanochannel Interface: Spectral Analysis Seung Jun Lee 1 , Tae-Joon Jeon 2 , Sun Min Kim 3, * and Daejoong Kim 1, * 1 2 3
*
Department of Mechanical Engineering, Sogang University, Seoul 04107, Korea;
[email protected] Department of Biological Engineering, Inha University, Incheon 22212, Korea;
[email protected] Department of Mechanical Engineering, Inha University, Incheon 22212, Korea Correspondences:
[email protected] (S.M.K.);
[email protected] (D.K.); Tel.: +82-32-860-7328 (S.M.K.); +82-2-705-8644(D.K.); Fax: +82-32-867-7328 (S.M.K.); +82-2-712-0799 (D.K.)
Academic Editor: Joost Lötters Received: 3 June 2016; Accepted: 23 June 2016; Published: 27 June 2016
Abstract: We report on our investigation of a low Reynolds number non-equilibrium electrokinetic flow in a micro/nanochannel platform. Non-equilibrium electrokinetic phenomena include so-called concentration polarization in a moderate electric field and vortex formation in a high electric field. We conducted a spectral analysis of non-equilibrium electrokinetic vortices at a micro/nanochannel interface. We found that periodic vortices are formed while the frequency varies with the applied voltages and solution concentrations. At a frequency as high as 60 Hz, vortex generation was obtained with the strongest electric field and the lowest concentration. The power spectra show increasing frequency with increasing voltage or decreasing concentration. We expect that our spectral analysis results will be useful for micromixer developers in the micromachine research field. Keywords: Vortex generation; spectral analysis; concentration polarization; micro/nanochannel; micromixer; electrokinetics
1. Introduction With the improvement of micromachining technology over the past few years, the integration of nanoscale features has produced versatile microfluidic devices for various applications, such as sample preconcentration, biomolecule and DNA separation, and efficient filtration [1–13]. Recently, the ionic depletion-enrichment phenomenon in a micro-nanofluidic chip has attracted attention [2,5–7,9,10,14–16]. Researchers have reported that nanochannels (or nanopores) having nanometer dimensions exhibit unique ion perm-selectivity at low ionic strengths. These phenomena can be explained by an electric double layer overlap, since the electric double layer thickness is comparable to the nanochannel dimension [10,12,17–20]. In such a case, only selective ions can pass through the nanochannel. This ion selectivity results in so-called concentration polarization (CP) [5–7,14,21]. Non-equilibrium electrokinetic phenomena include CP and a nonlinear current–voltage relation across nanoporous membranes [2,6,10,14,16]. Concentration polarization refers to the creation of separate regions of enriched and depleted ion concentrations, respectively, upon the application of an electric field across micro/nanochannel interfaces. An interesting behavior that accompanies this concentration polarization is that local electrokinetic responses can be greatly amplified, especially in the ion depletion zone. As the CP zone widens in the depletion zone, a so-called depletion shock can occur [11,20,22–25]. This is possible when ions with low mobility travel in the same direction as the bulk flow toward the reservoir region, or when ions with high ion mobility move away from
Micromachines 2016, 7, 109; doi:10.3390/mi7070109
www.mdpi.com/journal/micromachines
Micromachines 2016, 7, 109
2 of 8
the depletion region. Applied voltages can be coupled with heterogeneous electric properties—in particular, gradients of ionic conductivity—to generate electric body forces in the bulk liquid. The depletion shocks result in a steep change in the concentration over a very short distance. These large concentration gradients in the background electrolyte create high electric field gradients. These strong electric field gradients at the ion depletion zone result in instability and consequently form strong vortices, which are useful in micromixing. Typical fluid flows in a microchannel have low Reynolds numbers since inertial forces were strongly damped by viscous forces [26,27]. Micromixing is, thus, one of the difficult problems in micromachine technology. We believe that non-equilibrium electrokinetic vortices can be efficiently utilized in micromixers. There have been several experimental studies related to vortex generation induced by non-equilibrium electrokinetics in micro/nano fluidic mixing systems. Pu et al. first reported the visualization of CP near micro/nanochannel interfaces and showed a qualitative model of CP [19]. Han et al. first visualized strong vortex structures generated by the aforementioned mechanism [5,6,14,21]. Santiago et al. presented theoretical and experimental approaches to explain CP and vortex generation [10,11,26]. Kim et al. proposed a U-shaped microfluidic device utilizing vortices near micro/nanochannel interfaces to enable mixing [4]. They demonstrated the application of this type of mixer as an efficient micromixing technique. Song et al. described a quantitative study on a passive polydimethylsiloxane (PDMS) microfluidic mixer using a vortex index [28]. Lee and Kim achieved millisecond-order rapid mixing in their microfluidic device using vortices induced by non-equilibrium electrokinetics [9]. They also conducted a parametric study of active microfluidic mixing. Their results show that the mixing performance is greater with a higher applied voltage and a lower ion concentration. The mixing characteristics were quantified in terms of a mixing index and mixing time. Rubinstein et al. suggested similar non-equilibrium electrokinetic flow on the surface of perm-selective membranes [22]. We present spectral analysis results for non-equilibrium electrokinetic flows at micro/nanochannel interfaces. One related study is Posner et al. [26] (although the mechanism of vortex generation is different). They reported temporal power spectra with time-delay phase maps of the vortices in a T-shaped single microchannel, and analyzed the low Reynolds number flow with an electric Rayleigh number. In our spectral analysis at a micro/nanochannel interface, we measured the frequency under various conditions of electric fields and solution concentrations. The electric field affects the electric body forces inside a microchannel. The concentration of a working solution is related to the dimensions of an electric double layer. We expect that our results can contribute to an understanding of unstable electrokinetic flows and active microfluidic mixing. 2. Experimental The non-equilibrium electrokinetic microfluidic device considered in this study is comprised of double U-shaped microchannels and a set of nanochannels across the two sections of this microchannel, as shown in Figure 1. The microchannel has a single stream and there is short-circuited flow through nanochannels. The amount of fluid flow is expected to be negligible through the nanochannels because of high flow resistance. The purpose of these nanochannels is to create CP or vortex generation around the micro/nanochannel interface. We fabricated this device using a standard microelectromechanical systems (MEMS) process. We patterned the microchannels and nanochannels on a silicon substrate with photolithography, and etched these channels using a two-step reactive ion etching (RIE) process. For electrical insulation, we deposited SiO2 onto the substrate using a thermal oxidation process. Finally, we bonded a glass wafer to this patterned silicon substrate for sealing and visualization purposes. Mao and Han studied the temperatures of bonding required to maintain nanochannels while avoiding nanochannel collapse [29].
NY, USA) with a 20×, NA = 0.4 objective lens in a dark room. A charge-coupled device (CCD) camera (Coolsnap, Photometrics, Tucson, AZ, USA) connected to the microscope was used to take digital images of mixing patterns and transfer the visualization data to a personal computer (PC). We used a commercial power supply (IT 6834, Itech, Nanjing, China) to deliver electrical power to the microfluidic device through platinum wires submerged in the reservoirs. Micromachines 2016, 7, 109 3 of 8
Figure 1. Schematic of the micro/nano channel device and the probing point for spectral analysis. Figure 1. Schematic of the micro/nano channel device and the probing point for spectral analysis. The The microchannel is 15 µm deep, 150 µm wide, and 1.5 cm long. The nanochannel is 10 µm wide and microchannel is 15 µm deep, 150 µm wide, and 1.5 cm long. The nanochannel is 10 µm wide and 50 50 nm deep. Inset: microscopic image of the fabricated microchannel and nanochannel. nm deep. Inset: microscopic image of the fabricated microchannel and nanochannel.
The 15experiments, µm deep, 150we µmcompletely wide, and has an the overall length of approximately 1.5 cm. In themicrochannel first step of is the filled microchannels with KCl solution The distance between two microchannel sections, across which the set of eight nanochannels is located, after the initial flushing steps with deionized water. Then, we applied DC electric potentials across is 50 µm. This distance, coincidesthe with the nanochannel length. All ofBy theusing nanochannels 50 nm the microfluidic device thus, and observed micro/nanochannel interfaces. the CCDare camera, deep, 10 µm 10,000 wide, and have 10 µm(the spacing. microfluidic device four reservoirs at the end of we recorded frame images limit The of our current setup in has a single experiment) of vortex two parallel microchannels (see Figure 1). Direct current (DC) electrical potentials were applied through formation in 20 s at a frame rate of 500 frames/s. In our previous study, we calculated the submerged platinum wiretime electrodes in the electrolyte solutions the reservoirs. Wevortex prepared various millisecond-order mixing for a similar micro-mixer design at based on the same generation concentrations of potassium chloride (KCl) solution as the electrolyte solution and a small quantity mechanisms [9]. The frame rate of 500 frames/s was adequate for the time scale of the flow of Rhodamine (~0.3 µM)statistics, that was we contained in the an electrolyte solution. to observe phenomena. ForB sufficient repeated recording eight timesWe forwere bothable experimental non-equilibrium vortexelectric flow patterns micro/nanochannel devices using inverted epifluorescent conditions: the applied field andinthe concentration of the KCl solution. microscopy (IX-51, Olympus, New York, NY, USA) with a 20ˆ, NA = 0.4 objective lens in a dark room. charge-coupled device (CCD) camera (Coolsnap, Photometrics, Tucson, AZ, USA) connected to the 3.AResults and Discussion microscope was used to take digital images of mixing patterns and transfer the visualization data to Figure 2 shows the visualized images of non-equilibrium electrokinetic vortices in the a personal computer (PC). We used a commercial power supply (IT 6834, Itech, Nanjing, China) to microfluidic device under applied electric fields. We obtained the time sequence of the fluorescent deliver electrical power to the microfluidic device through platinum wires submerged in the reservoirs. intensity field for all the experimental conditions. We normalized the digitalized intensity values in In the first step of the experiments, we completely filled the microchannels with KCl solution each pixel from 0 to 1 as follows: after the initial flushing steps with deionized water. Then, we applied DC electric potentials across the microfluidic device and observed the micro/nanochannel interfaces. By using the CCD camera, we recorded 10,000 frame images (the limit of our current setup in a single experiment) of vortex formation in 20 s at a frame rate of 500 frames/s. In our previous study, we calculated the millisecond-order mixing time for a similar micro-mixer design based on the same vortex generation mechanisms [9]. The frame rate of 500 frames/s was adequate for the time scale of the flow phenomena. For sufficient statistics, we repeated the recording eight times for both experimental conditions: the applied electric field and the concentration of the KCl solution.
Micromachines 2016, 7, 109
4 of 8
3. Results and Discussion Figure 2 shows the visualized images of non-equilibrium electrokinetic vortices in the microfluidic Micromachines 2016, 7, 109 4 of 8 device under applied electric fields. We obtained the time sequence of the fluorescent intensity field for all the experimental conditions. We normalized the digitalized intensity values in each pixel from 0 I − I min to 1 as follows: I norm = ˇˇ I ´ Imin ˇˇ (1) Inorm “ ˇˇ I ma x − I min ˇˇ (1) Imax ´ Imin where IInorm isisthe where thenormalized normalizedvalue valuein ineach eachpixel; pixel;IIisisthe themeasured measuredfluorescent fluorescent intensity intensity in in each each pixel; pixel; norm and I max and Imin are the bright-field and dark-field intensities, respectively. First, we subtracted the and Imax and Imin are the bright-field and dark-field intensities, respectively. First, we subtracted background noisenoise fromfrom the the images and and we set areaarea as zero intensity withwith Imin. I We. the background images we asetnon-dye a non-dye as zero intensity min subsequently applied Equation (1) to our focused area for further analysis. Figure 2 shows three We subsequently applied Equation (1) to our focused area for further analysis. Figure 2 shows three images taken taken at at different different time time frames frames under under the the same same experimental experimental conditions. conditions. Vortices are found found at at images Vortices are the micro/nanochannel micro/nanochannelinterface interface upon the application of an voltage electricofvoltage of concentration 120 V. The the upon the application of an electric 120 V. The concentration of the working solution (KCl) is 0.5 mM. The Reynolds number inside the microfluidic of the working solution (KCl) is 0.5 mM. The Reynolds number inside the microfluidic channel channel is approximately 0.046, which was calculated using the hydraulic diameter and the flow is approximately 0.046, which was calculated using the hydraulic diameter and the flow rate. rate. All experiments experiments were were performed performed with with this this fixed fixed Reynolds Reynolds number number to to analyze analyze only only the the electrokinetic electrokinetic All effects on on the the vortex vortex formation formation in in this this device. device. effects
Figure Figure 2. 2. Images Images of of vortex vortex generation generation near near the the micro/nanochannel micro/nanochannel interface.
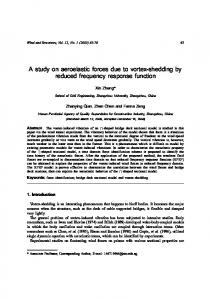
We selected selectedthe theregion region of interest in microchannel the microchannel the probing point for our analysis spectral We of interest in the as theas probing point for our spectral analysis (see Figure 1). This region is located near the micro/nanochannel interface along the center (see Figure 1). This region is located near the micro/nanochannel interface along the center line of line of the microchannel. The probing point corresponds to a two-by-two square matrix of the the microchannel. The probing point corresponds to a two-by-two square matrix of the normalized normalized intensities. fluorescent We intensities. averaged these four intensity values to obtain a single fluorescent averagedWe these four intensity values to obtain a single representative representative value at each time frame. This representative fluorescent intensity at this probing point value at each time frame. This representative fluorescent intensity at this probing point fluctuates fluctuates significantly when vortices were formed during our experiments. We conducted the significantly when vortices were formed during our experiments. We conducted the spectral analysis spectral on the sequence of the representative fluorescent based onanalysis the timebased sequence of time the representative fluorescent intensity value. intensity value. In our spectral analysis, we used about 80,000 frames of vortex images images around around the the In our spectral analysis, we used about 80,000 frames of vortex micro/nanochannel interface. Figure 3 shows one example spectrum exhibiting a single peak near 50 Hz. micro/nanochannel interface. Figure 3 shows one example spectrum exhibiting a single peak This means periodic were formed around Hz when we applied V with 0.1 mM near 50 Hz.that This meansvortices that periodic vortices were45 formed around 45 Hz 120 when we applied KCl solution. We performed the same type of spectral analysis for other experimental conditions. Figures 4 and 5 show the power spectra under various voltage and concentration conditions. The frequency ranged from 29 to 60 Hz in our experiments with a voltage range of 80 to 230 V and a concentration of 0.1 to 50 mM. We established the periodic behavior of non-equilibrium electrokinetic vortices, which has not previously been reported in the literature. The maximum vortex frequency is 60 Hz at 230 V and 0.1 mM. The minimum vortex frequency is 29 Hz at 80 V and 50 mM.
Figure 4 shows the effect of different applied voltages on the frequency of vortex generation. A higher electric potential results in a higher vortex formation frequency in a system with a fixed KCl concentration. This indicates a stronger vortex formation in a stronger electric field. Kim et al. reported the relation between applied voltage and vortex formation by using a similar microfluidic Micromachines 2016, 7, 109 5 of 8 mixer [4]. A stronger electric field generates a stronger electroosmotic flow inside the microfluidic chip, and the resulting electric body force enhances the collapsing of the CP effect. Upon the collapse concentration polarization effect, abrupt ionic through is generated 120ofVthewith 0.1 mM KCl solution. Wean performed theflux same typethe of nanochannels spectral analysis for other and it leads conditions. to unstable microflows near the micro/nanochannel interface. experimental
Micromachines 2016, 7, 109
5 of 8
Figure 4 shows the effect of different applied voltages on the frequency of vortex generation. A higher electric potential results in a higher vortex formation frequency in a system with a fixed KCl concentration. This indicates a stronger vortex formation in a stronger electric field. Kim et al. reported the relation between applied voltage and vortex formation by using a similar microfluidic mixer [4]. A stronger electric field generates a stronger electroosmotic flow inside the microfluidic chip, and the resulting electric body force enhances the collapsing of the CP effect. Upon the collapse of the concentration polarization effect, an abrupt ionic flux through the nanochannels is generated and it leads to unstable microflows near the micro/nanochannel interface. Figure powerspectrum. spectrum. Figure3.3.Example Example of the power
Figures 4 and 5 show the power spectra under various voltage and concentration conditions. The frequency ranged from 29 to 60 Hz in our experiments with a voltage range of 80 to 230 V and a concentration of 0.1 to 50 mM. We established the periodic behavior of non-equilibrium electrokinetic vortices, which has not previously been reported in the literature. The maximum vortex frequency is 60 Hz at 230 V and 0.1 mM. The minimum vortex frequency is 29 Hz at 80 V and 50 mM. Figure 4 shows the effect of different applied voltages on the frequency of vortex generation. A higher electric potential results in a higher vortex formation frequency in a system with a fixed KCl concentration. This indicates a stronger vortex formation in a stronger electric field. Kim et al. reported the relation between applied voltage and vortex formation by using a similar microfluidic mixer [4]. A stronger electric field generates a stronger electroosmotic flow inside the microfluidic chip, and the resulting electric body force enhances the collapsing of the CP effect. Upon the collapse of the concentration polarization effect, an abrupt ionic flux through the nanochannels is generated and it leads to unstable microflows near the micro/nanochannel interface. Figure 3. Example of the power spectrum.
Figure 4. Spectral analysis results with different applied voltages.
Figure 4. Spectral analysis results with different applied voltages. Figure 4. Spectral analysis results with different applied voltages.
Micromachines 2016, 7, 109
6 of 8
Micromachines 2016, 7, 109
6 of 8
Figure 5. 5. Spectral Spectral analysis analysis results results with with different different solution solution concentrations. concentrations. Figure
Figure 5 shows the relation between the concentration of the solution and the vortex formation Figure 5 shows the relation between the concentration of the solution and the vortex formation frequency. A higher concentration of the solution decreases the size of the electric double layer on frequency. A higher concentration of the solution decreases the size of the electric double layer on the nanochannels. This decrease lowers the ion perm-selectivity of the nanochannel (see Introduction the nanochannels. This decrease lowers the ion perm-selectivity of the nanochannel (see Introduction for a detailed explanation). The lowered ion selectivity consequently mitigates the CP effect, thereby for a detailed explanation). The lowered ion selectivity consequently mitigates the CP effect, thereby weakening vortex formation. The decreased size of the electric double layer is closely related to the weakening vortex formation. The decreased size of the electric double layer is closely related to the so-called overlimiting current, which is an important factor in vortex formation. The thickness of an so-called overlimiting current, which is an important factor in vortex formation. The thickness of an electric double layer depends on the corresponding electrolyte solution: the thicker the electrical electric double layer depends on the corresponding electrolyte solution: the thicker the electrical double double layer (EDL), the better the ion selectivity in a nanochannel, leading to faster and easier layer (EDL), the better the ion selectivity in a nanochannel, leading to faster and easier generation generation of a vortex. Moreover, the velocity of electroosmotic flow depends on electric fields in the of a vortex. Moreover, the velocity of electroosmotic flow depends on electric fields in the channels. channels. Therefore, higher voltage applied between electrodes with the same distance may increase Therefore, higher voltage applied between electrodes with the same distance may increase the velocity the velocity of electro-osmotic flow, thus affecting the frequency of vortex generation. Our of electro-osmotic flow, thus affecting the frequency of vortex generation. Our experimental spectral experimental spectral analysis observations are consistent with those reported in previous research analysis observations are consistent with those reported in previous research (e.g., [4,9]). (e.g., [4,9]). 4. Conclusions 4. Conclusions We performed spectral analysis with a micro/nanochannel platform based on non-equilibrium We performed spectral analysis with a micro/nanochannel platform based on non-equilibrium electrokinetics. The collapse of the concentration polarization effect results in strong vortices near electrokinetics. The collapse of the concentration polarization effect results in strong vortices near the the micro/nanochannel interface, albeit at a low Reynolds number. We calculated the temporal micro/nanochannel interface, albeit at a low Reynolds number. We calculated the temporal power power spectra of vortex generation and investigated the relation between frequency and two major spectra of vortex generation and investigated the relation between frequency and two major operation parameters: the applied voltage and the solution concentration. The spectra show the operation parameters: the applied voltage and the solution concentration. The spectra show the periodic nature of non-equilibrium electrokinetic vortices. Higher frequency vortices are formed either periodic nature of non-equilibrium electrokinetic vortices. Higher frequency vortices are formed with a stronger electric field or with a lower solution concentration. We believe that our results relating either with a stronger electric field or with a lower solution concentration. We believe that our results to the frequency of non-equilibrium electrokinetic vortices can be useful in future micromixer research relating to the frequency of non-equilibrium electrokinetic vortices can be useful in future micromixer and development. research and development. Acknowledgments: Acknowledgement:This Thiswork work was was supported supported by by aa National National Research Research Foundation Foundation of of Korea Korea (NRF) (NRF) grant grant funded funded by the Multi-phenomena CFD Engineering Research Center (Grant No. 2009-0083501) and by the Pioneer Research by the Multi-phenomena CFD Engineering Research Center (Grant No. 2009-0083501) and by the Pioneer Center Program (No. NRF-2012-0009578) through the National Research Foundation of Korea (NRF). This work Research Center Program NRF-2012-0009578) through the National Research Foundation of Korea (NRF). was also supported by Inha(No. University Research Grant. This work was also supported by Inha University Research Grant. Author Contributions: S.J.L. and D.K. conceived and designed the experiments. S.J.L. performed the experiments and S.J.L.,Contributions: S.M.K. and D.K.S.J.L. analyzed T.-J.J., and S.M.K. and D K.the gave technical support conceptual Author and the D.K.results. conceived designed experiments. S.J.L. and performed the advices, and S.J.L. wroteS.M.K. the paper. All authors theT.-J.J., results and implications and commented on and the experiments and S.J.L., and D.K. analyzeddiscussed the results. S.M.K. and D K. gave technical support manuscript at all stages. conceptual advices, and S.J.L. wrote the paper. All authors discussed the results and implications and commented on the manuscript at all stages.
Micromachines 2016, 7, 109
7 of 8
Conflicts of Interest: The authors declare no conflict of interest.
References 1. 2. 3. 4. 5. 6. 7. 8. 9. 10.
11. 12. 13.
14. 15. 16. 17. 18. 19. 20. 21. 22.
23.
Choi, E.; Kwon, K.; Lee, S.J.; Kim, D.; Park, J. Non-equilibrium electrokinetic micromixer with 3D nanochannel networks. Lab Chip 2015, 15, 1794–1798. [CrossRef] [PubMed] Choi, Y.S.; Kim, S.J. Electrokinetic flow-induced currents in silica nanofluidic channels. J. Colloid Interface Sci. 2009, 333, 672–678. [CrossRef] [PubMed] Haeberle, S.; Zengerle, R. Microfluidic platforms for lab-on-a-chip applications. Lab Chip 2007, 7, 1094–1110. [CrossRef] [PubMed] Kim, D.; Raj, A.; Zhu, L.; Masel, R.I.; Shannon, M.A. Non-equilibrium electrokinetic micro/nanofluidic mixer. Lab Chip 2008, 8, 625–628. [CrossRef] [PubMed] Kim, S.J.; Li, L.D.; Han, J. Amplified electrokinetic response by concentration polarization near nanofluidic channel. Langmuir 2009, 25, 7759–7765. [CrossRef] [PubMed] Kim, S.J.; Song, Y.-A.; Han, J. Nanofluidic concentration devices for biomolecules utilizing ion concentration polarization: Theory, fabrication, and applications. Chem. Soc. Rev. 2010, 39, 912–922. [CrossRef] [PubMed] Kim, S.J.; Wang, Y.-C.; Lee, J.H.; Jang, H.; Han, J. Concentration polarization and nonlinear electrokinetic flow near a nanofluidic channel. Phys. Rev. Lett. 2007, 99, 044501. [CrossRef] [PubMed] Kim, S.M.; Burns, M.A.; Hasselbrink, E.F. Electrokinetic protein preconcentration using a simple glass/poly (dimethylsiloxane) microfluidic chip. Anal. Chem. 2006, 78, 4779–4785. [CrossRef] [PubMed] Lee, S.J.; Kim, D. Millisecond-order rapid micromixing with non-equilibrium electrokinetic phenomena. Microfluid. Nanofluid. 2012, 12, 897–906. [CrossRef] Mani, A.; Zangle, T.A.; Santiago, J.G. On the propagation of concentration polarization from microchannel-nanochannel interfaces part I: Analytical model and characteristic analysis. Langmuir 2009, 25, 3898–3908. [CrossRef] [PubMed] Oddy, M.H.; Santiago, J.G.; Mikkelsen, J.C. Electrokinetic instability micromixing. Anal. Chem. 2001, 73, 5822–5832. [CrossRef] [PubMed] Wang, Y.; Zhe, J.; Dutta, P.; Chung, B.T. A microfluidic mixer utilizing electrokinetic relay switching and asymmetric flow geometries. J. Fluids Eng. Trans. ASME 2007, 129, 395–403. [CrossRef] Yan, D.; Yang, C.; Miao, J.; Lam, Y.; Huang, X. Enhancement of electrokinetically driven microfluidic t-mixer using frequency modulated electric field and channel geometry effects. Electrophoresis 2009, 30, 3144–3152. [CrossRef] [PubMed] Ko, S.H.; Song, Y.-A.; Kim, S.J.; Kim, M.; Han, J.; Kang, K.H. Nanofluidic preconcentration device in a straight microchannel using ion concentration polarization. Lab Chip 2012, 12, 4472–4482. [CrossRef] [PubMed] Kwak, R.; Kim, S.J.; Han, J. Continuous-flow biomolecule and cell concentrator by ion concentration polarization. Anal. Chem. 2011, 83, 7348–7355. [CrossRef] [PubMed] Plecis, A.; Nanteuil, C.; Haghiri-Gosnet, A.-M.; Chen, Y. Electropreconcentration with charge-selective nanochannels. Anal. Chem. 2008, 80, 9542–9550. [CrossRef] [PubMed] Dukhin, S.S. Nonequilibrium electric surface phenomena. Adv. Colloid Interface Sci. 1993, 44, 1–134. [CrossRef] Lee, C.Y.; Lee, G.B.; Fu, L.M.; Lee, K.H.; Yang, R.J. Electrokinetically driven active micro-mixers utilizing zeta potential variation induced by field effect. J. Micromech. Microeng. 2004, 14, 1390–1398. [CrossRef] Pu, Q.S.; Yun, J.S.; Temkin, H.; Liu, S.R. Ion-enrichment and ion-depletion effect of nanochannel structures. Nano Lett. 2004, 4, 1099–1103. [CrossRef] Zaltzman, B.; Rubinstein, I. Electro-osmotic slip and electroconvective instability. J. Fluid Mech. 2007, 579, 173–226. [CrossRef] Ko, S.H.; Kim, S.J.; Cheow, L.F.; Li, L.D.; Kang, K.H.; Han, J. Massively parallel concentration device for multiplexed immunoassays. Lab Chip 2011, 11, 1351–1358. [CrossRef] [PubMed] Rubinstein, S.M.; Manukyan, G.; Staicu, A.; Rubinstein, I.; Zaltzman, B.; Lammertink, R.G.H.; Mugele, F.; Wessling, M. Direct observation of a nonequilibrium electro-osmotic instability. Phys. Rev. Lett. 2008, 101, 236101. [CrossRef] [PubMed] Chiu, P.-H.; Chang, C.-C.; Yang, R.-J. Electrokinetic micromixing of charged and non-charged samples near nano-/microchannel junction. Microfluid. Nanofluid. 2013, 14, 839–844. [CrossRef]
Micromachines 2016, 7, 109
24. 25.
26. 27. 28. 29.
8 of 8
Yossifon, G.; Chang, H.-C. Selection of nonequilibrium overlimiting currents: Universal depletion layer formation dynamics and vortex instability. Phys. Rev. Lett. 2008, 101, 254501. [CrossRef] [PubMed] Lee, S.J.; Kwon, K.; Jeon, T.-J.; Kim, S.M.; Kim, D. Quantification of vortex generation due to non-equilibrium electrokinetics at the micro/nanochannel interface: Particle tracking velocimetry. Micromachines 2016. submitted. Posner, J.D.; Perez, C.L.; Santiago, J.G. Electric fields yield chaos in microflows. Proc. Natl. Acad. Sci. USA 2012, 109, 14353–14356. [CrossRef] [PubMed] Huang, K.-D.; Yang, R.-J. Formation of Ionic Depletion/Enrichment Zones in a Hybrid Micro-/Nano-channel. Microfluid. Nanofluid. 2008, 5, 631–638. [CrossRef] Song, S.; Singh, A.K. On-chip sample preconcentration for integrated microfluidic analysis. Anal. Bioanal. Chem. 2006, 384, 41–43. [CrossRef] [PubMed] Mao, P.; Han, J. Fabrication and characterization of 20 nm planar nanofluidic channels by glass-glass and glass-silicon bonding. Lab Chip 2005, 5, 837–844. [CrossRef] [PubMed] © 2016 by the authors; licensee MDPI, Basel, Switzerland. This article is an open access article distributed under the terms and conditions of the Creative Commons Attribution (CC-BY) license (http://creativecommons.org/licenses/by/4.0/).