Collaborative synchronous writing tools like. Google Docs and Etherpad let multiple users edit the same document and see each others edits in near real-time to ...
Quantifying Collaboration in Synchronous Document Editing Adrian Pace1 , Louis Baligand1 , Stian H˚aklev1 , Jennifer K. Olsen1 , Nore de Grez2 , Bram De Wever2 1´
Ecole Polytechnique F´ed´erale de Lausanne, Lausanne, Switzerland 2 Ghent University, Ghent, Belgium {adrian.pace, louis.baligand, stian.haklev, jennifer.olsen}@epfl.ch {nore.degrez, bram.dewever}@ugent.be
Abstract Collaborative synchronous writing tools like Google Docs and Etherpad let multiple users edit the same document and see each others edits in near real-time to simplify collaboration and avoid merge-conflicts. These tools are used extensively across many domains, including education, in both research and industry. The very nature of needing to constantly synchronize state between multiple users means that very granular editing data is automatically captured and stored. In theory, this data could provide important insights into the editing process, the contributions of the different users, how the text developed over time, and other questions relevant to researchers studying writing from different theoretical and methodological angles. However, this extreme granularity of the data (down to individual key presses), makes analysis very complex. Most of the research focused on automatic analysis of collaborative writing to date has focused on asynchronous writing, and looked at the ”diffs” between one editing session and the next. In this paper, we present a method and a tool to construct informative operations from text data, as well as preliminary metrics for measuring the collaborative writing process. Additionally, our method adds to previous work in that it can be used to assess the writing during the writing process rather than just being applied to an end product.
Introduction Collaborative writing is used extensively in many domains, such as families planning a trip, students collaborating on an essay, researchers writing grant proposals, and company staff coordinating their work. Studies have even shown that In: Mark Cieliebak, Don Tuggener and Fernando Benites (eds.): Proceedings of the 3rd Swiss Text Analytics Conference (SwissText 2018), Winterthur, Switzerland, June 2018
85% of university writing and company reports are collaboratively written (Ede and Lunsford, 1990). Within educational sciences, researchers have looked at the effect of collaborative writing on the quality of the written product, but also its effect on students learning. For example, Storch (2005) found evidence that the students who write collaboratively produce shorter but better documents in respect to accuracy, complexity and cogency. However, it is still an open question what collaborative writing processes may be effective and how to measure these processes, which we begin to explore in this paper. Collaborative writing generates very granular data, which has a great potential for further analysis, but is very difficult to collate and analyse. An example of a single database entry might be ”John inserted the letter ’a’ at position 380”, and during an editing session, thousands of these entries are generated. Different editors also store the data slightly differently. For example, ShareDB encodes data into a JSON object, for example: {"seq":20,"v":20,"op":[{"p":["text",19], "si":"d"}],"m":{"ts":1526393562757}, "d":"doc"} Whereas Etherpad compresses the data about an operation into a string like this: Z:z>1|2=m=b*0|1+1\$\n In this paper, we introduce a tool written in Python1 , that can parse the native database formats of several collaborative editing tools or libraries (currently we support Etherpad and ShareDB, but adding support for other formats would require minimal changes). Beyond parsing individual operations, we combine atomic operations into larger meaningful operations such that a sentence written consecutively, without any pause larger than n seconds, and without moving to another location on the page, goes from being a number of atomic events with time-stamps, to being a single operation, with a start- and an end-time. However, to properly assign user intention to atomic events, we need to make decisions about cut-off points – what is the n seconds threshold appropriate for deciding 1
https://github.com/chili-epfl/FROG-analytics
that a sentence was written in two writing events as opposed to in a single event? If I am writing a sentence, quickly backtrack to fix a spelling mistake, and continue writing, should this be modelled as a series of small editing operations, or a single operation whose fundamental goal it is to insert the sentence? To some extent, there can never be a perfect answer to this, since it will depend on the research questions of the researcher. If I am investigating editing behaviour at a very granular level, I might need access to all the spelling mistake corrections and backtracks. However, if I am interested in how people add and reorganize information, coordinate the development of a document and negotiate ideas, then I might prefer the writing events to be tracked at a larger grain-size. By analyzing authentic data from students collaboratively editing summaries, we have begun to explore whether we can detect natural breakpoints for different operations. We present an overview of the informed decisions we have made, which we believe would be appropriate and useful to the majority of researchers. Nevertheless, our code is designed in such a way that it is very easy to customize these settings as appropriate. Once we are able to detect these meaningful operations, we can replay through the entire history of a document, and for each meaningful operation, also annotate it with additional contextual information, so that instead of merely stating that ”John wrote the following sentence at 3PM”, we can add that ”John added a sentence to the end of a paragraph that had been authored by Chen Li”, or that ”John added a sentence, while Rachida was editing a paragraph two pages away”. From this contextual data, we can begin to determine metrics and indicators to summarize different phenomena of interest. In the final section, we introduce a set of early indicators that may be predictive of quality of collaboration or editing style, and we look at whether there is any correlation between the editing preferences of the students, and the metrics extracted from their collaboratively edited documents. The main contribution of our work is to create scores that can provide insight into the collaborative performance of the authors of a document. It is important to note that we do not know if a high score is good or not in terms of collaboration. However, our aim was to measure numerically the aspects that could help assess the collaboration in the writing process. We begin by introducing the data we used. We then describe the implementation of our approach. Finally, we define the metrics and look at how they behave on genuine data collected in an experiment.
Literature Review Technology for collaborative writing The two main technologies for collaborative writing are wikis, and text editors or word processors that allow for synchronous editing. Wikis do not support synchronous editing. Rather, each user locks a page for a given time, makes the edits he or she wishes, and commits this change, often with an edit summary, and a way for others to see a ”diff” of their changes. Given the high granularity of this data and the accessibility of this data through public sites such as Wikipedia, there is a large body of research covering collaborative work in wikis. However, because the edits are made asynchronously, the research in this area does not provide insights into the collaborative writing process of students who are working on a document at the same time. Tools that allow for synchronous editing are typically based on the theory of Operational Transforms (OT, Sun et al., 2004), which requires each edit to be decomposed down to a set of atomic operations, such as ”add the character M at position 480”, delete, move, change format (for rich text editors), etc. Since the synchronization of data will never be perfectly real-time, we might have two users, where user1 deletes character 480, and user2 inserts a new character at position 480 at the same time. If user2’s edit arrives at the server before user1’s, the result would be for user1’s operation to delete the newly inserted character, which would not correspond to user1’s intention. To prevent this, OT uses the concept of document versions. Each client keeps track of its latest document version, and reports this to the server with the operation. If the server receives two operations run against the same document version, it needs to transform them into a single operation that does not cause any conflict (in this case, delete the existing character at position 480, and then insert the new one, thus preserving both user1 and user2’s intentions). To manage the coordinated version numbers, the OT approach requires a central server and might run into problems with scaling above a certain number of people in the same document. Conflict-free Replicated Data Types (CRDTs) have been suggest as a solution. These are data types that contain enough context that the merge could happen on any of the clients, without requiring a central coordinating server (Andr´e et al., 2013). Currently, our approach is focused on OT data, as that is the most widely supported approach, but it could possibly be extended to support CRDT-systems in the future. Automatic analysis of collaborative writing One significant thread of research in the field of collaborative writing has been centered around providing feedback to teachers in order to assess the collaborative writing efforts and performances of their students. However, most
of the data has been collected at a very coarse granularity on long writing sequences. In the case of Wikipedia, researchers look at a few snapshots during the writing process and analyze the differences within an article at different points in time (Hu et al., 2016). With Google Docs, a number of papers have conducted fairly sophisticated analyses of collaborative writing based on automatically requesting the entire document snapshot each minute, or even more frequently, and extracting the user actions by calculating the ”diffs” between each snapshot (McNely et al., 2012). One example of this approach is WriteProc, based on a taxonomy of the collaborative writing process by Lowry et al. (2004), which traces semantic changes between different versions and changing concepts (Southavilay et al., 2009, 2010, 2013). However, these are also asynchronous documents where authors rarely wrote simultaneously (Wang et al., 2015; Sun et al., 2014) The only paper we found that looked directly at the individual operations was from Liu et al. (2017), which used regular expressions to classify the compressed Etherpad operations as either add, delete or move, and then quantified the number of different types of operations over different time windows. To summarize, existing research has been tied to a specific tool (Google Docs API, Etherpad database), and there has not been any attempt to create an abstract intermediate representation that would allow us to apply the same higher level analysis to data from multiple platforms. Also, most analyses are done by comparing ”diffs” from snapshots, rather than directly accessing the operations, which leads to data loss in situations of synchronous editing (e.g., impossible to tell who has edited what). Finally, the only attempt at looking at the actual operations did not try to extract semantics, but rather focused on quantifying the kinds of operations over time. In this paper, we work on a much finer granularity and look at individual edits instead of differences between the document in various points in time. Instead of focusing on the semantics, we created metrics based on the location in the document of the authors’ contributions and how balanced the writing styles of the users are.
The students were then randomly split into groups of three (n=17) and asked to provide a synthesis based on three provided sources within 90 minutes. The instructions asked for a synthesis text of 800-1000 words, which would summarize the most important information from the source texts in an integrated and well-organized manner. As a preparation for this task, each group member was provided with another source text which they needed to summarize in advance. The students were not allowed to talk during the session, but communicated with each other via chat and comments in Etherpad (the writing environment). Finally, students were asked to fill in an online questionnaire about their experience. In this paper, we use data from the collaborative writing process that occurred within the second stage of the experiment to conduct an unsupervised analysis of the traces from the collaborative writing sessions. Data Logs
Data Collection
Our data was collected from students working on a set of Etherpad documents. Etherpad2 is a highly customizable, open source, online editor that provides collaborative editing in real-time. It allows multiple users to edit the same text document through a web page interface. Etherpad operations are saved within a database as additions, deletions, or formatting of text (e.g., bolding text). Each change (also referred to as a writing event) is defined by its author, a timestamp, the document version (incremented at each writing event), and the modification, which consists of the position in the document at which the event takes place and what characters to delete or add. This allows a view of the document to be reconstructed over time rather than only keeping the final product. For our analysis, we are interested in how users collaborate in writing content, so we only focus on the addition and deletion actions taken within the document. Although our analysis focused on Etherpad data, our implementation works with any software that could log the same types of data streams as long as the writing events are stored in fine granularity. Depending on the format the database users to store the changes, a simple parsing function would have to be coded to fetch the document changes from the database into our system.
Context
Implementation
To acquire authentic synchronous writing data, we organized an experimental session with 50 Master students in educational sciences. The session consisted of three phases. The students first completed an online individual questionnaire that queried learners implicit writing beliefs measured with the Writing Beliefs Inventory (White and Bruning, 2005) and students’ individual writing strategies based on the Writing Style Questionnaire (Kieft et al., 2008).
Our system is an application written in Python that sends the metrics (discussed below) for a selection of documents defined by the user to a server. At regular configurable intervals (5 seconds by default), it looks for changes in tracked documents and send the updated metrics. At each time point, the application collects the relevant document changes that happened since the last update from 2
http://etherpad.org/
the editor database. For each of the updates, relevant information is stored around the position of the event, text added/deleted, author, and timestamp. The information collected at each stage is used to infer the writing operations that occurred and subsequently, the metrics on the writing process.
Writing Operations The data collected from Etherpad is very granular, and each data point taken separately does not have meaning, besides contributing to our ability to reconstruct the entire document at any point in time. To give more meaning to the writing process, we used the saved changes within the document to calculate meaningful operations that begin to correspond with actual behavioural and cognitive processes. The small changes that are saved within Etherpad (i.e., additions and deletions) can be grouped together when they occur continuously, to provide writing behaviors. If users stop for a coffee break or begin editing at another location in the document, a new operation is formed. If the author has taken a short break, but not begun a new operation by writing somewhere else in the document, he or she can go back to the piece of text that was being edited, and continue editing without starting a new operation. We classify the operations into four different types: • Write: An operation is classified as a Write if the author enters more characters than a set threshold. We consider this type of operation as representing drafting the bulk of the text. It occurs, for example, when authors begin writing an essay and are adding ideas. The Write operation contains mostly addition changes but may have some deletions, as they form part of the writing process. • Edit: An Edit is similar to a Write in that it can consist of both addition and deletion changes. However, an operation is classified as an Edit when the number of character changes falls below the threshold for a Write. Edits often occur when the authors review an essay and fix typos or change words. • Delete: If an operation consists of an author removing more than a certain number of characters (deletion change), then it is classified as a Delete. The idea of this type of operation is to observe when an author does not simply remove a word (this is considered as an Edit or as part of a Write), but when he or she removes a significant amount of characters, such as a whole sentence or paragraph. • Paste: If the writer adds more than several characters (addition change) in one single writing event (which are sampled every few milliseconds), then the operation is classified as a Paste. This is useful to differenti-
ate a Write from simply copying and pasting text into the document. In order for the operations to be relevant, we need to carefully select the parameters that distinguish them from each other (e.g., the threshold number of added characters to either classify an addition as a Write or as an Edit). To determine this threshold between Write and Edit, we plotted the distribution of the number of Write, Delete, Paste and Edit operations with respect to the threshold number of added characters to classify the operation as Edit. We selected a length of 15 characters because the distribution stays relatively constant from this point. The average number of characters in an English word is 5.1 (Bochkarev et al., 2012), which supports our decision as it roughly means that deleting or adding less than three words is an Edit. The application also groups the writing events into paragraphs, collections of writing events that are currently located on the same line. This gives more insight into the context in which an operation was written: Is this operation occurring in a paragraph written by a single author? Is it a significant change to the paragraph given the length of the paragraph? This context is further extended with various details such as its length compared to the document, whether its the first operation of the day, and whether there were other people writing in the document at the time.
Writing Metrics To begin to assess the collaborative writing process, we created eight different metrics that could be applied to the document at any point in time (Table 1). The metrics are derived from understanding the operation type that took place and the context that the operation is within. These metrics fall into three basic categories: time, operations, and integration. Except when noted, each of the metrics has a score between 0 and 1. The timing metrics are all related to when students were writing in the document. Within this category, the metrics include the count of day breaks (DB), the count of short breaks, and the amount of synchronicity in the document. The number of day breaks tracks whether the document was written across multiple days or in a single day. If there was more than eight hours between any two changes, the count of the day breaks is incremented. This metric allows us to have a rough estimate of duration for the editing process. The second timing metric is the number of short breaks (SB) that were taken. The number of short breaks is calculated by assessing the number of instances where there are no changes for at least 10 minutes (but less than 8 hours). The short breaks are important to measure, because they can be an indicator of different writing styles, where some people prefer to plan before writing and others do
Table 1: Metrics to assess collaborative writing. Time Metrics Day Breaks Number of days the document was written over Short Breaks Number of pauses for longer than 10 minutes Synchronicity Percentage of text that was written in a synchronous manner Operation Metrics Overall Operations Proportion each operation was used in the document User Operations Proportion that an author used an operation normalized by the total use of the operation Integration Metrics User Contribution Balance of contributions between authors Paragraph Integration Interleaved or blocked paragraphs by different authors Paragraph Contribution Balance of contributions within paragraphs between authors not. These different writing styles may impact the success of collaboration process depending upon the alignment of the writing styles between the members of the group. The final timing metric is the synchronicity (SYN) of the writing in the document. The synchronicity is measured taking the number of synchronously written characters normalized over the total number of characters written. # of synchronously typed characters # of characters A synchronous character is classified as synchronous if two or more users are writing within three minutes of each other. When all of the text was written in a synchronous manner, then the score is 1, and if there is no overlap between the writing times of the users, the score is 0. The synchronicity of authoring is an important measure of the collaborative writing dynamics, especially when the users work in an otherwise synchronous setting, because it may offer insights into the roles and dynamics of the group. The second categorization of the metrics involves the operation types that are present within the document. As mentioned above, to better understand how the users were writing their document, we rolled-up the basic additions and deletions stored by Etherpad into four types of operations: Delete, Write, Edit, and Paste. Depending upon the role of a user in a group or the stage of the writing that the group is currently engaged in, the relative frequency of the types of operations may change. The relative frequency
of these operations over time, for the whole group, or for individual users, helps us to understand the editing flow. The overall operations (OO) metric captures the division of different metrics across the entire document. For each type of operation, the proportion is calculated given the total number of operations in the document. # of char. classified as {delete, edit, paste, write} # of characters A score of 0 indicates that there are no operations of this type in the document while a score of 1 indicates that all of the operations are of this type. This metric may help us to better understand the writing style of the users. The second metric in the operations category is the user operations (UO), which reflects the distribution of the different operations across the users in the pad. This metric reflects how much the different users are balancing the different operations among themselves and, as with the overall operations metric, there is a separate number for each operation. 1 log(#authors)
X
proptype (i) log
i∈authors
1 proptype (i)
For example, if one user does all of the editing, then there would be a score of 0 for the editing. However, if there is an even distribution among the users, then there would be a score of 1. This metric may be beneficial in understanding the roles that the users take within their group. The third category of metrics involves the integration of writing within the document, including user contribution, paragraph integration, and within paragraph integration. The user contribution (UC) metric measures the balance of the writing contributions between users. The metric is close to 1 when the participation is equal between the users, and is close to 0 when a single author has done the majority of the writing. This metric is important to track in a collaborative setting because it can be indicative of social loafing within the group. 1 log(#authors)
X i∈authors
prop(i) log
1 prop(i)
The second integrative metric is the paragraph integration (PI) within the document. The paragraph integration measures how interleaved the paragraphs written by different users are. The measure will be 1 if the main author of each paragraph is alternating, or close to 0 if many blocks in a sequence have the same primary author (for example, one author mostly wrote the four first paragraphs, and the other author wrote the four next ones). This metric may be an indicator of the collaboration that is occurring within the group. When writing text, some group members will divide the labor and have each member write a different section of the paper in a more cooperative style. Other groups will
work in a more collaborative style with all group members contributing to each section. # of author alternations between Paragraphs # of Paragraphs − 1 The final metric, within paragraph integration, is a measure of the extent to which the users in a group contributed to each of the paragraphs equally (PC). It will be close to 0 if a paragraph was written by a single user, and 1 if all authors contributed equally to a paragraph. As with the previous metric, within paragraph integration can be used as a measure of the collaboration between the group members.
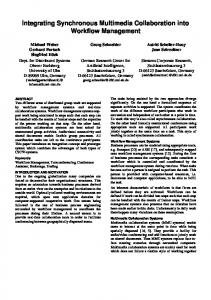
Figure 1: Evolution of the PI over the 90-minute assignment on all documents
�
1 log(#authors in p) X 1 propp (i) log propp (i) i∈authors in p X
p∈paragraphs
length(p) length(total)
To investigate if our eight metrics are measuring different aspects of the document, we checked the correlations between each of the metrics. We did not find any significant correlations between the metrics, indicating that they are all measuring separate aspects of the document writing process. Separately, each of our eight metrics can provide insights into the group writing process. However, the metrics do not need to be looked at in isolation. By analyzing several of the metrics together, we may be able to detect additional processes of the collaboration process that would not be evident from a single metric. Metrics Over Time Although all of our metrics can be applied to a finished writing product, one of the strengths of our approach is that the different metrics can be calculated in real-time, to both eventually adapt to students, and to track how the writing process changes as time progresses. In order to study the behavior and evolution of our metrics over time, we calculated the metrics of each pad at given intervals. We split the lifespan of the document, i.e. 90 minutes, in 32 linearly separated time-slices. For each time-slice, we display a box plot showing the spread of the different metrics across the seventeen groups. Below we present the analysis of three different metrics (paragraph integration, paragraph contribution, and synchronicity), and how they develop over time. The PI (Fig.1) measures the amount that the members of the group are interleaving their different paragraphs. In our data set, we can see that the score begins at 0, when no one has yet written. As the authors begin to add more text, we can see that the score rises to about 0.15 by the end of the first half of the session. In the second half of the session, the metric remains relatively constant, indicating that there is no additional integration of paragraphs between group members.
Figure 2: Evolution of the PC over the 90-minute assignment on all documents Similarly, the PC metric (Fig.2), which measures the sharing of operations within a paragraph, also shows a growth pattern over time. Like the PI metric, this metric begins at 0 and grows to about 0.15 by the end of the session. However, the pattern over time is very different. For the first half of the session, the PC metric remains relatively close to 0, indicating that users work on their own individual part of the document, without attempting to integrate their work. In the second half of the session, the score begins to grow at a more linear rate, indicating that there is much more sharing between paragraphs. Although the main author of the paragraphs may have stayed the same (as indicated by not much of a rise in the PI score), the group members were looking at each others work more, as indicated by the higher PC score.
Figure 3: Evolution of the synchronicity over the 90minute assignment on all documents Finally, we investigated how the synchronicity met-
ric changed over time (Fig.3). Because the groups were formed and were asked to produce their summary within a 90-minute timeframe, we would expect to see that the document was written very synchronously. From the data, this is what we find. At the beginning of the document when the group is just getting started, the score is close to 0. However, in Fig.3, we can see that it quickly moves up to around 0.4 within a few time-slices. For the remainder of the document, the scores remains between 0.6 and 0.8, which is an indicator of high synchronicity.
Discussion and Conclusion These results can give an overall idea of the behavior of the metrics and of their importance in gaining insight of the document writing process. As we can observe, the metrics evolve through time. The initial increase in the PI at the beginning of the document writing process indicates that authors begin by editing separate parts of the document, with very little intra- or inter-paragraph coordination. As the writing processes proceeds, the authors stop creating new paragraphs and begin editing the existing ones, which naturally leads to more collaboration and textual integration. This insight can help the supervisor of the authors in determining if each writer write their own block of text or whether they have contributed in every main aspects of the document. In addition, as time increases, the evolution of the PC shows that authors tend to write more inside of each others paragraph. It would seem they write their own block of text at the beginning and then start gradually collaborating by writing in each others contributions. The score still remains relatively low meaning that there still is a main author per paragraph and that the contributions from other authors stay small. Moreover, the Synchronous score evolution shows that the documents are written by at least two authors at the same time during the overall duration of the assignment except at the very beginning. The aim of our metrics is to provide real-time insights on the way authors contribute in writing an online document. They were designed to analyze whether the authors are collaborating between them and thus focus on the interaction between the writers. We are currently planning new experiments that will give us more detailed data about how collaborative writing processes manifest themselves in the data. We are also planning to analyze the quality of the written documents, as well as the knowledge post-test, to see if we can correlate the proposed quality metrics in this document, with actual differences in quality or learning gains. The tool we have developed can provide these metrics live during an editing session, and it will be integrated in our collaborative learning platform FROG3 , to provide 3
https://github.com/chili-epfl/FROG
live visualizations of the collaborative process in multiple groups for workshop organizers or teachers, and in the future we might consider adding user-facing visualizations or even prompts and adaptive interfaces to support group collaboration. Finally, the analyses described in this paper only concern themselves with behaviour and could be applied to any language. However, by adding semantic context to the data – for example using word2vec-like methods to measure semantic distance between two users’ contributions over time (is there convergence?) – we might be able to further understand the collaborative process.
References Andr´e, L., Martin, S., Oster, G., and Ignat, C.-L. (2013). Supporting adaptable granularity of changes for massive-scale collaborative editing. In Collaborative Computing: Networking, Applications and Worksharing (Collaboratecom), 2013 9th International Conference Conference on, pages 50–59. IEEE. Bochkarev, V. V., Shevlyakova, A. V., and Solovyev, V. D. (2012). Average word length dynamics as indicator of cultural changes in society. CoRR, abs/1208.6109. Ede, L. and Lunsford, A. (1990). Singular Texts/plural Authors: Perspectives on Collaborative Writing. Southern Illinois University Press. Hu, X., Ng, T.-D. J., Tian, L., and Lei, C.-U. (2016). Automating assessment of collaborative writing quality in multiple stages: The case of wiki. In Proceedings of the Sixth International Conference on Learning Analytics & Knowledge, LAK ’16, pages 518–519, New York, NY, USA. ACM. Kieft, M., Rijlaarsdam, G., and van den Bergh, H. (2008). An aptitude-treatment interaction approach to writing-to-learn. Learning and Instruction, 18(4):379 – 390. Liu, M., Pardo, A., and Liu, L. (2017). Using learning analytics to support engagement in collaborative writing. International Journal of Distance Education Technologies, pages 79–98. Lowry, P., Curtis, A., and Lowry, M. (2004). A taxonomy of collaborative writing to improve empirical research, writing practice, and tool development. Journal of Business Communication, pages 66–99. McNely, B. J., Gestwicki, P., Hill, J. H., Parli-Horne, P., and Johnson, E. (2012). Learning analytics for collaborative writing: A prototype and case study. In Proceedings of the 2Nd International Conference on Learning Analytics and Knowledge, LAK ’12, pages 222–225, New York, NY, USA. ACM. Southavilay, V., Yacef, K., and Calvo, R. (2009). Writeproc: A framework for exploring collaborative writing processes. In ADCS 2009: Proceedings of the Fourteenth Australasian Document Computing Symposium, 4 December 2009, pages 543– 548. Southavilay, V., Yacef, K., and Calvo, R. (2010). Process mining to support students’ collaborative writing. Educational Data Mining, pages 257–266.
Southavilay, V., Yacef, K., Reimann, P., and Calvo, R. (2013). Analysis of collaborative writing processes using revision maps and probabilistic topic models. In Proceedings of the Third International Conference on Learning Analytics and Knowledge, pages 38–47. ACM. Storch, N. (2005). Collaborative writing: Product, process, and students reflections. Journal of Second Language Writing, 14(3):153 – 173. Sun, D., Xia, S., Sun, C., and Chen, D. (2004). Operational transformation for collaborative word processing. In Proceedings of the 2004 ACM conference on Computer supported cooperative work, pages 437–446. ACM. Sun, Y., Lambert, D., Uchida, M., and Remy, N. (2014). Collaboration in the cloud at Google. In WebSci 2014 - Proceedings of the 2014 ACM Web Science Conference. Wang, D., Olson, J. S., Zhang, J., Nguyen, T., and Olson, G. M. (2015). Docuviz: Visualizing collaborative writing. In Proceedings of the 33rd Annual ACM Conference on Human Factors in Computing Systems, CHI ’15, pages 1865–1874, New York, NY, USA. ACM. White, M. J. and Bruning, R. (2005). Implicit writing beliefs and their relation to writing quality. Contemporary educational psychology, 30(2):166–189.