The current issue and full text archive of this journal is available at www.emeraldinsight.com/1741-0398.htm
Quantifying coordination work as a function of the task uncertainty and interdependence Alba N. Nun˜ez and Ronald E. Giachetti
Quantifying coordination work 361
Department of Industrial and Systems Engineering, Florida International University, Miami, Florida, USA, and
Giacomo Boria Facolta` di Ingegneria, Universita` di Bologna, Bologna, Italy Abstract Purpose – The purpose of this paper is to contribute to the understanding of coordination in business processes by quantifying how the coordination load is affected by changes in task structure and task characteristics. Design/methodology/approach – A model is presented that quantifies the amount of coordination work as a function of the task characteristics analyzability and variability and the task structure factor of interdependence. To test the model, a management simulation game is used with a full factorial design of experiments. Two replications are conducted for each treatment. Validated questionnaires and time studies are used to obtain the data. Findings – Analyses of the experimental results indicate that as task analyzability decreases and task interdependence increases then the coordination load increases. The increase in coordination load is greater for changes in task interdependence than for changes in task analyzability. Practical implications – The experimental results indicate the time savings from doing tasks in parallel versus sequential are less than what would expected due to the increased interdependence between tasks and the resulting requirements for coordination. These results can be used to understand the trade-offs of different process configurations, primarily how coordination load changes when a process is changed from sequential to parallel. Originality/value – This research deviates from previous research in that the coordination load difference is measured when going from a sequential process to a parallel process. Most previous studies have shown differences but not the magnitude of the difference. Moreover, most previous studies have been at the organization level, while this research focuses on the business process level. Keywords Integration, Business process re-engineering, Work design, Task analysis Paper type Research paper
1. Introduction The division of labor breaks up a task into subtasks, and assigns the subtasks to separate workers for dramatic improvements in productivity. Partitioning of work creates interdependencies between the subtasks, which must be managed by coordination. Coordination work is the amount of work a group of people completing a task must do that an individual doing the same task would not do (Malone, 1987). How the work is divided and assigned leads to different task structures, which have different coordination needs. Evidence for this has been established in several empirical research studies. Williams et al. (1995) observed that if a process is designed such that most tasks are done in parallel, then each individual task takes longer to complete because of the added effort needed by workers to capture input data from the
Journal of Enterprise Information Management Vol. 22 No. 3, 2009 pp. 361-376 q Emerald Group Publishing Limited 1741-0398 DOI 10.1108/17410390910949760
JEIM 22,3
362
parallel activities. Likewise, Krishnan et al. (1997) found that increased parallelism in product development leads to more iterations in the design process and thus longer length. These researchers have found that as parallelization increases then the amount of work increases. The additional work is the coordination work needed to manage the increased interdependence between tasks. The research in this paper is partly motivated by previous work regarding reengineering the patient flow in a healthcare clinic. The as-is process for treating patients was sequential. The total turn-around time for the process varied greatly in the clinic studied, but for almost 40 per cent of all patients it was more than two hours. Queueing analysis and simulation studies were conducted to evaluate several process redesign alternatives to reduce the turn-around time. The most promising redesign was called the Advanced Protocol. The Advanced Protocol redesign empowered the triage nurse to order some medications, treatments and laboratories prior to the physician’s examination. The effect of this redesign is many of the tasks that were previously done sequentially would be conducted in parallel. The simulation analysis predicted a time savings of a little over 30 minutes, which would bring the majority of patients under the 90-minute goal for turn-around time. However, a year after implementation, time studies showed a net time reduction of just over ten minutes; less than half of what was predicted. What we believe is missing from this, and many other process redesign analyses, is how the redesigned tasks and task structure impact the overall amount of work, including coordination. Modifications to the task and task structure changes the amount of coordination that must be done. In the healthcare example, doing tasks in parallel increased the amount of communication required to complete each individual task. The reason is that healthcare tasks are complex, a high variety of different patient types are seen in the Urgent Care Center, their treatment requires judgment, and the tasks are dependent to some extent on other tasks. Under these conditions, coordination work increased in the more parallel process defined by the Advanced Protocol. We postulate the difference between the estimated 30 minutes reduction and the actual ten minutes reduction is not due so much to errors or approximations in the analysis, but rather to not considering the increased amount of coordination work the staff would have to do in order to maintain desired performance outcomes. There has been some recognition of the problem, but nobody has measured the need for coordination nor determined how to relate it to task structure. Many studies that investigate interdependence and coordination focus on how they influence organizational design at a macro-level (Lawrence and Lorsch, 1967; Galbraith, 1977; Mintzberg, 1992). The studies are based on an information processing view of the organization (Galbraith, 1977) that argues the organization is structured so as to most efficiently and effectively process information. The link between task characteristics and coordination is well established (van de Ven et al., 1976; Galbraith, 1977; Mintzberg, 1992; Malone and Crowston, 1994). As pointed out by Levitt et al. (1999) the work by organizational theorist is at a macro-level analysis of coordination that focuses on organization structure. More recent research has investigated coordination in different contexts including project management (Kunz et al., 1998; Christensen et al., 1999), software engineering (Kraut and Streeter, 1995; Andres and Zmud, 2002), and product development (Krishnan et al., 1997; Sherman, 2004). In the area of process design, the work of Malone
and Crowston (1994) takes the approach of identifying dependency types and matching them to one or more coordination mechanisms. What seems to be lacking from much of the work on examining dependencies and coordination is the characteristics of the dependency. In this research, we are interested in quantifying the relationship between the task characteristics, task structure and coordination work. What this paper contributes to the knowledge of coordination is to provide a deeper analysis of coordination at the business-process level through an operationalization of what we term coordination load, and then linking coordination load to measurable factors of task structure and task characteristics. Specifically, we want to understand how the amount of work changes when the task structure changes from a sequential to a parallel task structure. What differs from most previous research is that the level of our analysis is the business process and not the organization. The measure of coordination load will aid business process designers in understanding how changes to the task characteristics and structure change the amount of work that must be done. To accomplish the research, we use a management simulation game so that we can manipulate the independent factors and control for other factors to isolate the phenomenon of interest. A management simulation game puts the participants in an artificial business scenario, and requires them to complete certain tasks. Using a management game to investigate relationships has been successfully performed by other researchers; see for example, successful study by Fussell et al. (1998). The paper is organized as follows. Section 2 reviews the literature on coordination and the task structure constructs investigated in the research. Section 3 presents the research model. Section 4 describes the management simulation, operationalization of the constructs, and experimental design of experiments. Section 5 presents the analysis of the experimental results. A discussion of the results, limitations of the study and conclusions are in Section 6. 2. Research model Coordination load is the effort a worker must expend in order to manage the interdependencies between tasks. In this model, we measure this effort as the amount of time spent on coordination activities. The total time spent on task i is: ti ¼ t ai þ tci
ð1Þ
Equation (1) distinguishes between the task-specific activity work (t ai ) and coordination work (t ci ). Activity work is the work directly required to complete the task. Coordination work is any work, done for the purposes of coordinating the tasks. Coordination work activities include communication between workers, preparing work for the next step, delays while waiting for needed input or supervisory direction, and planning work activities. To illustrate our characterization of work, consider the process of refunding a customer for returned merchandise that was purchased by check. The process involves recording the data on the returned merchandise, recording the reason for the return, verifying if the check cleared, and if the check clears, making the refund. The mean times for the tasks are shown in Table I. Now, suppose verification of the check was done remotely by another clerk. Then the clerk processing the return must coordinate with this clerk. They must communicate with the remote clerk by telephone, wait if not
Quantifying coordination work 363
JEIM 22,3
364
Table I. Illustrative example with mean processing times in minutes
Performed by single clerk Record merchandise data Record return reason Check if check cleared Make refund Total Performed by two clerk Record merchandise data Record return reason Check if check cleared (performed remotely by another) Make refund Total
ta
tc
2.50 0.50 1.00 1.25 5.25
0 0 0 0 0.00 5.25
2.50 0.50
0 0
1.00 1.25 5.25
1.5 0 1.50 6.75
available, and then take down the information. The additional work encountered is what we term coordination work. Clearly, in this simple hypothetical example, the total amount of work depends on the task structure with the difference mainly being in the coordination work required. The coordination load is the ratio of the coordination work to the total work: CLi ¼
tci t ai þ t ci
ð2Þ
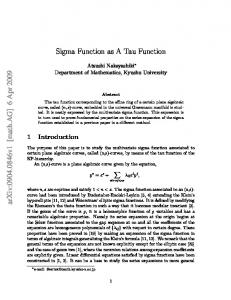
The research proposition is that coordination load is a function of task characteristics and the structure of the tasks. We assume that, in general, the activity work is invariant or changes little with respect to task structure; it is the coordination work that changes when the task structure changes. Referring back to Table I, the task of verifying if a check cleared involves matching the merchandise receipt to a check number and then searching a database for the check and verifying its status. The time to complete the task is the same under different task structures. It is the coordination time that changes when the task structure changes. However, the task activity time would change if the nature of the tasks changes. For example, if the verification process was automated with the use of information technology. The research model, shown in Figure 1, formalizes these ideas and hypothesizes links between task characteristics, task structure, process management, human resources and coordination load and performance, defined as time to complete the task. This model adheres to the information processing view of the organization (Galbraith, 1977). 2.1 Task uncertainty In information processing theory, task uncertainty is defined as, “the difference between the amount of information required to perform the task and the amount of information already possessed by the organization” (Galbraith, 1977). Task uncertainty has been operationalized along two dimensions of task analyzability and task variability (Perrow, 1970). Task analyzability, sometimes called complexity,
Quantifying coordination work
Task characteristics Analyzability variability
365
Task structure
Interdependence
Coordination load
Process management Coordination mechanisms
Performance
Human resource characteristics Skill knowledge experience
describes whether the task can be completed by following known procedures and routines or whether judgment is required (Blili et al., 1998; Gelderman, 2002; Chang et al., 2003). Task variability is defined as the number of exceptions encountered in the work (Perrow, 1970), and can be measured along a continuum of routine to non-routine. Together, task analyzability and variability influence the amount and nature of the information required to complete a task. If a task is unanalyzable and/or highly variable then the person completing that task will seek out more information, direction, and help in completing the task and thus increase the coordination load of the process. This gives rise to the first two hypotheses: H1. As a task becomes less analyzable, the coordination load will increase. H2. As a task becomes more variable, the coordination load will increase. 2.2 Interdependence The literature emphasizes that coordination is a result of interdependence between tasks (Thompson, 1967; van de Ven et al., 1976; Giachetti, 2006). In fact, Malone and Crowston (1994) defined coordination as, “the management of dependencies”. One of the primary reasons interdependencies emerge between tasks is due to the division of labor. If a single person did the entire task then there is no need for coordination. By virtue of decomposing a business process into individual tasks, interdependencies are created, and these interdependencies must be coordinated. Thompson (1967) conducted seminal work on coordination, and defined three types of interdependence in increasing strength and difficulty to coordinate as pooled,
Figure 1. Research model relating task to coordination load and performance
JEIM 22,3
366
sequential, and reciprocal. Pooled interdependence is the weakest kind and is based on shared resources. Sequential interdependence is when the outcome of one task is the input of the next task. Reciprocal interdependence is when tasks need to be performed in parallel because the output of one becomes the output of another and vice versa. This basic hierarchy of interdependence types continues to be utilized by researchers today (van de Ven et al., 1976; Christensen et al., 1999; Andres and Zmud, 2002). The third hypothesis is: H3. As interdependence between tasks increases the coordination load will increase. 2.3 Coordination mechanisms A coordination mechanism is a method or tool used to manage a dependency. Mintzberg (1979) defined six broad categories of coordination mechanisms that organizations can use to coordinate their tasks. These are: (1) standardization of norms, ideology and culture; (2) standardization of skills; (3) standardization of outputs; (4) standardization of work processes; (5) direct supervision; and (6) mutual adjustment. van de Ven et al. (1976) investigated how interdependence and uncertainty influence the coordination mechanisms utilized by organizations demonstrating that as the interdependence and uncertainty changes then the type of coordination mechanism utilized changes. The effect of a coordination mechanism would be reduction in the coordination load of the process. For example, given a process that has no formal coordination mechanisms then by standardizing the work process should lead to a reduction in the coordination load. 2.4 Human resources The performance of a task can be viewed as the interaction between the task and the person completing the task (Campbell, 1988). Consequently, the model must control for the skills, knowledge, and experience of the people completing the tasks. We collect this under the category of human resources. It is expected that highly skilled or knowledgeable employees would be able to perform uncertain and interdependent tasks with less need for coordination than less skilled or knowledgeable employees completing the same task. In the research model, the constructs of interest are task characteristics and task structure. Process management and human resource characteristics are included as moderators of the hypothesized relationships. 3. Management game and experimental design The management game is based on a production planning problem that spans three organizational units in a company: marketing, distribution and production. Each participant assumed the role of a manager of one of the departments. The simulation ran over four quarters in which the participants had to make decisions in each quarter.
The simulation was of a fictional company named SmartBike that manufactures two motor bike models, Lusso Bike and Grunde Bike. Lusso Bike is a high end, more expensive product with a seasonal demand, while Grunde Bike is the regular version (no frills) of the product with a stable demand and a price lower than that of Lusso Bike. The objective of the company is to maximize profits by selling the most bikes at the highest price. The game lifecycle began with the game administrator reading the instructions to the participants and explaining the tasks to be completed. The team then completed their tasks and made their decisions for the first quarter. Based on the decisions made by the team, the game moderator then updated the spreadsheet information to reflect actual sales and other events. This sequence was repeated for each of the quarters. Each period was limited to 30 minutes or two hours for the entire simulation game. After the fourth quarter, the team members were advised of their overall performance. A questionnaire was then administered to team members; the content of which is discussed later. Throughout the simulation experiment, the game moderator observed the team and recorded the amount of communication conducted. Each team member’s task was aided by the use of a spreadsheet. A different spreadsheet was used by each member in addition to a common global spreadsheet. Table II shows the tasks completed by each of the participants.
Quantifying coordination work 367
3.1 Experimental design A full factorial design (22 £ 31) with two replications for each treatment was conducted over a two-month period. The factors were variability and non-analyzability at two levels and interdependence at three levels: pooled (low), sequential (high) and reciprocal (high). The 12 treatments were labelled according to the level corresponding to the three factors. The experimental order of the treatment combinations was randomized. Subjects were randomly assigned to one of the 12 treatments and only participated in one game. To validate the simulation game, and to ensure that the development of the spreadsheets was correctly conveying the construct levels assigned, we did validation runs with 21 subjects (nine groups). Validation involved playing the game, observing behavior, and interviewing each participant following the simulation. Feedback received included comments about the verbiage of the simulation game instructions and lack of differentiation between some of the construct levels. To correct these problems, the instructions were rewritten and the game was modified. After incorporating the changes, the simulation was tested again following the same validation protocol. The testing allowed us to adjust the experimental tasks to ensure that the operationalization of the scenarios was correct, and the constructs were perceived at the right levels. Only after game testing was completed, did the actual simulation for the experiments begin. Participant role
Tasks
Marketing manager Production manager Logistics manager
Determine price of bikes, select forecast model and make demand forecast Plan production, labor and machinery required by quarter Plan inventory levels and distribution of finished goods
Table II. Participant roles and tasks
JEIM 22,3
368
3.2 Participants In total, 56 participants organized into 24 teams were drawn from a population of undergraduate and graduate industrial and systems engineering, business administration, and engineering management students (started with 75 subject, 31 groups but groups that failed the validity test were eliminated). A pretest questionnaire elicited demographic information, the grade point average (GPA), and professional experience. The GPA was used as a covariate for the human resources skills and knowledge construct. More than 60 per cent of the participants had some industry experience. The participant makeup was 59 per cent male and 41 per cent female, and 54 per cent undergraduate and 46 per cent graduate. All subjects had successfully completed, or were currently enrolled in a production planning course that emphasized forecasting models, inventory models and production scheduling. Other than these academic requirements players were chosen randomly. We felt this reflect actual work situations in which team members have a variety of skills and experience. 3.3 Task analyzability Task analyzability was manipulated to be at two levels, low and high. In the treatments with high-task analyzability, the tasks were less complex by requiring fewer decisions, how to conduct the task was straightforward, and the task information was unambiguous. In the treatments with low-task analyzability, the tasks were made more complex by requiring more decisions, making these decisions required personal judgment, and some of the task information was ambiguous. To illustrate the different levels, the marketing manager, in low analyzability, had three forecasting models available to use. Each forecasting model requires different parameters and only general guidelines on how to set the parameters was provided. For high analyzability the marketing manager had only one forecasting model and parameter values were suggested. Additionally, in the low-analyzability treatments, the marketing manager had the freedom to change the price and therefore affect the demand while in the high-analyzability treatment the marketing manager could not change the price. 3.4 Task variability Task variability was manipulated at the two levels of low and high. In experimental tasks with low variability, the tasks for each participant were exactly the same in each quarter. In other words, the tasks were routine. In experimental treatments with high-task variability the tasks changed slightly in each quarter. In other words, the tasks were not routine. This was done by changing the models they used and/or the information available in each quarter. 3.5 Interdependence The structure of the tasks was manipulated to achieve the three types of interdependence. For pooled interdependence the team had two members, each assuming the role of a product manager for the two products (Lusso Bike and Grunde Bike). They had pooled interdependence because they could act independently but had to share resources, in this case the manufacturing facility. Sequential interdependence had three managers, one for each of the functional departments. The work was structured such that the output of marketing was the input of distribution, whose output was the input of production. Reciprocal interdependence had two team
members like pooled but now the decisions were structured such that they were interdependent requiring negotiation and closely working together. For example, the marketing decision in reciprocal scenarios had constraints on the ratio of Lusso Bike’s price to Grunde Bike’s price. Consequently, the decisions could no longer be made in isolation.
Quantifying coordination work
3.6 Coordination mechanism In the experimental scenarios, coordination mechanisms were not manipulated but controlled for by limiting coordination mechanisms to communication only. Communication is a primary means of effecting coordination (Allen, 1991; Weigand et al., 2003). While no special mechanisms such as standardization are employed, it is natural that since the participants were drawn from a pool of engineering and management students that they share similar backgrounds, norms, and so forth. Consequently, to some extent there is standardization of norms as defined by Mintzberg (1979). However, this reflects actual work scenarios which are not governed solely by a single coordination mechanism.
369
3.7 Coordination load The game moderator observed each team during the game and recorded the number of communications and their length. Then, the coordination load experienced by the group was calculated using equation (2). 3.8 Performance Performance of the task was measured as total profit. The teams were instructed to act collectively to obtain the greatest profit. Motivation for each team to participate and maximize total profit was provided for through extra credit in their coursework. 3.9 Manipulation checks The three independent variables (variability, non-analyzability and interdependence) were manipulated as described above. To test our manipulations, we measured the participants’ perception of each construct using the questionnaire shown in the Appendix, and analyzed to determine construct and instrument validity. The questionnaire measured the variables in a multiple item six-point response format (Likert scale) where 1 – “strongly disagree” and 6 – “strongly agree” and there is no neutral point. The total score is simply the sum across the items, with some items being reversals. The analysis to determine the questionnaire validity consists of examining the extent to which an instrument is truly measuring the construct that it is supposed to measure (Huck, 2003). The validity of the questionnaire was measured to determine the extent to which the questionnaire yields the same results when administered to different people (Nunally, 1978; Flynn et al., 1990). The questionnaire included questions to determine the understanding of the simulation game. These questions were similar but not the same; the goal was to test for consistency in the response (determining understanding of the game conditions). A negative answer in at least one of these questions suggested miscomprehension of the simulation game, resulting in failing the validity test. Players that failed the validity test caused the invalidation of
JEIM 22,3
370
the data set. Based on the responses to the validity questions 19 players failed the test, which resulted in the elimination of seven groups. The analysis of internal consistency or reliability determines the measure in which the survey questions addressed to the participants are connected, and whether they measure the same construct coherently. The method used for this purpose was Cronbach’s alpha, also known as the coefficient of reliability. The widely accepted cut-off is that alpha should be 0.70 or higher for a set of items to be considered a valid measure of the construct, but some authors are as lenient as 0.60 (Cronbach, 1951; Hensley, 1999). To test whether we correctly manipulate the constructs between high and low, we perform a x 2-test to compare the observed versus expected frequencies for each construct. If the x 2-test indicates that a question is significant then we conclude that the responses to the question are not due to chance, and the question accurately measures the construct. 4. Analysis of experimental results The experimental results are summarized in Table III. The hypotheses are tested using the analysis of covariance (ANCOVA). ANCOVA is chosen because it includes covariates in the general linear model that allows us to account for inter-group variation associated with the covariates. The ANCOVA results in Table IV show that non-analyzability and interdependence are significant ( p ¼ 0.036 and p ¼ 0.000, respectively) with respect to coordination load. However, variability is not significant ( p ¼ 0.659) with respect to coordination load. None of the interactions between the independent variables are found to be significant with respect to coordination load. Interdependence
Non-analyzability
Variability
Pooled
Low Low High High Low Low High High Low Low High High Low Low High High Low Low High High Low Low High High
Low Low Low Low High High High High Low Low Low Low High High High High Low Low Low Low High High High High
Sequential
Reciprocal
Table III. Experimental results
Average GPA
Coordination load
Profit ($)
2.99 3.30 3.35 3.35 3.50 3.11 3.03 3.71 3.10 3.47 3.43 3.40 3.57 3.40 3.20 3.68 3.31 3.35 4.00 3.15 3.03 3.36 3.56 3.35
0.129 0.130 0.168 0.185 0.162 0.150 0.241 0.261 0.114 0.077 0.226 0.354 0.053 0.127 0.270 0.138 0.424 0.358 0.415 0.442 0.354 0.411 0.384 0.358
497,546 150,194 85,200 453,102 240,906 263,624 23,566 295,126 303,152 339,400 412,637 318,538 221,796 150,769 14,635 234,176 287,678 477,996 202,871 277,896 260,503 341,342 412,665 151,703
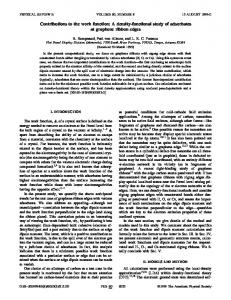
In Table V, the ANCOVA results show that variability has a significant effect on profit ( p ¼ 0.049) while the other factors are found to be insignificant (non-analyzability p ¼ 0.449 and interdependence p ¼ 0.148). The covariate GPA is significant ( p ¼ 0.025) on profit. None of the interactions between the independent variables are found to be significant with respect to profit. As suspected, the empirical results demonstrate that high levels of non-analyzability and interdependence lead to an increased coordination load; the results of the analysis of covariance explain 82 per cent of the variability of the model (R 2). However, contrary to our predictions, we do not find evidence that variability affects coordination time, or that any of the interactions between the main effects are significant. Prior to analyzing any correlations between coordination load and profit we conducted a normality test. Both coordination load and profit are found to be normally distributed at a confidence level of a ¼ 0.05. Since both dependent variables are found to be normally distributed, we perform an analysis of variance to determine if the dependent variables are correlated. The relationship between coordination load and profit is weak ( p ¼ 0.101). Pearson’s correlation between the two dependent variables, coordination load and profit is – 0.086, which is essentially a negligible correlation. We conclude there is no correlation between coordination load and profit. Beyond establishing the relationship between task characteristics and task structure with coordination load, we wanted to understand the nature of the relationship between tasks and coordination load. Analysis of the data (Figure 2) Source
df
Mean square
F
Significant
Variability (V) Non-analyzability (A) Interdependence (I) GPA (covariate) V£A V£I A£I
1 1 2 1 1 2 2
29.4 816.7 6,144.8 60.2 32.4 108.9 289.2
0.205 5.687 42.790 0.419 0.226 0.759 2.014
0.659 0.036 0.000 0.531 0.644 0.491 0.180
2
Notes: Total df ¼ 23; R ¼ 0.821
Source
df
Mean square
F
Significant
Corrected model Intercept Variability Non-analyzability Interdependence GPA (covariate) V£A V£I A£I Error Total
10 1 1 1 2 1 1 2 2 11 22
20,638,708,359.3 47,648,851,844.5 58,208,986,485.7 7,297,709,781.5 27,086,037,879.7 79,850,181,302.0 14,291,429,876.6 21,413,924,136.8 1,560,080,914.3 11,858,090,462.7
1.740 4.018 4.909 0.615 2.284 6.734 1.205 1.806 0.132
0.188 0.070 0.049 0.449 0.148 0.025 0.296 0.210 0.878
Notes: R 2 ¼ 0.613; adjusted R 2 ¼ 0.261
Quantifying coordination work 371
Table IV. ANCOVA results for coordination load
Table V. ANCOVA results for profit
JEIM 22,3
0.45 Analyzable Not analyzable 0.40
0.35
372 Coordination load
0.30
0.25
0.20
0.15
0.10
Figure 2. Coordination load as a function of interdependence and analyzability
0.05
0.00 Pooled Sequential Note: Each point represents the mean of the four trials
Reciprocal
shows that, for a given level of task analyzability, the coordination load is essentially equal for pooled and sequential interdependence (CL ¼ 0.178 and CL ¼ 0.170, respectively); while coordination load increases dramatically for reciprocal interdependence (CL ¼ 0.393). In all scenarios, as the task becomes more un-analyzable the coordination load increases. 5. Discussion of experimental results The experiments support H1 and H3 that coordination load is dependent on task analyzability and task interdependence. These findings agree with previous literature investigating interdependence and analyzability with coordination. The experiments fail to show any significant relationship between task variability and coordination load. The literature and some other empirical studies indicate there is a relationship. Post interviews with some participants and the observations made by the game moderator suggest that the simulation game was too short for participants to adequately develop a routine; consequently, we observe little difference between low variability (routine tasks) and high variability (non-routine tasks). In field studies, in which the subjects have worked in a job sometimes for several years, routineness is well-developed, which may explain the finding of significance in these studies (Gitell, 2002). We make two observations concerning the relationship between interdependence and coordination load. First, the experiments find no significant difference between pooled and sequential interdependence and the resulting coordination load.
Second, coordination load increases greatly when interdependence changes from sequential to reciprocal. The first experimental observation on interdependence runs counter to the traditional organizational theory that says sequential interdependence requires greater coordination than pooled interdependence. We find no support for this in our experiments. One possible explanation is that the construct of interdependence is not manipulated correctly. However, game validation and the manipulation checks all indicate interdependence is properly operationalized between the different levels. An alternative explanation for no observed difference between pooled and sequential interdependence can be explained by the way they are defined. This research utilizes the interdependence definitions derived from the work by Thompson (1967), which emphasizes the workflow only. However, a paper by Giachetti (2006) argues that only considering the workflow may be insufficient without also considering attributes of the workflow such as importance, delay, and frequency. Application of the interdependence measured based on Giachetti (2006) results in the normalized (between 0 and 1) values of 0.47, 0.56, and 0.79 for pooled, sequential, and reciprocal interdependence, respectively. The difference of 0.09 between pooled and sequential is half of the difference of 0.23 between sequential and reciprocal, which might explain why the experiments show no significant difference between pooled and sequential. A finer measurement resolution between degrees of interdependence may allow more accurate prediction of coordination load. Since this analysis is done after the experiments were completed, further studies would be needed to statistically verify this finding. The second observation on interdependence conforms to extant theory that interdependence is a dominant factor in determining coordination load. The experiments show that coordination load almost doubles when the task structure changes from pooled or sequential to reciprocal interdependence. In the reciprocal interdependence scenarios, the participants spent almost 40 per cent of their time on coordination work. These findings have strong implications for process design. Most literature on business processes extols the benefits of greater parallelization of activities to decrease total cycle-time. These experiments strongly suggest that process designers must balance the gains from parallelization against the increased time that must be spent on coordination work. One means to mitigate the need for increased coordination is via special coordination mechanisms. The literature is replete with suggestions on ways to improve coordination under different scenarios (Camarinha-Matos and Pantoja-Lima, 2001; Gitell, 2002; Albino et al., 2003; Crowston, 2003). In addition to task structure, the task characteristic of analyzability is found to be a significant factor determining coordination load. In all scenarios, as analyzability decreases, the amount of time spent on coordination work increases. These findings underscore the importance of standardizing the work, providing tools to make decisions more objective, and developing work procedures to improve the efficiency of conducting the work. The covariate of GPA is found significant with respect to performance, and is consistent with past studies that have found that greater domain knowledge and greater skills result in improved decision-making performance (Mackay and Elam, 1992). Thus, groups that had better skills as represented by GPA generally outperformed other groups regardless of the scenario. This study utilizes a research design based on laboratory experiments conducted with student participants. While a laboratory experiment affords us greater control
Quantifying coordination work 373
JEIM 22,3
374
over independent variables; it also calls in question the external validity or generalizability of the results. The use of business simulation games has been accepted as a valid research tool with high internal and some external validities (Elgood, 1988; Dickinson et al., 2004). The threats to external validity come from limited realism, the propensity of participants to not behave realistically because of no or non-enduring consequences, and limited sample size due to time constraints of game administrator. The laboratory experiments also lack the social dynamics that govern how people work together, or the informal coordination mechanisms that will evolve to work around poorly designed processes. We address some of these threats in our research design although they cannot be completely eliminated. The game is realistic. We measure the participation level of the participants to see they fully participated. The use of students in a simulated environment, when they possess all the information necessary to perform the task, should provide the same evidence as would be observed in actual work contexts (Ashton and Kramer, 1980; Ho¨st et al., 2000; Potters and Winden, 2000). 6. Conclusions This paper investigates the relationship between task structure and task characteristics with coordination load using a management simulation game and a factorial design of experiments. In the introduction, we had postulated that the extra work observed when going from a sequential to a parallel task structure was due to an increase in coordination. We developed this idea and built on the literature to propose a research model relating task structure and task characteristics to coordination load. A management simulation game with a design of experiments was used to analyze the research model. The experimental results confirm our basic hypothesis. The experimental results help support the conceptualization of work, because they showed that when the task structures changes, then the amount of coordination load increases from a low of 5 per cent to a high of 40 per cent. Clearly, understanding how interdependence and task analyzability impact coordination load is important to the design of business processes. The paper contributes to the operational definition of coordination load, and to demonstrating the influence of task characteristics and task structure on coordination load. Further work can be done to develop better measures of task interdependence and analyzability, to better incorporate task variability into the experiments, to uncover other factors that may influence coordination load, and to analyze the efficacy of different coordination mechanisms in reducing the coordination load. References Albino, V., Carbonara, N. and Giannoccaro, I. (2003), “Coordination mechanisms based on cooperation and competition within industrial districts: an agent-based computational approach”, Journal of Artificial Societies and Social Simulation, Vol. 6 No. 4. Allen, T.J. (1991), “Organizational structure, information technology, and R&D productivity”, IEEE Transactions on Engineering Management, Vol. EM-38 No. 2, pp. 101-9. Andres, H.P. and Zmud, R.W. (2002), “A contingency approach to software project coordination”, Journal of Management Information Systems, Vol. 18 No. 3, pp. 41-70. Ashton, R.H. and Kramer, S.S. (1980), “Students as surrogates in behavioral accounting research: some evidence”, Journal of Accounting Research, Vol. 18 No. 1, pp. 1-13.
Blili, S., Raymond, L. and Rivard, S. (1998), “Impact of task uncertainty, end-user involvement, and competence on the success of end-user computing”, Information & Management, Vol. 33 No. 3, pp. 137-53. Camarinha-Matos, L.M. and Pantoja-Lima, C. (2001), “Cooperation coordination in virtual enterprises”, Journal of Intelligent Manufacturing, Vol. 12, pp. 133-50. Campbell, D.J. (1988), “Task complexity: a review and analysis”, Academy of Management Journal, Vol. 13 No. 1, pp. 40-52. Chang, R.-D., Chang, Y.-W. and Paper, D. (2003), “The effect of task uncertainty, decentralization and AIS characteristics on the performance of AIS: an empirical case in Taiwan”, Information & Management, Vol. 40, pp. 691-703. Christensen, L.C., Chtristiansen, T.R., Jin, Y., Kunz, J. and Levitt, R.E. (1999), “Modeling and simulating coordination in projects”, Journal of Organizational Computing and Electronic Commerce, Vol. 9 No. 1, pp. 33-56. Cronbach, L.J. (1951), “Coefficient alpha and the internal structure of tests”, Psychometrika, Vol. 16, pp. 297-333. Crowston, K. (2003), “A taxonomy of organizational dependencies and coordination mechanisms”, in Thomas, K.C., Malone, W. and Herman, G.A. (Eds), Tools for Organizing Business Knowledge: The MIT Process Handbook, MIT Press, Cambridge, MA, pp. 85-108. Dickinson, J.R., Gentry, J.W. and Burns, A.C. (2004), “A seminal inventory of basic research using business simulation games”, Developments in Business Simulation and Experiential Learning, Vol. 31. Elgood, C. (1988), Using Management Games, 4th ed., Gower Publishing Company, Brookfield, VT. Flynn, B.B., Sakakibara, S., Schroeder, R.G., Bates, K.A. and Flynn, E.J. (1990), “Empirical research methods in operations management”, Journal of Operations Management, Vol. 9 No. 2, pp. 250-84. Fussell, S.R., Kraut, R.E., Lerch, F.J., Sherlis, W.L., McNally, M. and Cadiz, J.J. (1998), “Coordination, overload, and team performance, effects of team communication strategies”, Proceedings of the 1998 ACM Conference on Computer Supported Cooperative Work, ACM, Seattle, WA, pp. 275-84. Galbraith, J.R. (1977), Organizational Design, Addison-Wesley, Reading, MA. Gelderman, M. (2002), “Task difficulty, task variabiilty and satisfaction with management support systems”, Information & Management, Vol. 39, pp. 593-604. Giachetti, R. (2006), “Understanding interdependence in enterprise systems: a model and measurement formalism”, in Johann Eder, J. and Dustdar, S. (Eds), Business Process Management Workshops, Springer, Vienna. Gitell, J.H. (2002), “Coordinating mechanisms in care provider groups: relational coordination as a mediator and input uncertainty as a moderator of performance effects”, Management Science, Vol. 48 No. 11, pp. 1408-26. Hensley, R.L. (1999), “A review of operations management studies using scale development technique”, Journal of Operations Management, Vol. 17 No. 3, pp. 343-58. Ho¨st, M., Regnell, B. and Wohlin, C. (2000), “Using students as subjects – a comparative study of students and professionals in lead-time impact assessment”, Empirical Software Engineering, Vol. 3 No. 3, pp. 201-14. Huck, S.W. (2003), Reading Statistics and Research, 4th ed., Allyn & Bacon, New York, NY. Kraut, R.E. and Streeter, L.A. (1995), “Coordination in software development”, Communications of the ACM, Vol. 38 No. 3, pp. 69-81.
Quantifying coordination work 375
JEIM 22,3
376
Krishnan, V., Eppinger, S.D. and Whitney, D.E. (1997), “A model-based framework to overlap product development activities”, Management Science, Vol. 43 No. 4, pp. 437-51. Kunz, J.C., Levitt, R.E. and Jin, Y. (1998), “The virtual design team: a computational simulation model of project organizations”, Communications of the Association for Computing Machinery, Vol. 41 No. 11, pp. 84-92. Lawrence, P.R. and Lorsch, J.W. (1967), Organization and Environment, Harvard Graduate School of Business, Cambridge, MA. Levitt, R.E., Thomsen, J., Christiansen, T.R., Kunz, J.C., Jin, Y. and Nass, C. (1999), Simulating Project Work Processes and Organizations: Toward a Micro-contingency Theory of Organizational Design, Grant SBR-9422389, 32, National Science Foundation, Arlington, VA. Mackay, J.M. and Elam, J.J. (1992), “A comparative study of how experts and novices use a decision aid to solve problems in complex knowledge domains”, Information Systems Research, Vol. 3 No. 2, pp. 150-72. Malone, T.W. (1987), “Modeling coordination in organizations and markets”, Management Science, Vol. 33 No. 10, pp. 1317-32. Malone, T.W. and Crowston, K. (1994), “The interdisciplinary study of coordination”, ACM Computing Surveys, Vol. 26 No. 1, pp. 87-119. Mintzberg, H. (1979), The Structuring of Organizations, Prentice-Hall, Englewood Cliffs, NJ. Mintzberg, H. (1992), Structure in Fives: Designing Effective Organizations, 1st ed., Prentice-Hall, New York, NY. Nunally, J.C. (1978), Psychometric Theory, McGraw-Hill, New York, NY. Perrow, C. (1970), Organizational Analysis: A Sociological View, Wadsworth Publishing Company, Belmont, CA. Potters, J. and Winden, F.V. (2000), “Professionals and students in a lobbying experiment: professional rules of conduct and subject surrogacy”, Journal of Economic Behavior & Organization, Vol. 43, pp. 499-522. Sherman, J.D. (2004), “Optimal modes and levels of integration, and the identification of cross-functional coordination deficiencies in concurrent engineering”, IEEE Transactions on Engineering Management, Vol. 51 No. 3, pp. 268-79. Thompson, J.D. (1967), Organizations in Action: Social Science Bases of Administrative Theory, McGraw-Hill, New York, NY. van de Ven, A., Delbecq, A.L. and Koenig, R. (1976), “Determinants of coordination modes within organizations”, American Sociological Review, Vol. 41, pp. 32-338. Weigand, H., van der Poll, F. and de Moor, A. (2003), “Coordination through communication”, Proceedings of the 8th International Working Conference on the Language-action Perspective of Communication Modeling, Tilburg. Williams, T., Eden, C., Ackermann, F. and Tait, A. (1995), “Vicious circles of parallelism”, International Journal of Project Management, Vol. 13 No. 2, pp. 151-5. Corresponding author Alba N. Nun˜ez can be contacted at:
[email protected]
To purchase reprints of this article please e-mail:
[email protected] Or visit our web site for further details: www.emeraldinsight.com/reprints