current research on the business value of IT, as shown in Fig. 1, instead of relating ... By including its impact on the organization in the analysis of IT, a more diversified ..... Jersey, USA (2003). 22. ... Springer New York, Secaucus, New. Jersey ...
Quantifying IT impacts on organizational structure and business value with Extended Influence Diagrams Pia Gustafsson1, Ulrik Franke1, David Höök1, Pontus Johnson1, 1
Royal Institute of Technology, Industrial Information and Control Systems, Osquldas v.12, SE-100 44 Stockholm, Sweden {piag, ulrikf, davidh, pj101}@ics.kth.se
Abstract. This paper presents a framework for analysis of how IT systems add business value by causally affecting the structure of organizations. The well established theory of organizational behavior developed by Mintzberg combined with more recent research on business value of IT is used to develop a quantitative theoretical framework showing which business values are affected by IT in relation to the organizational structure. This framework, which is based upon a qualitative equivalent developed in an earlier paper, describes relationships in an Extended Influence Diagram for quantified conditional probability tables and open up for an empirical appliance. Hence obtained data can be mathematically expressed for more sound assessments. The intention is to create a fully functioning tool for analyses of what kind of IT system should be used by an organization with a given structure to maximize its business value. Keywords: IT benefits, organizational structure, Mintzberg, business value
1 Introduction It has long been discussed in the IT value research area whether IT adds value to an organization or not. Following Brynjolfsson [1], the discussion in the literature increasingly supports the theory that IT can add business value to an organization. For instance, Bergsjö et al [2] have shown that the user satisfaction achieved by functionality, usability, information structure etc. affects the quality, efficiency and innovations of IT users. Researchers (and practitioners) now turn focus to the question of how IT adds value to the organization [3]. This problem is approached here by an attempt to combine the traditional theory of organizational structures with more recent research on how aspects of IT affect the structure or the workings of the organization. Dahlgren [4] stresses that organizational structure has a defining role on how information flows within an organization and, as a consequence, how well processes are performed and resources are spent. Other studies of the impact of electronic communication systems on business organizations are Fulk et al., [5], Andersen [6,] and Gurbaxani et al. [7]. Traditional organizational theory describes organizations; the behavior of groups of people in them, how strategies and structures influence the groups, how the organizations suit different purposes and how they can be managed to achieve goals.
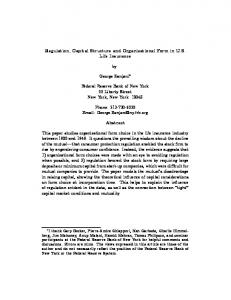
Research on the business value of IT, often within the enterprise architecture research paradigm, tends to focus on the relation between various information systems and business values, not necessarily taking other organizational factors, such as the division of labor, unit size and grouping, training, etc. into account [8]. Our method is directed at the synthesis of traditional theories of organization and management and current research on the business value of IT, as shown in Fig. 1, instead of relating IT to the final business values directly.
Fig. 1 The relationship between IT and business value goes through organizational impact
By including its impact on the organization in the analysis of IT, a more diversified and correct evaluation can be achieved. In [12], a qualitative framework for describing the causal influence of organization and IT on business value is given. In the present article, we aim to make that description quantitative. Using a quantitative, Bayesian, description lets the model be iteratively trained in a non-arbitrary manner as empirical evidence is collected. This enables future research to contribute and be fully integrated into the present framework. 1.1 Outline The remainder of this paper is structured as follows. Extended influence diagrams used for probabilistic modeling are introduced in section 2, along with the phenomena that are described with the conditional probability tables. Section 3 presents an overview of our use of organizational theory, taxonomy of business values and categorization of IT systems. Section 4 is structured to reflect the organizational theory of Mintzberg [8], but describes in detail the entire causal chain from IT systems, via organization, to business values. The research results are discussed in Section 5 and Section 6 concludes the paper.
2 Related works The Influence Diagram approach adopted in the present paper is but one out of several possible formalisms for quantitative Enterprise Architecture analysis. One alternative is Dempster–Shafer theory [9,10]. Dempster–Shafer is designed to represent degrees of belief, something that a pure Bayesian formalism is capable of only to a limited degree. Dempster–Shafer theory, however, cannot represent decisions and goals. I* (or I-star) is a goal-oriented description framework where actors, their goals and the dependencies between these are modeled [11]. While an I* inspired framweok was used in a previous paper [12], this formalism is unable to deal formally with different kinds uncertainties, and was therefore abandoned in the present paper. Both
Dempster–Shafer theory and I* are more thoroughly evaluated against the Bayesian approach in [13]. The notion of leaky probabilistic relationships is described in [14]. The noisy OR-gate was introduced in [15]. Several organizational theories have tried to describe the complexity of organizations from different aspects. The classical organization theory starts with Weber and Fayol presenting the cornerstones of management and bureaucracy. Mintzberg’s theories belong to modern structural theories. Later organizational theories are often inspired by adjacent fields, such as system theories [16], ecology [17] and feminist theories [18] but has not yet been able to present a complete theory that describes all areas of the organization.
3 Extended Influence Diagrams Extended Influence Diagrams (EID) are graphic representations of decision problems coupled with an underlying representation of the conditional probabilities. These diagrams may be used to formally specify enterprise architecture analysis [13]. The diagrams are an extension of influence diagrams, as described by Shachter [16, 20] which in turn are an enhancement of Bayesian networks (cf. Neapolitan [21] and Jensen [22]). In extended influence diagrams, random variables graphically represented as chance nodes may assume values, or states, from a finite domain (cf. Fig. 2). A utility node represents “what is desirable”, this could for example be “Organizational performance” as it is in Fig. 2. The utility node could be further described by other nodes that it has a definitional relation to. Causal relations capture associations of the real world, such as “an automation system affects the process efficiency”. In Fig. 2, this is visualized by “Scenario Selection” that causally affects the “Process efficiency” which itself causally affects the “Organizational performance”.
Fig. 2 An extended influence diagram and a simple example
The framework presented here has been developed following the methodology given by Lagerström et al [23]. Extended influence diagrams support probabilistic inference in the same manner as Bayesian networks do; given the value of one node, the values of related nodes can be calculated. With the help of a conditional probability table (CPT) for a certain variable A and knowledge of the current states of the causally
influencing variables B and C, it is possible to infer the likelihood of node A assuming any of its states. With a chosen scenario, the chance nodes will assume different values, thereby influencing the utility node. For more comprehensive treatments on influence diagrams and extended influence diagrams see Johnson et al. [13], Shachter [16, 20], Neapolitan [21], Jensen [22], and Lagerström et al [23]. However powerful a research tool the EID framework is, EID:s cannot be created ex nihilo. There exists a lot of research on how to elicit the quantitative estimates of probabilities used to create CPTs, for example Druzdzel et al. [24] and Keeney et al. [25] suggests sources such as; statistical data, literature and human experts to be applied on a network composed of well defined entities (nodes) and relationships covering a properly demarcated domain of interest. The risk of introducing bias into the assessments is of great concern when it comes to these types of sources, specifically when human experts are consulted. By using the formalism of EID:s this can be remedied by taking uncertainty into consideration in the modeling. Keeney et al. acknowledges this in [16] where a formal process of eliciting more rigid probabilistic judgments is outlined. One important feature is that CPTs can be updated in a non-arbitrary fashion, using the well-known learning algorithms of Bayesian networks described for instance by Jensen [22], whenever empirical data is available. Thus, crude conditional probability tables based upon theory only can be fine-tuned as empirical data is collected. 2.1 Parametric CPTs In [12] the EID formalism was used in a qualitative manner, identifying various relations not given precise CPTs. While allowing for ease and intuition of modeling, this approach is unsuitable for further research and case study validation. The problem of creating accurate parametric conditional probability distributions is basically a trade-off. On the one hand, (i) there is a need for expressiveness, in the extreme best met by allowing arbitrary distributions satisfying Kolmogorov’s axioms. On the other hand, (ii) there is a need for domain specificity, capturing the complex organizational relationships investigated. In particular, three phenomena were taken into account: 1. Incompleteness. However thorough a model is, it will inevitably not take all relevant factors into account. A common statistical method to deal with this model incompleteness is to include a “background event”; the conjunction of all factors not explicitly accounted for. This is usually accomplished through “noisy” relations, as described in [22][14][15]. 2. Weighting. Frequently, the relative importance of different factors influencing a property (such as process specifications and automation systems influencing standardization) can be determined and expressed as weights. This is the lynchpin of the popularly used analytic hierarchy procedure, [26]. 3. Dominance. Related to weighting is the notion of dominance. If several factors influence a property, they might be ordered in a domination relation, such that if factor A is present, factor B will not affect the outcome, but if factor A is absent, factor B might determine the outcome.
A third factor C might determine the outcome if B is absent, etc. This is somewhat similar to the notion of thresholds and squashing functions from artificial neural networks [27]. In the following, we present a number of parametric conditional probability relations that model these phenomena. Our first relation is the trivial unary relation from A to B, see in Fig. 3 how this is denoted graphically with the incompleteness variable α. By varying the leakage parameter α introduced in Table 1, the incompleteness property is modeled. Weighting and dominance do not exist in this context, of course.
Fig. 3 The unary relation
Fig. 4 The weighted leaky relations
Table 1. CPT for unary relation A B
High
High
Low
1-α
α
Low 1-α α As we proceed to consider n-ary relations, however, the need for weighting arises. The weights β introduced in table 2 express the relative weight of factors, such that if A is twice as important as B, then βA/βB = 2. The α parameter is retained to express leakage. Thus a leaky weighted sample distribution is created; see Fig. 4 where β is introduced to denote the weighting of the relations. Table 2. CPT for leaky weighted sample distribution A
High
B C
High High
⎛ βA βB ⎜⎜ + + β β β B A + βB ⎝ A ≡ 1−α
Low
α
Low Low
⎞ ⎟⎟ − α ≡ ⎠
High
Low
⎛ βA ⎜⎜ ⎝ βA + βB
⎞ ⎟⎟ − α ⎠
⎛ βB ⎜⎜ ⎝ βA + βB
⎞ ⎟⎟ + α ⎠
⎛ βB ⎜⎜ ⎝ βA + βB
⎞ ⎟⎟ + α ⎠
⎛ βA ⎜⎜ ⎝ β A + βB
⎞ ⎟⎟ − α ⎠
α
⎛ βA βB ⎜⎜ + β β β + B A + βB ⎝ A ≡ 1−α
⎞ ⎟⎟ − α ≡ ⎠
It should be clear how this distribution is modified for arities greater than 2. Weighting, however, cannot express the dominance effect, see Fig. 5 where the dominance factors γ are introduced. To cope with this matter, we introduce the distribution of table 3. Quantity C
Quantity A
Quantity B
Fig. 5 The leaky dominant relation
Table 3. CPT for leaky dominance relation A
High
B
High
C D
Low Low
High
Low
High
Low
High
Low
High
Low
High
Low
High
1-γΑ−α
1-γΑ−α
1-γΑ−α
1-γΑ−α
1-γΒ−α
1-γΒ−α
1-γC−α
0
Low
γΑ+α
γΑ+α
γΑ+α
γΑ+α
γΒ+α
γΒ+α
γC+α
1
The leaky dominance relation CPT is easily constructed. First, a dominance ordering between the quantities involved is established, e.g. A dominates B, B dominates C. Then, whenever A is high, the probability of D being high is set to 1-γAα. When A is low, B is the dominant factor, and whenever B is high, the probability of D being high is set to 1-γB-α. When neither A nor B is high, C is the dominant factor, and the probability of D being high is set to 1-γC-α. If none of A, B, and C is high, the probability of D being high is (deterministically) set to 0. It should be noted, however, that even though the rationale for the dominance relation is to express dominance and saturation phenomena, it has other uses. For instance, by setting all the γ parameters small and equal, a leaky OR-relation is achieved. Sometimes, this is useful.
3 Combining organizational theory, IT and business values Business value is a debated subject within the domain’s research literature. Several ways to categorize possible IT benefits, differing in scope and granularity, have been suggested. In this work, the categorization of business value dimensions suggested by Gammelgård et al. [28] is used to map the business value to the factors Mintzberg describes [8] to common IT business value categories. The categorization
Gammelgård proposes is based on a literature study combining more than 650 business value dimensions from 200 different sources. Since the research focus here is the organization, only a subset of those IT benefits classified by [28], viz. those related to the organizational structure and the resources within the company were related to the Mintzberg theories. By using a familiar vocabulary the work in this paper can be related to other, previously conducted research within the domain of business value. The business values relevant to this paper are flexibility, efficiency, effectiveness, integration and coordination, decision making, control and follow up and organizational culture. For practical use of the framework, the business values should be weighted against each other to represent the business needs. These business values are visualized in Fig. 6.
Business Value
7
1 Flexibility
3 2
5
Effectiveness
Decision making
6
Organizational culture
4 Efficiency
Integration and coordination
Control and follow up
Fig. 6 The business values organizational structure affect, based on Gammelgård et al. [28].
Henry Mintzberg [8] proposes a theory of organization that is now classic within the field. Based upon a synthesis of the literature, Mintzberg attempts to model the form and functioning of organizations by structuring those external and internal factors. Mintzberg’s theory is used because it allows for an organization wide view of IT benefits. Furthermore it is readily employed in the research where organizational theories are to be cross fertilized with other associated domains, e.g. in Farbey et. al. [29] it is used to analyze organizational structures and their impact on an IT project. Focus in this paper is on the internal factors, the design parameters, i.e. those factors that can be consciously affected by management decisions Mintzberg [8] presents the following design areas; (i) design of positions, (ii) design of superstructure and (iii) design of lateral linkages. Since the areas are applicable for all organizations, no business specific views can be included in the analysis, such as degree of functional fit. These are the fundamental building blocks that in an overarching manner form the constructed EID. These design areas are further described in chapter 4. Several concepts used in the literature do not express a clear causality chain, but implies that most concepts are related to each other, sometimes in circular causality. To avoid circular causality chains, and to minimize the complexity of calculations, a small subset of Mintzberg’s relations is excluded. The relations that have been
excluded are those where no direct causality between two concepts could be identified. After identifying areas where IT can complement and support the organization, two main system types have been discerned; IT systems that enable communication (vertically and horizontally) between organizational units, and systems that control the processes; either completely (through automation) or partially (through directing the work flow). Hence, we propose the following taxonomy of IT systems, based on the function they fulfill: 1. Horizontal communication. This applies to the communication among peers, for example in a project group using a collaboration system. Bidirectional communication is a distinguishing feature. 2. Vertical communication. This includes both the upward stream of data that generates decision support for top and middle management (aggregation of information) and the downward stream of data that directs the work of subordinates (dissemination of orders). The unidirectional (either way) communication is a distinguishing feature. 3. Work flow. This is the class of systems that standardize work behavior by forcing the user to do things in a certain order or by a certain procedure. This is a semiautomated form of manual labor, where the actual work is still performed by a human, but the process is coordinated by a machine. 4. Automation. This represents a further step, as compared to work flow. Work is now fully automatic, performed by a machine. The human operator performs only supervisory tasks. Below in Fig. 7 the full EID, taking the business values, organizational aspects as well as IT-systems into consideration, is depicted.
Business Value
Flexibility
Efficiency
Market based structure
Functional structure
Effectiveness
Organizational structure
Level of liaison Underlying functional structure
Level of standardization
Standardization of skills
Horizontal communication system
Control and follow up
Organizational culture
Organizational hierarchy
Ability to follow up
Motivation
Level of coordination
Direct supervision
Underlying market based structure
Decision making
Level of automated work
Level of monitorability
Information relevance
Distance decision maker & process
Performance data
Standardization of processes
Standardization of output
Vertical communication system Work flow system
Automation system
Fig. 7 An EID combining the business values, organizational variables and IT systems.
4 Organizational theory We purport to describe the entire causal chain from decision variables in the form of IT systems, via a probabilistically modeled organizational structure to the business values sought. Following Mintzberg, this description is split into (i) design of positions, (ii) design of superstructure, and (iii) design of lateral linkages. 4.1 Design of positions As defined by Mintzberg, the design of positions within an organization determines (i) the level of specialization of work tasks, (ii) the formalization of behavior, and (iii) the training and indoctrination of workers. Work can be specialized both horizontally and vertically. The horizontal specialization separates work tasks that are of different character from each other. Horizontal specialization is used to increase productivity by streamlining work tasks and lowering switching costs between different tasks. Vertical specialization, on the other hand, is defined as separating “the performance of the work from the administration of it” [8]. The level of horizontally specialized work, in the form of automation, is modeled as one of several factors supporting effectiveness in Fig. 8.
This aspect of specialization clearly connects to the business values of effectiveness and efficiency. Roughly, horizontal specialization increases effectiveness, while vertical specialization increases efficiency. As depicted in Fig. 8, however, the dependencies actually modeled are more complex.
Fig. 8 An EID describing relations between quantities related to design of positions An organization can formalize the behavior of the workers through standardization of the output of the processes or by regulating the work flows. The organization could also use formalization by rules, regulating the limits of the work. This is reflected in Fig. 8 where a certain overall level of standardization can be achieved either through the standardization of skills, standardization of processes, or through standardization of output. Mintzberg does not make any distinction between the three ways of achieving a high level of standardization, which leads to dominance factors of the same size. Discussing the standardization of skills, Mintzberg makes the distinction between training and indoctrination. Training refers to the learning of job related skills and knowledge, while indoctrination refers to the internalization of organizational norms. Mintzberg suggests that training and indoctrinations are substitutes: most organizations put more emphasis on either the one or the other. In Fig. 8, these aspects are modeled by having internal training programs and recruiting based on relevant education influence the standardization of skills. A third aspect can make skills more standardized, and that is an IT system that horizontally can spread knowledge. These three aspects are of equal weight, but to achieve full standardization of skills, all of these strategies must be used. Standardization of output can be achieved either by having a process specification describing the output in detail or if the process itself creates a standardized output, as it will if it is automated by an automation system. An automation system is the most dominant factor here. This is visualized in Fig. 8. Standardization of processes follows the same argument as standardization of output; a specification for the process affects the standardization, while the
automation of the process is the most dominant aspect. If the process is supported by an IT system with work flow functionality, this will also enhance the standardization of the process. 4.2
Design of superstructure
The superstructure of an organization describes the highest level of its organization diagram; the grouping and size of the constituent units. Two major types of organizational grouping can be distinguished; viz. (i) grouping by function and (ii) market based grouping. Now, functional grouping is more common when there are significant interdependencies of process and scale, and where standardization works well. Functional grouping allows the functions (e.g. marketing, production, and sales) to develop their very own specialized and streamlined procedures, to benefit as much as possible from the division of labor. Market based grouping, on the other hand, is more common when there are significant interdependencies of workflow, and where standardization works poorly. Market based grouping puts emphasis on processes and work flow, trading cross-functional integration for less specialization. The well-known matrix organization attempts to combine the desirable features of both types of grouping. Such co-existing structure is the rationale for the modeling of Fig. 9, where the market based and functional structures are each separated into (i) an underlying structure and (ii) a resulting, observable, structure. While the model allows at most one of the underlying structures to exist at a given time, the other one can get its state raised through the level of liaison. Thus, a high level of liaison will raise the value assigned to the structure not assumed by the underlying structure, i.e. the underlying structure is more dominant then the level of liaison. If both Market based and Functional structures assume high values we have a matrix organization. Roughly, market based grouping leads to higher efficiency while functional grouping leads to higher effectiveness and flexibility. The connection to these business values is modeled by the causal relations in Fig. 9.
Fig. 9. An EID describing relations between quantities related to the design of superstructure Mintzberg distinguishes three different basic means of achieving coordination: (i) mutual adjustment, (ii) direct supervision, and (iii) standardization. This is
reflected by the weighted relations between these concepts with respect to coordination, as illustrated in Fig. 10. Coordination supports the business value of having a favorable organizational structure. By what means coordination supports the organizational structure is determined by the state of the coordination node.
Fig. 10 An EID describing relations between quantities related to coordination
The next parameter relevant to organizational superstructure is the size of units. According to Mintzberg, the primary factor governing feasible unit sizes is the mechanism of coordination employed by the organization. Whenever standardization is used as a means of coordination, the need for supervision decreases and the ability of a single manager to keep track of a larger group of subordinates increases. If direct supervision is used, on the other hand, group sizes cannot grow very large, as is reflected in Fig. 10 where unit size has a unary relation to the level of direct supervision. Mutual adjustment, direct supervision and level of standardization are of equally weights with respect to coordination. 4.3
Design of lateral linkages
Two sorts of lateral linkages within an organization are discussed by Mintzberg; (i) liaison devices and (ii) planning and control systems. Liaison devices, that interconnect distant parts of an organization, are common in modern organizational structures. Their basic rationale is the coordination of complex, interdependent activities. Mintzberg identifies a number of liaison devices that characterizes the spectrum between a purely functional and a purely market oriented organization. Using (i) liaison officers, (ii) task forces or standing committees, and (iii) integrating managers, functional and market based organizations can be blended. The most radical liaison measure is the introduction of the matrix organization, which fully does away with unity of command. All these measures are reflected in Fig. 11, together with the existence of a horizontal communication system which is of a significantly larger weight then the other factors. Performance control is a tool for management to measure the results of a unit, but also a tool that gives feedback to the unit. Some such qualities, taken from Mintzberg, are reflected in Fig. 11, where they are connected to the business values of decision making, control and follow up and organizational culture. The two first are intuitive, and the third business
value is achieved through higher motivation of employees who get feedback on how well they meet goals according to Mintzberg [8].
Fig. 11. An EID describing relations between quantities related to level of liaison
The hierarchy of the organization is here described as the relation between number of levels, and maximum number of divisions in organigram, i.e. the relation between its height and width. If the ratio is more than one the hierarchy is set to High, otherwise the value is set as Low. This since Mintzberg claims that an organization profits more when it comes to Decision making if the organizational formation is wide [8].
Fig. 12. An EID describing relations between quantities related to planning and control
5
Discussion
This paper presents a framework for assessing how IT affects organizations and thus creates business value. The framework is expressed in a quantitative manner to form a foundation for empirical studies. The CPTs in the paper are, at the present state, subjectively defined by the authors as a reflection of our interpretation of Mintzberg’s organizational theory. However, the use of Bayesian networks allows the CPTs to be updated in a non-arbitrary fashion, using well known learning algorithms. Therefore, case studies and other empirical work can be readily integrated into the framework, thus converging on an ever more precise representation of reality. Following the quantification given in the present paper, some future directions on the road towards a fully applicable tool for business value assessments can be given.
One important goal is the construction of an abstract model/meta-model from which concrete and empirical instantiations can be formed. Furthermore, attention should be drawn to the scales on which empirical data is measured. The latter of these tasks can be seen as implied by the former, i.e. in order to form a domain-specific instantiation the scales have to be considered explicitly. It should be clear, for instance, that the percentage of processes regulated by documents might affect the corresponding business values differently depending on the sort of business conducted within the studied organization.
6
Conclusions
We have seen that the business values of IT can be derived through analysis of the impact IT has on an organization. Using the qualitative framework from [12] as a foundation a quantitative equivalent was constructed by means of defining conditional probability tables, CPTs for all nodes having one or more parent nodes. Three important modeling aspects were identified and expressed in the form of CPTs; incompleteness, weighting and dominance. By modeling the impact IT has on business value through its organizational impact using Extended Influence Diagrams we have created a platform for quantitative assessments of business value, i.e. the platform enables an investigator to be presented a discrete value on a predefined scale representing the organization’s overall fulfillment of the modeled business values. Now, having developed a quantified version of the framework we are one step closer to a complete assessment tool for business value studies. The quantification enables that the framework now can be employed empirically, which in turns enables trimming of the determined CPTs through Bayesian learning algorithms.
References 1. Brynjolfsson, B.: The Productivity Paradox of Information Technology, Communications of the ACM Vol.36, No.1 p 67--77 (1993) 2. Bergsjö D., Malvius D.: A Model to Evaluate Efficiency, Quality, and Innovation through User Satisfaction with Information Management Systems” in Proceedings of CSER 2007, March 14-16, Hoboken (2007) 3. Sneller L., Bots J.: A Review of Quantitative IT Value Research. Nyenrode Business University, The Netherlands (2006) 4. Dahlgren J.: Real options and Flexibility in Organizational Design. In Proceedings of CSER 2007 , March 14 -16, Hoboken (2007) 5. Fulk J., DeSanctis G.: Electronic Communication and Changing Organizational Forms. Organization Science, Vol. 6, No. 4. pp. 337--349 (1995) 6. Andersen T.J.: Information technology, strategic decision making approaches and organizational performance in different industrial settings. The Journal of Strategic Information Systems, Volume 10, Issue 2, pp. 101--119 (2001) 7. Gurbaxani V., Whang S.: The impact of information systems on organizations and markets, Communications of the ACM, Volume 34, Issue 1 pp. 59 -- 73 (1991)
8. Mintzberg H.: The Structuring of Organizations. Prentice-Hall, Upper Saddle River, New Jersey (1979). 9. Shafer, G. (1976). A mathematical theory of evidence. Princeton, NJ: Princeton University Press. 10.Yang, J.-B. (2001). Rule and utility based evidential reasoning approach for multiattribute decision analysis under uncertainties. European Journal of Operational Research, 133, 31– 61. 11.Yu, E. S. K., Mylopoulos, J., & Lesp, Y. (1996). Ai models for business process reengineering. IEEE Expert: Intelligent Systems and Their Applications, 11(4), 16–23. 12.Gustafsson P., Franke U., Johnson P., Lilliesköld J.: Identifying IT impacts on organizational structure and business value. In Proceedings of the Third International Workshop on Business/IT Alignment and Interoperability, pp. 44-57 (2008) 13.Johnson P., Lagerström R., Närman, P., Simonsson, M.: Enterprise Architecture Analysis with Extended Influence Diagrams. Information System Frontiers. Vol 9(2-3), 163 --180 (2007) 14.M. Henrion. Some practical issues in constructing belief networks. In L. N. Kanal, T. S. Levitt, and J. F. Lemmer, editors, Uncertainty in Artificial Intelligence 3, pages 161--173. Elsevier Science Publishers B.V., North Holland, 1989. 15.J. Pearl. Fusion, propagation and structuring in belief networks. Artificial Intelligence, 29:241-- 288, 1986. 16.Katz, D., Kahn, RL.: Organizations and the system concept - Classics of Organization
Theory, Thomson Learning 1966. 17.Hannan, MT., Freeman, J.: The Population Ecology of Organizations - American
Journal of Sociology, Chicago Press 1977 18.Martin, J. (1990). Deconstructing organizational taboos: The suppression of gender
conflict in organizations. Organization Science, 1: 339-359. 19.Shachter, R.: Evaluating influence diagrams. Operations Research. Institute for Operations Research and the Management Sciences. 34 (6), 871--882. (1986) 20.Shachter, R.: Probabilistic inference and influence diagrams. Operations Research, 36 (4), 36--40. (1988) 21.Neapolitan R.: Learning Bayesian Networks. Prentice-Hall, Inc. Upper Saddle River, New Jersey, USA (2003) 22.Jensen F. V.: Bayesian Networks and Decision Graphs. Springer New York, Secaucus, New Jersey, USA. (2001) 23.Lagerström, R., Johnson, P., Närman, P.: Extended Influence Diagram Generation. Enterprise Interoperability II – New Challenges and Approaches, pp. 599--602. Springer, London (2007) 24.Druzdzel M., van der Gaag, L.: Building probabilistic networks: Where do the numbers come from? IEEE Transactions on knowledge and data engineering, Vol. 12, No. 4, IEEE, Los Angeles, USA, , pp. 289 -- 299 (2000) 25.Keeney R., von Winterfeldt, D.: Eliciting Probabilities from Experts in Complex Technical Problems. IEEE Transactions on engineering management Vol 38, No 3, IEEE, pp. 191-201 (1991) 26.Thomas L. Saaty: Axiomatic Foundation of the Analytic Hierarchy Process, Management Science, Vol. 32, No. 7. (Jul., 1986), pp. 841-855. 27.Laurene V. Fausett, Fundamentals of Neural Networks, Prentice Hall, 1994. 28.Gammelgård, M., Ekstedt, M., Gustafsson, P.: A Categorization of Benefits From IS/IT Investments. In proceedings of the 13th European Conference on Information Technology Evaluation, ECITE (2006) 29.Farbey B., Land, F., Targett, D.: How to assess your IT investment: A study of methods and practice. Butterworth-Heineman Ltd, Oxford (1993)