Quantifying Load Imbalance on Virtualized Enterprise Servers Emmanuel Arzuaga
David R. Kaeli
Department of Electrical and Computer Engineering Northeastern University, Boston, MA
Department of Electrical and Computer Engineering Northeastern University, Boston, MA
[email protected]
[email protected]
ABSTRACT
1. INTRODUCTION
Virtualization has been shown to be an attractive path to increase overall system resource utilization. The use of live virtual machine (VM) migration has enabled more effective sharing of system resources across multiple physical servers, resulting in an increase in overall performance. Live VM migration can be used to load balance virtualized clusters. To drive live migration, we need to be able to measure the current load imbalance. Further, we also need to accurately predict the resulting load imbalance produced by any migration. In this paper we present a new metric that captures the load of the physical servers and is a function of the resident VMs. This metric will be used to measure load imbalance and construct a load-balancing VM migration framework. The algorithm for balancing the load of virtualized enterprise servers follows a greedy approach, inductively predicting which VM migration will yield the greatest improvement of the imbalance metric in a particular step. We compare our algorithm to the leading commercially available load balancing solution - VMware’s Distributed Resource Scheduler (DRS). Our results show that when we are able to accurately measure system imbalance, we can also predict future system state. We find that we can outperform DRS and improve performance up to 5%. Our results show that our approach does not impose additional performance impact and is comparable to the virtual machine monitor overhead.
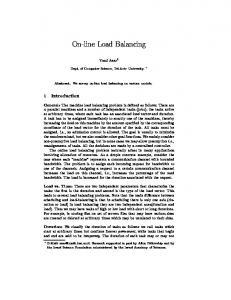
Virtualization technologies have a rich history, dating back to the 1960s with IBM’s System/360 and 370 [5]. Current commercial solutions are dominated by VMware ESX Server [19], Microsoft Hyper-V [12] and Sun xVM [16]. Other popular virtualization platforms include Citrix XenSource [2] and Xen – both of these provide open source solutions. There are open source versions of xVM as well. Server virtualization is currently used to consolidate loads [7], enhance the utilization of physical systems [1] and provide a level of isolation and security for applications [23]. This has opened the door for the use of virtual machines in clusters of physical systems. However, in order to better utilize the resources in these systems, it is necessary to have the ability to dynamically allocate resources to the running VMs. Figure 1 depicts such a scheme. VM2 is being migrated from Physical Server1 to Physical Server2 by the Virtualization Manager. The Virtualization Manager selects which VM to migrate based on an imbalance measurement. Notice that while the migration is taking place, the VM is completely functional, hence the term live migration. Dynamic migration of virtual machines maximizes the utilization of system resources by balancing server loads [4, 13]. In order to guarantee good system performance, it is very important to place VMs in physical hosts that are underutilized (rather than overloading part of the system). In this paper we study the effects of Dynamic Resource Allocation via live VM migration on virtualized enterprise servers. To evaluate our algorithms, we run online transaction processing (OLTP) workloads based on the TPC-C benchmark [17]. We present an imbalance metric based on the variation in load measured on the physical servers. This metric is the input to our VM migration algorithm. It is critical for the metric to accurately predict future system state. We have developed a greedy algorithm for VM migration, choosing the VM movement that obtains the greatest improvement in the imbalance metric at a particular step. The main contributions of our work are:
Categories and Subject Descriptors D.4 [Operating Systems]: Performance
General Terms Experimentation,Measurement, Performance
Keywords Virtualization, Dynamic Resource Allocation, VM Migration
1. we present a metric that captures the load of a virtualized enterprise server based on its current resident VMs,
Permission to make digital or hard copies of all or part of this work for personal or classroom use is granted without fee provided that copies are not made or distributed for profit or commercial advantage and that copies bear this notice and the full citation on the first page. To copy otherwise, to republish, to post on servers or to redistribute to lists, requires prior specific permission and/or a fee. WOSP/SIPEW’10, January 28–30, 2010, San Jose, California, USA. Copyright 2010 ACM 978-1-60558-563-5/10/01 ...$10.00.
2. we demonstrate how the server load metric can drive a load balancing VM migration algorithm and can also be used to predict future server state, and 3. we provide an open source Dynamic Resource Allocation Framework for VMs that is an alternative to commercial products such as VMware’s DRS.
235
2.2 Virtualized Server Load For the purpose of defining such a metric, let S be the set of physical servers and V M Host be the set of virtual machines currently running on physical server Host, (Host ∈ S). Then, the Virtualized Server Load (V SLHost ) can be expressed as:
V SLHost =
X
Wresource ×
vresource usage
v∈V M Host
resource
Hostresourcecapacity
,
(1) where resource ∈ {CP U, memory, disk} and Wresource is a weight associated with each resource. Note that this load measure has no units and starts at 0 when the VMs resource usage is zero. The maximum value depends on the assigned weight values (Wresource) in the case when the VMs consume all of the available resource. V SLHost varies dynamically, depending on the VMs running on the physical system (Host). This fact makes it suitable for a range of system characteristics such as a load balancing metric.
Figure 1: Live VM Migration Process.
VMware DRS [18] is the commercial application that performs dynamic resource allocation in VMware Virtual Center (VC). It monitors overall system behavior and migrates VMs to balance the load by issuing VMotion commands. As it is a commercial product, there is limited information available on DRS internals. However, available documentation shows that it uses some form of per-resource imbalance using their concept of VM shares and entitlements and produces a metric based on the standard deviation of the per-resource imbalance values of the system. The rest of this paper is organized as follows. In Section 2 we provide a definition of the Virtualized Server Load (VSL) in a physical server as a function of the VMs running on it. Section 3 presents our imbalance metric and the VSL Inductive Balancing Method (VIBM). Section 4 discusses the characteristics of the OLTP workload and the physical system used. Results of our experiments are presented and analyzed in Section 5. Section 6 discusses related work and Section 7 presents conclusions and areas for future work.
2.
P
3. MAINTAINING A BALANCED SYSTEM 3.1 Load Imbalance Metric
QUANTIFYING SERVER LOAD
2.1 Desirable Properties of a Virtualized Server Load Metric A common approach for quantifying physical server load is to measure the utilization of its resources (e.g., CPU time, memory utilization, network and disk I/O traffic). Virtualization introduces another layer of abstraction on top of a physical server – virtual machines only know about virtualized hardware resources, while the hypervisor manages both virtual and physical hardware resources. As a result, it becomes more challenging to balance performance in terms of per-VM utilization of system resources given this added layer of abstraction. Working at the hypervisor level allows us to isolate each VMs’ virtual and physical resource consumption and enables us to isolate the resource consumption of a particular VM when making predictions on the overall system balance. Another desirable property of a virtualized server load metric is that it can be used on heterogeneous systems. Realworld cluster systems are rarely homogeneous, so in order for this metric to apply to a variety of system configurations, we need to quantify the load of a server in a manner that does not depend on fixed resource units. A unitless metric allows the direct comparison of different servers in the system regardless of their internal components.
Load balancing has been one of the most important techniques used to improve resource utilization and system performance in parallel and distributed systems. Although previous work has focused on specific balancing algorithms [15, 21, 22], it is difficult to directly apply them to virtualized servers. Additionally, we need to take into consideration the impact that the virtualization layer imposes on system resources. The virtualization layer can signficantly change the known behavior of a workload running on a physical system. A typical imbalance metric based on the resource utilization of physical servers is the standard deviation of the CPU utilization [21]. The reasoning behind this metric is that if the server loads are evenly distributed, the standard deviation will be small. The smaller this metric, the greater the load balance in the system. Although CPU utilization is generally a good predictor of system performance, the use of such a metric for load balancing does not take into consideration memory, network or disk I/O performance. In the case of a more complex workload such as VMs running commercial workloads, relying only on CPU information may lead to undesireable results. In the previous section, we defined a server load metric that is a function of VM resource usage. This metric considers information specific to each VM when quantifying the load of a particular physical server. This metric takes into consideration the usage of multiple resources by the VMs resident on the system. Based on this definition, we can generate a load set L that contains the V SL values corresponding to all physical servers (∀ physical servers ∈ S). The desired system imbalance metric can then be defined in terms of the coefficient of variation of L: CL =
σL µL
(2)
As shown, CL is defined as the ratio of the standard deviation σL over the mean µL . The coefficient of variation CL is used in many areas of computer science including queueing
236
theory [8]. This metric captures the dispersion of the values assumed by a variable in a way that does not depend on the measurement unit. The higher the CL , the greater the variation in the measured values. Note that this metric will give us a tighter bound than using only the standard deviation. For example, if we use CL to predict future system state after migrating a set of VMs, the metric accounts for the migration set that not only reduces σL , but that recognizes changes in µL as well. However, there are some problems that must be taken into consideration when using the CL as an imbalance metric. The most evident problem is in cases where µL is zero. For these cases, CL will be undefined. Similar problems may occur if the V SL returns non-positive values. This is not an issue for our V SL metric, as long as we use positive values in Wresource . Thus, the only part we need to worry about is the case where µL becomes zero. The only time this could happen is when all servers are idle or when the virtual machine monitor (VMM) is not consuming any resources. Although these cases are extremely rare, in order to avoid this problem, we define our imbalance metric as:
IM etric :
(
0, if no VMs are active CL , otherwise
Algorithm 1: VIBM IM etric ←− CL while IM etric ≥ threshold do src ←− host ∈ S : V SLhost = Max(L) for vcandidate ∈ V Msrc do for (target ∈ S) 6= src do predict benefit of migrating vcandidate to target compute Lcandidate Lcandidate :
8 > :V
SLtarget ←− V SLtarget + vcandidate SLsrc ←− V SLsrc − vcandidate
insert (vcandidate , src, target, Lcandidate ) to Candidates end end select candidate from Candidates : Min(CLcandidate ) IM etricP REDICT ED ←− CLcandidate if IM etricP REDICT ED < IM etric then promote candidate to migrate IM etric ←− IM etricP REDICT ED else do not promote candidate end end
(3)
Figure 2 shows the behavior of this metric for different throughput values of a virtualized system running an online transaction processing OLTP workload. As seen, this metric captures the variability of V SL across all hosts in S and reducing this metric produces a load-balanced set of servers that provides a higher system throughput. In this work the weight values (Wresource) in Equation 1 are assumed to be equal. Following work will analyze the potential of tuning such values to improve or change the migration criteria.
classic NP-Hard problems. We present a heuristic solution that follows a greedy approach by inductively selecting the VM migration that will yield the greatest improvement of the imbalance metric at its present state. This greedy local approach guarantees that we will seek migrations that minimize the value of the IM etric over the current running interval of the system. We have named this approach the VSL Inductive Balancing Method (VIBM). The method is presented in Algorithm 1. The VIBM algorithm starts by determining that the system is unbalanced, that is, if IM etric is greater than some threshold value. Whenever it is over threshold, VIBM looks for migration candidates. The first step in this search is to select the physical system with the highest V SL as the source host to select migration candidates from. VIBM then computes a prediction of the new IM etric by applying the candidate migration to the corresponding target physical system load (V SLtarget ) and subtracts it from the load of the source server (V SLsrc ). The vcandidate migration that provides the smallest CLcandidate value will be selected for promotion. If the IM etricP REDICT ED is below the current system IM etric , the candidate gets promoted, otherwise the system is unchanged. The VIBM migration handler is notified of the promoted vcandidate and is in charge of performing the corresponding migrations.
Figure 2: CL as a function of throughput in Transactions-per-Minute (TpM). For lower CL values there are higher TpM values.
4. EXPERIMENTAL SETUP
3.2 Virtualized Server Load Inductive Balancing Method
4.1 Workload Characteristics Our experiments present results from running a simple CPU-intensive microbenchmark and an OLTP workload. The CPU-intensive workload issues simple integer operations similar to the Dhrystone benchmark [20]. It is used to show the
Based on IM etric , we can start to design a method for balancing server load. The general problem of dynamically allocating VMs to physical servers has been shown to be similar to bin-packing [7] or knapsack [14] problems, both
237
accuracy of VIBM to predict system state. The OLTP workload is used for performance tests. It is implemented based on the TPC-C specification [17], which models an online wholesale supplier managing orders. Order-entry provides a conceptual model for the benchmark, with the underlying components being typical of any OLTP system. Table 1 shows the five transaction types and their read/write characteristics. The transactions operate against a relational database composed of 9 tables. Transactions generate reads, writes, and rollbacks. The application uses primary and secondary key access. Our OLTP workload consists of warehouses, each containing 10 terminals, as outlined in the TPC-C specification. The terminal interface consists of a Linux terminal that displays information about the current transaction being performed. Table 1: OLTP Transactions Transaction New-order Payment Delivery Order-status Stock-level
Access Pattern read/write read/write read/write read read
Figure 3: Experimental System. rent VIBM migration handler uses this API, there are other VM Hypervisors that provide the capability of extracting the same information. In particular, the Xen hypervisor provides a set of profiling tools and an API that is robust enough to provide the same information to the VIBM migration handler [3, 6, 11]. Thus, the VIBM migration handler can be reconfigured to use those other hypervisors with minor changes. This is a robustness that DRS lacks because of being an built in feature of VC. Our experiments are designed to compare the effectiveness of our improved imbalance metric IM etric . We present results for three different migration policies: no migrations, VMware DRS and VIBM. VIBM results will be compared to those of DRS when configured with an aggressive migration setting. Running with this configuration, DRS makes recommendations even if the suggested migration only provides a slight improvement in the overall system balance. We want DRS to be as aggressive as possible to provide a very competitive baseline. The VIBM migration handler will be in charge of monitoring the whole system and proposing load balancing solutions. Our implementation of the VIBM migration handler allows the selection of the type of migration scheme that will be performed during the workload analysis. In this way, we can compute the predicted IM etric associated with each migration scheme to understand and evaluate its overall behavior.
4.2 Used System The experimental setup for testing our imbalance metric and VM migration algorithms is shown in Figure 3. It consists of three physical servers using VMware’s Virtual Infrastructure (VI) version 3. One of the ESX servers services storage I/O over an iSCSI shared SAN to the other two physical systems. The two ESX servers sharing the SAN constitute the system under test. The servers have two 2.33 GHz Intel Xeon EM64T dual-core processors with a 4GB memory configuration sharing a 700GB iSCSI SAN. The iSCSI SAN is supported by an EMC CLARiiON CX300 storage array via fibre channel. The fibre channel connection is made through a McData Sphereon 1440 fibre channel switch. The server has a dedicated LUN of 1 TB, consisting of 7 HDDs with a RAID 5 configuration. The ESX servers have shared access to 700GB of this LUN. The VM files are stored on this storage system. As Figure 3 shows, both ESX servers are administrated by VMware’s VC Server. The VIBM migration handler framework attaches to the VC server using the VMware VI SDK for Perl. The VI SDK is an API that allows the extraction of performance information from a cluster of ESX servers administered by VC. It also enables the scripting of system administration activities such as turning on/off VMs, collecting ESX server performance statistics, as well as invoking VMotion to migrate VMs. The VIBM migration handler connects to VC and calculates the Virtualized Server Loads (V SLS ) for each physical host. After generating the V SLS , it computes the actual IM etric for the system. If the system is unbalanced, it triggers the VIBM algorithm and attempts to balance the system load accordingly, issuing VMotion calls with the selected migrations. The main reason for choosing the VMware VI API for the implementation of the VIBM migration handler prototype is the presence of an available commercial product in VC that could be used as a baseline to evaluate the effectiveness of our VIBM framework (DRS). Even though the cur-
Table 2: VM sizes and names Large VM VM1 VM2 VM3
Small VM VM4 VM5 VM6 VM7 VM8
The evaluated system contains 8 VMs, using two different sizes (in terms of virtual resources; CPUs and memory), as shown in Figure 3. The larger VM configuration consists of two virtual CPUs and 1GB of main memory. The smaller VM has one virtual CPU and 512MB of main memory. Both
238
VM configurations have 50GB virtual hard disks. Table 2 shows the VM names and sizes. The following sections will explain in more detail our experiments.
5.
VIBM RESULTS
5.1 IM etric Analysis 5.1.1 Predicting System State In order to test the utility of VIBM to increase overall system balance, we ran two sets of tests. The first configured 6 VMs, 2 large VMs and 4 small. This experiment tested what the system balance improvements would be if we added an idle system to our cluster. For this particular test, we used the initial placement of the 6 VMs as shown in Table 3. A CPU-intensive workload was run on each VM. The VIBM algorithm migrated VM1 to ESX 2 in the first iteration, VM4 in the second iteration and VM6 in the third. After making those changes, the IM etric of the system was reduced by more than 40%. Figure 4 shows the results. As we can see, each migration resulted in an improvement in the overall system IM etric value. We can also see that the actual state is very close to the state predicted by the VIBM algorithm, with errors ranging from 0-3.6%.
Figure 4: Accuracy of IM etric prediction for a set of VIBM migrations.
and system performance. To study this question, we use the OLTP workload. Two sets of experiments are designed using the initial placement configurations of 6 VMs and 8 VMs discussed earlier. The workload parameters used in our OLTP implementations vary based on the size of the VMs used, as shown in Table 4. We begin by letting the system warm-up for 25 minutes prior to starting the VM migration routines. After this warm-up period, the system runs for one hour while the VM migration handler is migrating VMs following either DRS or VIBM recommendations. These results are also compared to a no-migration scheme. Table 5 shows the average IM etric value and the average transaction throughput obtained for the 6 VM and 8 VM performance tests. As we can see, a high IM etric value corresponds to a lower transaction throughput and vice-versa. From the previous results we can see that by minimizing IM etric we can potentially achieve higher throughput. Figure 6 shows the behavior of IM etric for the 6 VM (a) and 8 VM (b) experiments. We can see that VIBM produces the lower IM etric values throughout the workload execution. By observing the results in Table 5 and Figure 6, we can see that VIBM provides a greater reduction in the IM etric and hence obtains better performance. Figure 7 presents results running the OLTP workload. Normalized throughput numbers are presented, computed by recording the number of new order transactions per minute (TpM), divided by the global maximum number possible obtained by running single runs of small and large VMs without any resource contention, and linearly scaling those values to the configuration used in the experiment. In the 6 VM experiment, VIBM obtains a 3% increase in performance when compared to DRS. The 8 VM results show a larger difference between the two methods, with a consistent performance advantage for VIBM of 5% over DRS. As we can see in both cases, VIBM produced the best total throughput, obtaining the same transaction throughput as the single run results. The main reason for such high performance numbers is that the bottleneck in the system is the iSCSI SAN. Any other latencies are hidden by the latency of the storage system. Given that this effect is equal in each scheme, the results give us confidence that using VIBM introduces little over-
Table 3: Initial VM placement Experiments 6 VMs
8 VMs
ESX 1 VM1 VM2 VM4 VM5 VM6 VM7 VM1 VM2 VM4 VM5 VM6 VM7
ESX 2 idle
VM3 VM8
The second test consisted of comparing the VIBM migration pattern with that of VMware’s DRS. For this experiment we used the CPU-intensive workload and the 6 VM system configuration. We made separate runs of the VIBM migration handler configured to use DRS and VIBM. Figure 5 compares the results of the recommendations provided by VIBM versus those offered by DRS. The VIBM algorithm elects to migrate VM1 to ESX 2 in the first iteration and then migrates VM4 in the second iteration. After that, the system is well-balanced, reducing the IM etric by more than 60%. DRS, on the other hand, suggests different movements for this workload. DRS moves VM2 to ESX2 which results in an improvement of close to 37% in the IM etric . Figure 5 also shows the accuracy of the predicted IM etric when either DRS or VIBM is used to find the next migration, and compares this prediction to the actual value after the migration has taken place. As we can see, the predicted values are within 2.8 and 2.9% of the actual values. These results suggest that IM etric is a good metric in terms of predicting future system behavior after a move.
5.2 VIBM-DRS Comparison Now that we have shown that IM etric is very accurate in terms of predicting future system states, we also want to compare VIBM to DRS in terms of performance. For this purpose, we focus on the relationship between IM etric
239
0.8
0.8
VIBM DRS Actual
0.7
0.7
0.6
Imbalance Metric
Imbalance Metric
0.6
0.5
0.4
0.5
0.4
0.3
0.3
0.2
0.2
0.1
VIBM DRS Actual
0
1
0.1
2
VM Migrations
(a)
0
1
VM Migrations
2
(b)
Figure 5: Comparing the accuracy of IM etric prediction following different migration recommendations: DRS (a) and VIBM (b). Notice how VIBM selects the migrations that better reduce IM etric . that keeps records of previous migrations and proposes new migrations following the observed behavior of the system. They use User-Mode Linux (UML) VMs. Their approach is similar to ours for developing an imbalance metric, but only considers the standard deviation of CPU resources. Their results show that their learning approach tends to obtain better results than a pure threshold-based scheme. However, these results are heavily dependent on the imbalance metric used. Since they chose to use the standard deviation of CPU utilization, they cannot characterize the true spread of values captured by IM etric . Park et al. [14] propose a self-managing solution that takes into consideration application service level objectives (SLOs), and an optimization model based on linear programming (LP), specifically a Branch-and-Bound solution to the Binary Multiple Knapsack Problem [10]. They propose an optimal solution to their problem based on the implemented cost function applied to each VM. However, they mention as a limitation the fact that their approach can produce migration cycles in which a heavily used server migrates a VM continuously because it unstabilizes the system on each migration. Our method avoids this problem by migration throttling if the predicted IM etric is greater than or equal to the current value. Kochut and Beaty [9] developed an analytical model of virtual machine migration that provides estimates of the expected gain in response time due to the selected migration. The model is based on queueing theory [8] and takes into consideration the characteristics of a virtualized environment such as migration cost and overhead. They present simulations using data center CPU resource utilization traces. They assume that the physical servers follow an M/M/1 queue behavior to derive the response time equations for the system. The migrations are performed by selecting the one that minimizes the response time of the system. The work most similar to ours is by Khanna et al. [7], which targets application performance management. Their work introduces the concept of server consolidation, where
head and is comparable to the overhead that VirtualCenter already introduces. Table 4: VM OLTP workload description
Large VM Small VM
Warehouse Number 5 2
Number of Terminals 50 20
Table 5: IM etric and Throughput Relation Migration Method No Migrations DRS VIBM
6.
6 VMs IM etric TpM 0.99 128.98 0.81 133.96 0.70 149.10
8 VMs IM etric TpM 0.89 174.63 0.71 193.20 0.61 203.52
RELATED WORK
Our work implements a VM migration framework based on a new imbalance metric. We are interested in using this framework to evaluate how well V SL increases workload throughput. The study of VM Migration through Virtualized Server Environments has gained popularity, as VM technology emerges as one of the most commonly deployed solutions for server consolidation. Most previous work on VM migration has focused on dynamic resource management. However, these techniques are oriented towards managing individual system virtualized resources. Choi et al. [1] proposed an autonomous learning method for threshold-based VM migration. In their work, they focus on dynamically changing the migration thresholds. They base their approach on a migration history log
240
DRS
VIBM
No Migrations 1.3
1.2
1.2
1.1
1.1
Imbalance Metric
Imbalance Metric
VIBM 1.3
1
0.9
0.8
0.9
0.8
0.7
0.6
0.6
1
2
3
4
5
TIME
6
7
8
9
10
(a)
No Migrations
1
0.7
0.5
DRS
0.5
1
2
3
4
5
TIME
6
7
8
9
10
(b)
Figure 6: A comparison of IM etric values over time per used method for: (a) 6 VM, and (b) 8 VM experiments. VIBM obtains the lowest average IM etric for both experiments.
Normalized Throughput (TpM)
1.000
0.800
0.600
0.400
0.200
0.000
11 00 00 0 1 00No Migrations 11 11 00DRS 11 0VIBM 1 1111 0000 111 1111 000 0000 111 000 1111 0000 000 111 0000 1111 111 000 000 111 1111 0000 1111 0000 111 1111 000 0000 111 000 111 000 1111 0000 1111 0000 111 1111 000 0000 000 111 111 000 1111 0000 0000 1111 111 1111 000 0000 111 000 111 000 1111 0000 1111 0000 000 111 0000 1111 111 000 000 111 1111 0000 1111 0000 111 1111 000 0000 111 000 111 000 1111 0000 1111 0000 111 1111 000 0000 000 111 111 000 1111 0000 0000 1111 111 1111 000 0000 111 000 111 000 1111 0000 1111 0000 000 111 0000 1111 111 000 000 111 1111 0000 1111 0000 111 1111 000 0000 111 000 111 000 1111 0000 1111 0000 111 1111 000 0000 000 111 111 000 1111 0000 0000 1111 111 1111 000 0000 111 000 111 000 1111 0000 1111 0000 111 1111 000 0000 111 000 111 000 1111 0000 1111 0000 000 111 0000 1111 000 111 000 111 1111 0000 0000 1111 111 1111 000 0000 111 000 111 000 1111 0000 1111 0000 111 1111 000 0000 111 000 111 000 1111 0000 1111 0000 111 1111 000 0000 000 111 111 000 1111 0000 0000 1111 111 1111 000 0000 111 000 111 000 1111 0000 1111 0000 000 111 0000 1111 111 000 000 111 1111 0000 1111 0000 111 1111 000 0000 111 000 111 000 1111 0000 1111 0000 111 1111 000 0000 111 000 111 000 1111 0000 1111 0000 000 111 0000 1111 000 111 000 111 1111 0000 0000 1111 111 1111 000 0000 111 000 111 000 1111 0000 1111 0000 111 1111 000 0000 111 000 111 000 1111 0000 1111 0000 111 1111 000 0000 111 000 111 000 1111 0000 1111 0000 111 1111 000 0000 111 000 111 000 1111 0000 1111 0000 6−VM
metric that is based on the current resident VM resource usage named V SL. We also described a new imbalance metric that is based on the variation in load present on the physical servers. Our new imbalance metric was shown to provide predictions of future system behavior with high fidelity (i.e., with an error margin of less than 5%). This new imbalance metric was used to drive our new load balancing method (VIBM) on a virtualized enterprise server. VIBM implements a greedy approach, selecting the VM migration that yields the most improvement of the imbalance metric at each time step. VIBM was implemented using the VMware VI SDK for Perl. The VIBM migration handler is an open source solution that interacts with VMware’s VirtualCenter Server to migrate VMs between the managed ESX hosts. Our new algorithm was compared to VMware DRS – VIBM produced a VM migration pattern that reduced the overall imbalance metric. Our results showed that by accurately predicting the imbalance metric to guide VM migration can result in higher workload throughput, increasing performance by 2-5% over VMware’s DRS. In future work we plan to enhance the VIBM algorithm by considering migration cost estimates. We will also study how typical quality-of-service measures associated with commercial virtualization systems, such as shares and entitlements, affect overall resource utilization and migration patterns. Finally, we would like to expand the utility of the V SL metric by applying it other important areas in virtualized enterprise server management such as power management. We are particularly interested in the impact of the weights (Wresource ) in Equation 1 to characterize the system behavior as it relates to power.
8−VM
Figure 7: OLTP Transaction Throughput (TpM) for: 6 VM, and 8 VM experiments. VIBM migrations produce a higher TpM in the two experiments. the goal is to reduce the number of servers in a data center by sharing one server between multiple applications. The applications are isolated from one another using one VM per application. The authors define the residual capacity as the unused resources in a physical server that may be used by a VM being migrated to it. The authors explain that a physical host needs to have a high residual capacity in order to accommodate incoming VMs, therefore their migration metric is based on maximizing the variance of the residual capacities of the physical servers and also considers the cost of the migration. In our case, we can see some similarities between minimizing CL and maximizing the variance of residual capacity. However, our method does not consider migration cost, and targets maximizing overall resource usage instead of reducing local usage.
7.
8. ACKNOWLEDGMENTS We would like to acknowledge the support provided by VMware’s VMAP program. This work was supported in part by an NSF Major Research Instrumentation Grant (Award Number MRI-0619616), the Institute for Complex Scientific
CONCLUSIONS In this paper we introduced a new virtualized server load
241
[12] Microsoft Corp. Microsoft Hyper-V.
Software, and from the Gordon-CenSSIS, the Bernard M. Gordon Center for Subsurface Sensing and Imaging Systems, under the Engineering Research Centers Program of the National Science Foundation (Award Number EEC-9986821).
9.
http://www.microsoft.com/windowsserver2008/en/us/ hyperv-main.aspx.
[13] M. Nelson, B.-H. Lim, and G. Hutchins. Fast transparent migration for virtual machines. In USENIX Annual Technical Conference, General Track, pages 391–394, 2005. [14] J.-G. Park, J.-M. Kim, H. Choi, and Y.-C. Woo. Virtual machine migration in self-managing virtualized server environments. In Advanced Communication Technology, 2009. ICACT 2009. 11th International Conference on, volume 03, pages 2077–2083, Feb. 2009. [15] L. D. Rose, B. Homer, and D. Johnson. Detecting application load imbalance on high end massively parallel systems. In Euro-Par, pages 150–159, 2007. [16] Sun Mircrosystems Inc. Sun xVM. http://www.sun. com/software/products/xvmopscenter/index.jsp. [17] Transaction Processing Council. The TPC-C benchmark. http://www.tpc.org. [18] VMWare Inc. VMware Distributed Resource Scheduler. http://www.vmware.com/products/vi/vc/drs.html. [19] VMWare Inc. VMware vSphere 4. https://www.vmware.com/products/vsphere/. [20] R. P. Weicker. Dhrystone: a synthetic systems programming benchmark. Commun. ACM, 27(10):1013–1030, 1984. [21] Z. Xu, R. Huang, and L. Bhuyan. Load balancing of dns-based distributed web server systems with page caching. In Parallel and Distributed Systems, 2004. ICPADS 2004. Proceedings. Tenth International Conference on, pages 587–594, July 2004. [22] X. Yang, H. Dai, Y. Tang, and X. Yi. A general metric of load balancing in delta-range. In APPT, pages 311–321, 2003. [23] M. Zhao and R. J. Figueiredo. Experimental study of virtual machine migration in support of reservation of cluster resources. In VTDC ’07: Proceedings of the 3rd international workshop on Virtualization technology in distributed computing, pages 1–8, New York, NY, USA, 2007. ACM.
REFERENCES
[1] H. W. Choi, H. Kwak, A. Sohn, and K. Chung. Autonomous learning for efficient resource utilization of dynamic vm migration. In ICS ’08: Proceedings of the 22nd annual international conference on Supercomputing, pages 185–194, New York, NY, USA, 2008. ACM. [2] Citrix Systems Inc. Citrix XenSource. http://citrix.com/English/ps2/products/product.asp? contentID=683148.
[3] Citrix Systems Inc. Xenserver SDK documentation. http://docs.xensource.com/XenServer/4.0.1/api/. [4] C. Clark, K. Fraser, S. Hand, J. G. Hansen, E. Jul, C. Limpach, I. Pratt, and A. Warfield. Live migration of virtual machines. In NSDI’05: Proceedings of the 2nd Symposium on Networked Systems Design & Implementation, pages 273–286, Berkeley, CA, USA, 2005. USENIX Association. [5] R. P. Goldberg. Survey of virtual machine research. Computer, 7(6):34–45, June 1974. [6] D. Gupta, R. Gardner, and L. Cherkasova. Xenmon: Qos monitoring and performance profiling tool. Technical Report HPL-2005-187, HP Labs, 2005. [7] G. Khanna, K. Beaty, G. Kar, and A. Kochut. Application performance management in virtualized server environments. In Network Operations and Management Symposium, 2006. NOMS 2006. 10th IEEE/IFIP, pages 373–381, April 2006. [8] L. Kleinrock. Queueing Systems. Volume I: Theory. John Wiley and Sons, New York, 1975. [9] A. Kochut and K. Beaty. On strategies for dynamic resource management in virtualized server environments. In Modeling, Analysis, and Simulation of Computer and Telecommunication Systems, 2007. MASCOTS ’07. 15th International Symposium on, pages 193–200, Oct. 2007. [10] S. Martello and P. Toth. Knapsack Problems: Algorithms and Computer Implementation. John Wiley and Sons Ltd, Chichester, England, 1990. [11] A. Menon, J. R. Santos, Y. Turner, G. J. Janakiraman, and W. Zwaenepoel. Diagnosing performance overheads in the xen virtual machine environment. In VEE ’05: Proceedings of the 1st ACM/USENIX international conference on Virtual execution environments, pages 13–23, New York, NY, USA, 2005. ACM.
242