Quantifying & Minimizing Attack Surfaces Containing Moving Target Defenses Nathaniel Soule, Borislava Simidchieva, Fusun Yaman, Ronald Watro, Joseph Loyall, Michael Atighetchi Raytheon BBN Technologies Cambridge, MA {nsoule, simidchieva, fyaman, rwatro, jloyall, matighet}@bbn.com
Marco Carvalho Florida Institute of Technology Melbourne, FL
[email protected]
Abstract —The cyber security exposure of resilient systems is frequently described as an attack surface. A larger surface area indicates increased exposure to threats and a higher risk of compromise. Ad-hoc addition of dynamic proactive defenses to distributed systems may inadvertently increase the attack surface. This can lead to cyber friendly fire, a condition in which adding superfluous or incorrectly configured cyber defenses unintentionally reduces security and harms mission effectiveness. Examples of cyber friendly fire include defenses which themselves expose vulnerabilities (e.g., through an unsecured admin tool), unknown interaction effects between existing and new defenses causing brittleness or unavailability, and new defenses which may provide security benefits, but cause a significant performance impact leading to mission failure through timeliness violations. This paper describes a prototype service capability for creating semantic models of attack surfaces and using those models to (1) automatically quantify and compare cost and security metrics across multiple surfaces, covering both system and defense aspects, and (2) automatically identify opportunities for minimizing attack surfaces, e.g., by removing interactions that are not required for successful mission execution. Keywords: cyber security analysis, modeling, threat assessment
I. INTRODUCTION Cyber security remains one of the most serious challenges we face to national security and the economy. Systems employing well-known, but static, defenses have found themselves increasingly vulnerable to penetration from determined, diverse, and well-resourced adversaries launching targeted attacks such as Advanced Persistent Threats (APTs). In recent years, a class of proactive dynamic defenses known as Moving Target Defenses (MTDs) [1] has emerged to make entry points into networks and systems harder to detect, to reduce vulnerabilities and make exposure to those that remain more transient, and to make attacks against systems less effective. MTDs attempt to reduce and dynamically modulate the attack surfaces of systems, thereby limiting the potentially successful attack vectors an adversary can use to compromise a target system.
Distribution Statement “A” (Approved for Public Release, Distribution Unlimited). This material is based upon work supported by the Air Force Research Laboratory under Contract No. FA8750-14-C-0104.
David Last, David Myers, Capt. Bridget Flatley United States Air Force Research Laboratory Rome, NY {david.last.1, david.myers.35, bridget.flatley.1}@us.af.mil
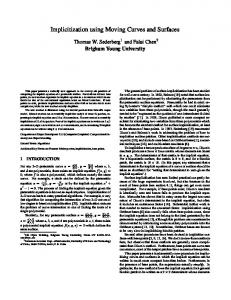
Fig. 1. High-Level Approach of Attack Surface Reasoning
As the number and complexity of these defenses increase, cyber defenders face the problem of selecting, composing, and configuring them, a process which to date is performed manually and without a clear understanding of integration points and risks associated with each defense or combination of defenses. The current state-of-the-art approach for evaluating cyber risks consists of performing structured logical arguments on security designs, e.g., using attack trees [2] generated during vulnerability assessments, and execution of manual or automated security scanning during penetration testing to detect specific vulnerabilities present in actual systems. There are two problems with this approach. First, it is easy to fall into the trap of adding defenses that provide little security benefit, introduce unacceptable cost or overhead, inadvertently increase the attack surface, or exhibit unintended side effects when combined with other defenses. Second, empirically validating and quantifying the attack surface of large complex enterprise systems through red-teaming becomes prohibitively expensive as the rate of legitimate change in those environments increases and each configuration needs retesting. The work presented in this paper describes a new approach towards modeling and analyzing attack surfaces, called Attack Surface Reasoning (ASR), which enables a quantification of
security, performance, and overhead for a composition of system components, MTDs, missions, and threats. Fig. 1 illustrates how the ASR web service prototype can capture models of underlying systems, cyber defenses, and missions in the form of unified models. These models are augmented by other models capturing adversary constraints, potential attack steps, and definitions of security and cost metrics. ASR provides two categories of algorithms – attack surface characterization and minimization. The characterization algorithms construct attack vectors and calculate security and cost metrics. The minimization algorithm uses system and mission information to identify opportunities for pruning unnecessary access paths and hence reducing the resulting attack surface. Using the models, algorithms, and metrics, cyber defenders can compare various deployments of both static and dynamic cyber defenses in a quantitative manner and contrast tradeoffs between security benefits and performance overheads. As such, ASR provides a foundational capability in support of an envisioned cyber planning tool that (1) automatically suggests and configures defenses given mission executions over systems, and (2) interacts with deployment and remote management substrates to dynamically adjust system configurations during mission execution. ASR is based on the following innovations: • Use of ontological semantic models to describe cyber systems, defenses, attacks, missions, and metrics in a well-defined, composable, and extensible manner. • Algorithms to automatically find feasible attack vectors and attack surface minimization. • Automatic computation of metrics capturing both security and cost tradeoffs at different granularities. • Relative comparison interfaces enabling rapid multidimensional comparison of metrics across multiple configurations, including visualizing comparisons. A. ASR Concept of Operations When analyzing a system and assessing its attack surface, one must consider (1) the potential adversary capabilities and starting points, e.g., distinguishing external threats from insider threats, (2) the intra- (among processes) and inter-host connectivity that allow legitimate or malicious actors to move from element to element within the system, (3) which elements are required for operational use, and among those which are required for a given mission, (4) the application- and missionlevel requirements that if unmet lead to degraded operation or failure, and (5) the defenses available for deployment, the potential deployment locations, and the protection they provide. The typical ASR concept of operations in the context of such a system start with analyzing the system without any additionally deployed MTDs (or other defenses) to compute a set of metrics to serve as a baseline. The metrics include the number of listening ports, number of data flows, and the average attack vector length, among others. Subsequent analyses then focus on incremental changes exploring what-if scenarios. For example, the ASR user can analyze the system with an IP hopping defense deployed. IP hopping MTDs introduce randomness into IP addresses assigned to participating nodes. All legitimate nodes are made aware of the hopping scheme (or explicitly
updated by the MTD itself) such that communication among these nodes can continue unhindered. From the perspective of nodes not included in the MTD, such as an adversary, the protected nodes have short-lived IP addresses, which hop to new randomly selected addresses. The ASR user can investigate the impact of this deployment under various configurations (e.g. varying the hopping frequency, or changing the set of protected hosts). Each analysis provides the user with high-level information such as an overall cost score, security score, and impact on the mission, as well as detailed low-level metrics that can be used to understand the differences in results. Deployment of defenses potentially introduces additional latency, CPU and memory requirements, or configuration complexity. IP hopping, for example, may introduce latency to communications as network address changes occur. In addition, while modulating certain areas of a system’s attack surface, defenses may in fact extend the attack surface in unexpected ways, e.g., by introducing new interactions that are not known and not protected. II. RELATED WORK The ASR modeling, analysis, and metric computation functionality shares common goals with other measures, frameworks, and tools that wish to quantify attack surface characteristics. Frameworks based on formal methods approaches such as [3][4], which employ I/O automata to formalize attack surfaces and provides a metric for measuring such surfaces, seek to achieve the same form of surface measurements as ASR. Other formal approaches such as [5] use discrete event simulation to explore the attack space. These approaches differ from our work in that they (1) are based on less user-accessible formalisms than the ASR semantic web approach, (2) require high-granularity functional models of systems, and (3) only provide metrics but no recommendations for approaches to minimize a system’s attack surface. Approaches such as [6] that do focus on exposing trade-offs in order to provide recommendations for mitigation operate at lower abstraction layers than ASR, providing precise results, but focusing on already-deployed systems, requiring knowledge of the exact set of vulnerabilities present in those systems, and assuming that all supplied defenses can be composed. Other attack surface measures and frameworks such as [7] focus on a single application and operate at lower levels concentrating on source code or software modules. Approaches to runtime MTD behavior such as [8] share similar tactics, but focus on guiding an MTD towards optimal reconfiguration behavior, as opposed to providing design time configuration and composition decision support. The work described in [9] focuses on a specific class of web applications rather than entire distributed systems. Numerous manual threat modeling and analysis frameworks [10][11][12] provide common terminology, diagrammatic notation, and process descriptions for threat modeling. However, these frameworks do not perform any automated analysis, or necessarily provide specific metrics and measures. Performing quantitative reachability analysis has been studied extensively in the academic literature, using domainspecific languages such as Alloy [13], Lobster [14], or Cross Domain Entitlement Language (CDEL) [15]. Such reachability analysis serves as an underpinning mechanism in ASR’s attack vector finding algorithms, but it is not the goal, rather it is included as support of the larger attack surface measurement tool.
Identifying potential attack vectors through the use of attack graph generation (both manual and automatic) and analysis has been explored in [16]–[19] among numerous others. Decision support analysis systems for cyber defense, such as [20], employ probabilistic techniques by annotating attack trees with defense information. Mathematical frameworks over attack graphs such as that described in [21] attempt to identify optimal defender responses to interdict adversary actions in the graph. ASR focuses less on determining or enumerating attack success feasibility or probability over a given system and instead focuses on supporting comparative and recommendation based analytics. The attack surface quantification process used by ASR does employ information on potential attack vectors, however, and so in theory could use attack graphs as a partial alternative or supplemental data source. Security analysis involves many variables whose exact values are dynamic and difficult to model with any general applicability, as they are dependent upon very targeted and specific elements of a system, defense, or adversary. These challenges have led to probabilistic models and metrics [22][23][24]. ASR is currently primarily a deterministic tool. Beyond attack surface measurement, quantifying security in general is a long-running and difficult line of research. Both [25] and [26] outline some of the complexities and undertake a survey of potential directions forward. III. MODELS The ASR algorithms and metrics operate over a set of models that together describe the system under examination, its defenses, the assumed capabilities and starting point(s) of the adversary, and optionally a mission, which may operate over the defined system. In addition, the set of metrics is itself described in a model to allow for easy user-defined extension. ASR models are defined in the World Wide Web Consortium (W3C) semantic Web Ontology Language (OWL). Using a semantic web substrate provides a number of benefits such as inference capabilities, easy and clean multi-domain ontology integration, mature standards-based tooling and communities, and existing scalability and performance benchmarks. One of the key challenges of modeling distributed systems is identifying the level of abstraction most appropriate for the models, the algorithms that operate over them, and the results that are provided to stakeholders. Modeling at the extreme of detail allows specific and exact answers to be derived, but creates models that are difficult to create accurately and to keep up to date, and leads to analysis brittle to system changes. Modeling at too coarse of a level of abstraction on the other hand leads to models that are easily created, but can tell interested parties little about questions of importance. With ASR, a middle road was taken. A number of the concepts, and the level of granularity, were modeled after Microsoft’s STRIDE [27] threat classification framework and related modeling languages described in [10]. Notions of elements such as processes, hosts, networks, endpoints, and data flows, represent the abstraction level commonly used with STRIDE and employed in ASR. ASR models an attack surface through a strategic combination of system, defense, attack, mission, adversary, and metric models.
A. System Models System models describe the business system against which attacks can be executed and within or around which defenses can be deployed. These models detail the hosts in the system, the networks that connect these hosts, and the processes that run on them. Data flows are modeled here at three different levels: process, network, and physical. The three levels are interconnected in the model such that one can determine for a given process-level data flow that the described data is sent out through a given network endpoint which is bound to a particular network interface card (NIC) at the physical layer. B. Defense Models Defense models describe which static and dynamic defenses are in place, what elements of the system they protect, what types of coverage they provide, and what cost is incurred. A single defense model can incorporate multiple defenses. C. Attack Models Attack models describe the generic activities performed by adversaries as a collection of potential attack steps. Each attack step is described by a number of attributes such as its attack type (in STRIDE), the pre-condition for the attack step to execute, the post-condition that holds once it successfully executes, and other attributes including side effects. D. Mission Models Mission models describe expected flows between actors and services at the process layer. The mission models are a strict subset of process-level system entities and data flows contained in the system model and can be thought of as use cases. The flows specify requirements on performance and security of mission-critical information exchanges. E. Adversary Models Adversary models describe assumed constraints on the adversary, such as attacker starting point and optionally a goal. F. Metric Models Metric models enumerate all ASR metrics and define, for each metric, its name, the domain over which it is executed, and the SPARQL query used to compute it. Metrics are computed by querying other models, and some are then postprocessed to compute statistical values such as mean or max. IV. METRICS & ALGORITHMS A. Attack Vector Finding Algorithm The purpose of the attack vector finding algorithm is to find all applicable ways an adversary may cause harm, given (1) an optional adversarial objective, and a starting position, (2) a set of generic attack steps available to choose from, (3) a specific system that is being targeted, and (4) optionally, defenses. The attack vector finding algorithm is a recursive depthfirst search that constructs a set of attack vectors, each of which is an ordered sequence of instantiated attack steps. An instantiated attack step is an instance of the generic attack step previously described in the attack model with certain properties bound to specific elements of the system. For a generic attack step to be instantiated, all constraints of the step need to be satisfied. For instance, the start and target endpoints must have
the right characteristics, such as type, connectivity, resources, and vulnerabilities. In particular, all requirements of a step must hold throughout the execution of that step. For attack steps, determining this amounts to executing a SPARQL query associated with the attack step. MTDs may invalidate the adversary’s knowledge periodically (e.g., through IP hopping) and thus prevent successful attack step execution. Attack vector finding may optionally include either a goal (or set of goals), or a maximum attack vector length, or both. B. Metrics A core goal of ASR is to allow for the quantification of attack surfaces, and to facilitate user-guided exploration of how changes in the system, defense, or other models can effect change in the attack surface. Attack surfaces are quantified with respect to over thirty system- and mission-wide metrics that are computed during the analysis of a configuration. Because ASR aims to provide users with actionable information, these metrics are organized hierarchically and presented in a way that facilitates easy comparison between and among configurations. ASR metrics are defined as OWL models and thus are easily modified to 1) fit custom user requirements, and 2) reflect the results of current validation efforts of ASR analyses. Each low-level metric (e.g., mean attack vector length, total number of entry points) supports one or more higher-level values that cover the security and cost of both the system in an unbound context, and that system with respect to a particular mission. Because too many metrics can overwhelm a user, composite metrics are computed over the sub-metrics in order to provide users with information about the fitness of the configuration with respect to both cost and security at a glance. ASR quantifies an attack surface with two high level numbers reflecting cost and security because a single number can easily convolute complex relationships and tradeoffs between these two dimensions. In many cases, after seeing the at-aglance cost and security scores of a configuration, a user wants to investigate the individual metrics comprising these index values. ASR provides a convenient heat map display to compare multiple configurations side by side and easily visualize the differences in each individual metric. In addition to the system-focused set of metrics, ASR provides mission-oriented metrics. These mission metrics mirror their system counterparts in their support of either high-level mission security or mission cost indexes. Mission security requirements optionally specify constraints over confidentiality, integrity, and availability of a subset of flows. Security metrics are evaluated on a binary scale where a data flow either meets its security requirement or violates it. A data flow is considered to violate one of its requirements if an attack step can compromise that requirement. The mission-specific cost metrics consist of latency and throughput values calculated for mission-critical data flows. Mission cost metrics are rated on a three-band ranking of pass, degraded, or fail, depending on user-specified threshold values. C. Minimization Algorithm Attack surface minimization provides a way to identify system elements that are not required for system operation, or for
execution of a given mission. Note that once identified, actual removal of the non-essential entities from the system can be accomplished in many ways, e.g., disabling a port, changing firewall configurations or turning off a process/host. ASR provides recommendations for removal, and will automatically create updated models based on user-approved removal selections, but does not assist in actual removal of the real elements. Minimization is an iterative and mixed-initiative process with two main types ‒ minimization based on the mission requirements and minimization on the system model itself. In each iteration ASR algorithms find a set of candidates for removal, and then the user selects a subset of candidates to remove from the system. The need for iteration comes from the fact that the entities are connected to each other in non-trivial ways and the removal of one entity might trigger a minimization rule that was not active in the previous iteration. For example if a process is removed in one iteration because it is not necessary for the mission, then a listening port in a server that this process is connecting through may become unnecessary in the next iteration if there are no other data flows going through it. The minimization eventually reaches a fixed point where no more new candidates are identified. Minimization over the mission model involves finding processes that are not critical from the mission’s perspective. These processes and the data flows associated with them are then removed if the user chooses to do so. System-level minimization involves identifying system concepts and their dependencies that do not interact with the rest of the system yet add to the attack surface, such as unused listening sockets. V. PROTOTYPE A. Tool Description The ASR tool allows users to create, manage, and analyze configurations. Each configuration describes a collection of models over which the ASR analysis algorithms operate. The user interface is divided into two primary areas. The first area allows for the creation and manipulation of configurations and the second allows for exploration of the analysis results of one or more analyzed configurations. Users can define new configurations and delete, query, visualize, and initiate analysis of existing configurations. Configurations are composed of the six models described in section III. Users craft these models in existing off-the-shelf OWL/text editors. As part of the configuration creation process, users select these models from local storage and upload them to ASR for persistence in a triple store. Once a configuration is created, it can be queried using an ASR built-in SPARQL submission tool, visualized and explored in an interactive graph layout, or analyzed to compute security, cost, and mission related metrics. When a user selects a configuration for analysis, the ASR engine processes this request and displays the results. The user can view a set of high-level metrics related to the cost, security benefit, and mission impact. Selecting an analysis result allows for further drill down into the lower-level metrics, which are used to compute the high-level scores (cost, security, mission). The lower-level metrics provide information such as the average length of successful attack vectors, and the number of discovered open endpoints. For a more detailed exploration, users
Fig. 2. ASR Analysis Results Heat Map system, defense, attack-steps, adversary, and mission models are currently built manually. To truly test the system
can also view the actual attack vectors ASR found in a popup window. Results can be compared with one or more others via a heat map based difference exploration tool (shown in Fig. 2) B. Architecture The ASR tool was developed as a three-tier web service based application in order to support a scalable system decoupled from client tooling and capabilities, multiple concurrent users who may wish to share data, and a system that can take advantage of new triple store advancements without impact to the design, architecture, or clients. The ASR architecture, shown in Fig. 3, is organized in the following core layers: The presentation tier is a client-facing front end that runs within any modern web browser and employs JavaScript and HTML to create a flexible and lightweight interface. This layer interacts using AJAX with the backend through a set of web services that can exchange JavaScript Object Notation (JSON) formatted data. The business logic tier performs the real heavy lifting, and is where the attack surface reasoning algorithms are implemented. This tier is written in Java and exposes a web services interface through the use of the Jetty embeddable HTTP server. Interaction with the data layer is achieved through the use of the Apache Jena library for semantic/linked data. Jena is used to both construct/manipulate models, and to query them using the SPARQL query language. The data tier is fulfilled by a triple store implementation. By default, ASR works with the all-Java Jena TDB triple store, which can be embedded within the ASR application itself thus eliminating any need for native code and simplifying ASR deployment. The Java library used by the logic tier abstracts away the implementation details of the triple store, and thus this component is pluggable. In addition to TDB, ASR has been tested with BBN’s Parliament triple store. VI. EXPERIMENTAL RESULTS The initial focus for ASR was on establishing feasibility of attack surface quantification using semantic web models. The work described in this section aims to understand the current unoptimized system’s limits, as well as uncover which attributes of a model (the number of hosts, processes, networks, servers, etc.) have the potential to lead to exponential behavior.
Fig. 3. ASR Architecture
Due to space constraints here we provide only a high level description of the tests to give the reader a sense of the type and character of our initial experiments, and provide a glimpse into the results as an indicator of our future focus areas. A. Test Setup The random model generation framework takes a set of configuration parameters that describe the system, defense, and adversary, and then executes a defined procedure to construct models of the required hosts, processes, networks, defenses, etc. The configuration parameters cover 17 different dimensions such as the number of hosts, the number of processes per host, and the number of network interface cards per host. Values for each dimension can be defined as a fixed integer, or an integer distribution. All tests were run on a Dell Mobile Precision M4700 with a 2.7GHz Intel i7 processor, and 32 GB DDR3-1600MHz SDRAM. B. High Level Results Over 300 individual experiments were run, each varying an element or elements of the configuration. As exploring the complete configuration space is not feasible (even artificially tight bounds restricting each variable to range over only 10 values results in a 1017 space), an initial probing phase was undertaken to conduct ad hoc experiments aimed at illuminating the rough edges of the feasible execution space. As we gained insight into these edges, more targeted testing began. The high-level take away from the testing is that the ASR tool can currently support enclave sized models consisting of fewer than 30 hosts, each running 1-2 modeled processes, and a total of fewer than 10 servers. Beyond these numbers, execution times quickly increase to multiple hours or longer. As can be expected given the nature of the current analysis algorithms, configuration elements that expose entry points, and thus increase the attack surface, showed greater than linear impacts on runtime. In particular elements that can be bound to the start or end points of an attack step have the greatest direct impact. Process counts, as seen in Fig. 4, show an example of this pattern where in low numbers the combinatorial impacts are less pronounced, but as the counts increase, the runtime shows dramatic climbs.
[6]
[7] [8]
[9] [10] [11] Fig. 4. Impact of Process Count on Analysis Time
VII. CONCLUSION AND NEXT STEPS As the number and complexity of defenses (including MTDs), system configurations, and potential attacks continually increase, cyber defenders face the problem of manually selecting and configuring defenses for a distributed missioncritical system without a clear understanding of the seams/integration points, residual risks, and costs (in terms of impact on performance and functionality). Integration of defenses performed in a non-structured way bears the risks of adding defenses with no value, inadvertently increasing the attack surface, or negatively impacting critical functionality. The current ASR web service prototype capability provides means for automatically characterizing variant attack surfaces for security and performance and enables cyber defenders to perform relative comparisons between attack surfaces. Numerous ASR extensions and enhancements are already underway, including (1) reasoning over probability distributions to better incorporate the probabilistic nature of attacks and defenses, (2) automated creation of system and mission models from actual implemented systems and preexisting mission descriptions, (3) extending the library of modeled systems, attacks, and defenses in order to further test and refine the ASR system, (4) performing in-depth profiling and subsequent optimization to support increased scalability – this effort having already gained a 2 orders of magnitude decrease in analysis run times over the system reported here, (5) providing various user interface enhancements to support a user-friendly and intuitive experience, and (6) automatically exploring the defense selection and configuration space to reduce reliance on user-driven exploration, and (7) verify and validate the results that ASR provides by executing missions that correspond to the test models in a virtual environment. REFERENCES [1] S. Jajodia, A. K. Ghosh, V. Swarup, C. Wang, and X. S. Wang, Moving [2] [3]
[4] [5]
target defense: creating asymmetric uncertainty for cyber threats, vol. 54. Springer Science & Business Media, 2011. B. Schneier, “Attack trees,” Dr Dobb’s J., vol. 24, no. 12, pp. 21–29, 1999. P. Manadhata and J. Wing, “A Formal Model for a System’s Attack Surface,” in Moving Target Defense - Advances in Information Security, vol. 54, Springer, pp. 1–28. P. Manadhata and J. Wing, “An Attack Surface Metric,” IEEE Trans. Softw. Eng., vol. 37, no. 3, pp. 371–386, 2011. M. D. Ford, K. Keefe, E. LeMay, W. H. Sanders, and C. Muehrcke, “Implementing the ADVISE security modeling formalism in Moebius,”
[12]
[13] [14] [15]
[16]
[17]
[18]
[19]
[20]
[21]
[22]
[23]
[24]
[25] [26] [27]
in Dependable Systems and Networks (DSN), 2013 43rd Annual IEEE/IFIP International Conference on, 2013, pp. 1–8. N. Poolsappasit, R. Dewri, and I. Ray, “Dynamic Security Risk Management Using Bayesian Attack Graphs,” IEEE Trans. Dependable Secure Comput., vol. 9, no. 1, pp. 61–74, Jan. 2012. M. Howard, “Attack surface: Mitigate security risks by minimizing the code you expose to untrusted users,” MSDN Magazine, Nov-2004. Q. Zhu and T. Başar, “Game-Theoretic Approach to Feedback-Driven Multi-stage Moving Target Defense,” in Decision and Game Theory for Security, vol. 8252, S. K. Das, C. Nita-Rotaru, and M. Kantarcioglu, Eds. Cham: Springer International Publishing, 2013, pp. 246–263. T. Heumann, S. Turpe, and J. Keller, “Quantifying the Attack Surface of a Web Application,” Sicherheit, pp. 305–316, 2010. A. Shostack, Threat Modeling, Designing for Security. Wiley, 2014. J. Ingalsbe, L. Kunimatsu, T. Baeten, and N. Mead, “Threat Modeling: Diving Into the Deep End,” IEEE Softw., vol. 25, no. 1, pp. 28–34, 2008. P. Saitta, B. Larcom, and M. Eddington, “Trike v. 1 methodology document,” 2005. [Online]. Available: http://www.octotrike.org/papers/Trike_v1_Methodology_Documentdraft.pdf. D. Jackson, “Alloy: a lightweight object modelling notation,” ACM Trans. Softw. Eng. Methodol., vol. 11, no. 2, pp. 256–290, Apr. 2002. J. Hurd, M. Carlsson, B. Letner, and P. White, “Lobster: A domain specific language for selinux policies,” Galois, 2008. J. Beal, J. Webb, and M. Atighetchi, “Adjustable autonomy for crossdomain entitlement decisions,” in Proceedings of the 3rd ACM workshop on Artificial intelligence and security, 2010, p. 65. X. Ou, W. F. Boyer, and M. A. McQueen, “A scalable approach to attack graph generation,” in Proceedings of the 13th ACM conference on Computer and communications security, 2006, p. 336. S. Noel and S. Jajodia, “Managing attack graph complexity through visual hierarchical aggregation,” in Proceedings of the 2004 ACM workshop on Visualization and data mining for computer security, 2004, p. 109. Bingrui Foo, Yu-Sung Wu, Yu-Chun Mao, S. Bagchi, and E. Spafford, “ADEPTS: Adaptive Intrusion Response Using Attack Graphs in an ECommerce Environment,” in SN 2005. Proceedings. International Conference on Dependable Systems and Networks, 2005, pp. 508–517. K. Ingols, R. Lippmann, and K. Piwowarski, “Practical Attack Graph Generation for Network Defense,” in ACSAC’06. 22nd Annual Computer Security Applications Conference, 2006, pp. 121–130. “Cyber Security Risks Assessment with Bayesian Defense Graphs and Architectural Models,” in HICSS’09. 42nd Hawaii International Conference on Systems Sciences, 2009, pp. 1–10. J. Letchford and Y. Vorobeychik, “Optimal Interdiction of Attack Plans,” presented at the The 2013 International Conference on Autonomous Agents and Multi-agent Systems (AAMAS 2013), St. Paul, MN, USA, 2013, pp. 199–206. Peng Xie, J. H. Li, Xinming Ou, Peng Liu, and R. Levy, “Using Bayesian networks for cyber security analysis,” in IEEE/IFIP International Conference on Dependable Systems and Networks (DSN), 2010, pp. 211–220. L. Wang, T. Islam, T. Long, A. Singhal, and S. Jajodia, “An Attack Graph-Based Probabilistic Security Metric,” in Data and Applications Security XXII, vol. 5094, V. Atluri, Ed. Berlin, Heidelberg: Springer Berlin Heidelberg, 2008, pp. 283–296. S. Jha, O. Sheyner, and J. Wing, “Two formal analyses of attack graphs,” in Computer Security Foundations Workshop Proceedings. 15th IEEE, 2002, pp. 49–63. M. Torgerson, “Security metrics for communication systems,” presented at the 12th ICCRTS, Newport, Rhode Island, 2007. W. Jansen, Directions in Security Metrics Research. Diane Publishing, 2010. L. Kohnfelder and G. Praerit, “The Threats To Our Products,” 01-Apr1999. [Online]. Available: http://blogs.msdn.com/cfsfile.ashx/__key/communityserver-components-postattachments/00-0988-74-86/The-threats-to-our-products.docx. [Accessed: 02-Mar-2015].