Mar 27, 2014 - Figure 4 contains code that computes optical flow in Python using the Horn-Schunck method ... line-by-line profiling information. Instead, we ...
Quantifying the Energy Efficiency of Object Recognition and Optical Flow Michael Anderson, Forrest Iandola, Kurt Keutzer UC Berkeley ASPIRE Lab March 27, 2014
Abstract In this report, we analyze the computational and performance aspects of current stateof-the-art object recognition and optical flow algorithms. First, we identify important algorithms for object recognition and optical flow, then we perform a pattern decomposition to identify key computations. We include profiles of the runtime and energy efficiency (GFLOPS/W) for our implementation of these applications on a commercial architecture. Finally, we include an analysis of memory-bandwidth boundedness for optical flow to identify opportunities for communication-avoiding algorithms. Our results were measured on an Intel i7-4770K (Haswell) reference platform. A fivelayer convolutional neural network used for object classification achieves 0.70 GFLOPS/W, which is 21% of the theoretical compute bound for this Haswell processor. On the HornSchunck, Lucas-Kanade, and Brox optical flow methods our implementations achieve 0.0338, 0.0103, and 0.0203 GFLOPS/W respectively. Our implementation achieves 7.9% of the theoretical bandwidth bound, assuming no cross-iteration memory optimization, for HornSchunk optical flow using the Jacobi solver, and 9.7% of the bandwidth bound for the conjugate-gradient solver. To improve performance, we will focus first on increasing bandwidth utilization, then on doing cross-iteration memory optimizations such as blocking and tiling the Jacobi solver and employing communication-avoiding linear solvers. We also compare the runtime-accuracy tradeoffs for each optical flow method. We find that each method has distinct advantages over the other methods in terms of the runtimeaccuracy tradeoff, so we will continue to develop and support all three methods in the future.
1
Introduction
In this report, we examine computations required for on-board unmanned aerial vehicle (UAV) vision processing. Specifically, we focus on object recognition, object tracking, and optical flow. Given that on-board processing is constrained by power, we focus on quantifying the energy efficiency and accuracy of current state-of-the-art methods. We start by decomposing the application capabilities, for example object recognition using convolutional neural networks, into patterns. This provides a high-level structural and computational understanding of the application. Then we profile performance on a commercial processor (Intel i7-4770K). To contextualize performance, we calculate the number of floating point operations (FLOPs) performed for each computation. This allows us to compute a measure of energy efficiency known as giga-flops per second per watt (GFLOPS/W). For optical flow, we also count the total number of bytes transferred in the inner loop of the algorithm. This
1
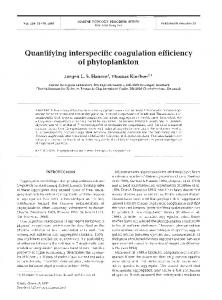
Figure 1: Deep convolutional neural network for object recognition [2]. This network layout achieved the highest object classification accuracy for ImageNet 2012, and a similar network won ImageNet 2013. Big data and efficient implementations have made deep learning accurate and tractable. allows us to compute the flop-to-byte ratio, which gives an idea of the memory-boundedness of the algorithm and the potential speedup from communication-avoiding algorithms [1]. In Section 2, we analyze object recognition using convolutional neural networks [2]. We find that a five-layer convolutional neural network is able to achieve 0.70 GFLOPS/W. In Section 3, we analyze the Horn-Schunck, Lucas-Kande, and Brox optical flow algorithms [3, 4, 5]. We determine these methods achieve 0.0338, 0.0103, and 0.0203 GFLOPS/W respectively. We also compute the flop-per-byte ratio for Horn-Schunck and Brox methods and report accuracy results for all three methods, and we compute the achieved percentage of peak bandwidth for the Horn-Schunck method. Section 4 concludes our report.
2
Object Recognition
Object recognition is a key enabling technology for a variety of UAV capabilities including navigation, odometry, and reconnaissance.
2.1
State of the art Algorithm
Within the past 18 months, the computer vision community has seen a large improvement in accuracy by designing systems based on deep neural networks instead of hand-engineered descriptors. The key algorithms of the deep learning revolution can be traced back to the late 1980s. However, the rise of big data has led to huge labeled datasets (e.g. ImageNet [6] with >1M labeled images) for training and evaluating object recognition systems. It turns out that large datasets are a lynchpin of high-accuracy neural networks for object recognition. Additionally, extremely efficient deep neural network implementations such as Berkeley’s Caffe [7] expose enough parallelism to make ImageNet a tractable benchmark for deep neural network object recognition. Today, neural networks such as Alexnet [2] and their ilk (e.g. [8],[9]) provide state-of-the-art object classification accuracy (up to 88% when scored on top-5 categories) on the 1000-category ImageNet dataset. We show an illustration of Alexnet in Figure 1. In the remainder of this section, we analyze the computational patterns and bottlenecks, GFLOPS/s, and energy for state-of-the-art deep convolutional networks on the Haswell reference architecture.
2
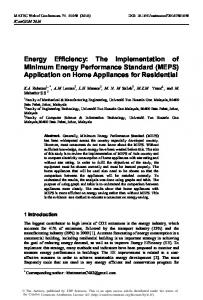
Figure 2: The ASPIRE “Periodic Table” of computer vision computational patterns. Computer vision algorithms evolve quickly, but these patterns continue to underpin most computer vision mechanisms. “Number of papers” denotes the number of papers in the CVPR 2011 object recognition track that leverage each pattern.
2.2
Computational Patterns
After several years of work on efficient computer vision in the ParLab and ASPIRE Lab at Berkeley, we have codified computer vision computations into a “periodic table” of 15 underlying computational patterns (Figure 2). While computer vision algorithms continue to evolve and advance, these underlying patterns have remained relatively static over many generations of computer vision algorithms. Recently, object recognition algorithms have seen a major shift to deep learning, and it would be easy for computational efficiency researchers to be intimidated by this – how much of what we know about efficient computer vision will transfer to these new deep neural algorithms? Well, as it turns out, it is quite reasonable to map deep neural networks into our periodic table of computer vision patterns (Figure 2). As we will show in the next paragraph, analyzing the performance and energy efficiency of deep neural networks is quite easy, so long as we think in terms of well-understood patterns that are less susceptible to computer vision algorithmic changes. Broadly, deep neural networks perform feature extraction and recognition by taking an image and feeding it through several layers of filters and dimensionality adjustments. For both training and inference, layers are implemented with primitives such as 3D convolution with multiple kernels, neighborhood max filtering (“max-pooling”), ReLu (removing negative numbers), and dropout (zeroing out a random collection of values to avoid overfitting). In Table 1, we map these deep neural network primitives into our periodic table of computer vision computational patterns.
2.3
Performance and Energy Analysis
We now turn to analyzing the computational complexity, efficiency, and energy of object recognition with convolutional neural networks. As shown in the previous subsection, convolution dominates the overall computation time in this system. Therefore, we use convolution as a lower bound in terms of overall FLOP count, leading to slightly conservative but reasonable
3
Layer type convolution layer dropout layer ReLu layer max-filtering
Pattern(s) convolution – convolution (1x1 filter) convolution-style data access pattern
Table 1: Mapping convolutional neural networks to the ASPIRE periodic table of computer vision patterns. Layer conv1 conv2 conv3 conv4 conv5 TOTAL conv layers TOTAL all layers
Runtime per 50 frames (s) 0.0980 0.1806 0.0860 0.0859 0.0756 0.5261 0.71
Input dims
Filter dims
# filters
224x224x3 55x55x48 27x27x128 13x13x192 13x13x192
11x11x3 5x5x48 3x3x128 3x3x192 3x3x192
96 256 384 384 256
Complexity (# GFLOP) 10.93 22.39 14.95 11.21 7.48 66.97 >=127.28
GFLOPS/s
Avg Power (W)
Energy per 50 frames (J)
GFLOPS/s/W
111.46 124.02 173.81 130.52 98.93 127.28 94.32
135
95.85
0.70
Table 2: Performance per convolutional layer and overall for the Berkeley Caffe [7] convolutional neural network, initialized with the Alexnet [2] configuration. Evaluated on the Haswell i74770K reference architecture. efficiency and energy results. In Table 2, we show the analysis and results in terms of GFLOPS/s for the convolutional layers in the Caffe convolutional neural network, using the same configuration as discussed previously. As you can see in Table 2, the layers funnel down from a 224x224 3-channel input image down to a 13x13 256-channel feature descriptor map. Given our coarse power measurement technology, we are able to obtain the power and energy of the overall system, but not of individual layers. Also, since the computation of neural networks in Caffe is dominated by convolution, we use the number of GFLOPs in convolution as a lower bound for the overall computational complexity of all layers in the neural network. This analysis culminates in finding that object recognition with the Caffe convolutional neural network achieves 0.70 GFLOPS/s/W on the Intel Haswell reference platform (Table 2). This is 21% of the theoretical compute bound for this Haswell processor.
3
Optical Flow
Optical flow is a common computer vision application that computes the apparent motion of each pixel between pairs of images, or between frames in a video. Optical flow information enables point tracking which can be a powerful capability for UAVs. Optical flow between two images can be visualized (Figure 3b). Colors indicate direction and intensity indicates magnitude of pixel motion. Quality of solution is measured using standard benchmarks such as the Middlebury optical flow benchmark dataset [10] and the KTTI vision benchmark suite [11]. The quality metrics for optical flow are average angular error (AAE) of the flow vectors compared to ground truth provided by the these benchmark datasets, as well as average endpoint error (AEE) of the flow vectors. There are many different ways to solve optical flow. As of February 2014, the KTTI vision benchmark results webpage for optical flow reports results for 42 different optical flow methods. The Middlebury benchmark results webpage reports results for 95 different optical flow methods. We choose three methods to focus on: Horn-Schunck [3], Brox [5], and Lucas-Kanade [12]. We focus on Horn-Schunck and Brox due to their popularity, along with the general consensus 4
(a) Color indicates direction of the flow and intensity indicates the magnitude of the flow.
(b) Colorcode mapping colors to flow directions and magnitudes.
Figure 3: Visualization of optical flow. that the majority of newer methods are simply extensions of these original formulations [13]. We include Lucas-Kanade in our analysis because it considers only local image patches, so it is fundamentally different than Horn-Schunk and Brox. The Lucas-Kanade method is also much cheaper to compute. We will analyze these three optical flow methods in the following subsections. For each method, as specified in the deliverable text, we will show: • the high level algorithm description, • the decomposition into computational and structural patterns, • profiles of the runtime and energy analysis, • analysis of computation vs. quality of solution trade-offs, and • an analysis of memory-boundedness. We also provide plots comparing all three optical flow methods side-by-side, run with a variety of parameters, in terms of runtime vs. accuracy.
3.1 3.1.1
Horn-Schunck Method High level algorithm description
The Horn-Schunck method is formulated as a minimization of the following energy functional: ZZ E= (Ix u + Iy v + It )2 + α2 (k∇uk2 + k∇vk2 )dxdy (1) Ix is the image gradient in the x dimension, Iy is the image gradient in the y dimension, It is the image gradient in the time dimension, u and v are the x and y components of the flow 5
def hs_oflow
du dv Ix Iy It
= = = = =
(im1_data, im2_data, D, Gx, Gy, u, v, zero, one, lam2 ):
zero * u zero * v Gx*im1_data Gy*im1_data im1_data warp_img2d(im2_data, u, v) Ix2 = Ix * Ix IxIy = Ix * Iy Iy2 = Iy * Iy
# # # # #
Input images Laplacian stencil Gradient stencils Flow vectors Scalars
# # # #
Dense Linear Algebra Dense Linear Algebra Structured Grid Structured Grid
# # # #
Sparse Linear Algebra Dense Linear Algebra Dense Linear Algebra Dense Linear Algebra
# Application pattern: Linear Solver # Structural pattern: Iterator for i in range(200): ubar = D * du # vbar = D * dv # num = Ix * ubar + Iy * vbar + It # den = Ix2 + Iy2 + lam2 # du = ubar - (Ix * num) / den # dv = vbar - (Iy * num) / den # return du, dv
Structured Grid Structured Grid Dense Linear Algebra Dense Linear Algebra Dense Linear Algebra Dense Linear Algebra
Figure 4: Code and pattern decomposition for Horn-Schunck optical flow solved using the Jacobi linear solver vectors, respectively, and α is a parameter that trades off smoothness of the flow field with the accuracy of the flow nearby a given pixel. The integral is summing this quantity for every pixel in the image. Since each term in this functional represents a cost, we try to minimize the functional over all possible flow functions u and v. A detailed derivation of the Horn-Schunck algorithm is included in the appendices of this document. 3.1.2
Decomposition into computational and structural patterns
Figure 4 contains code that computes optical flow in Python using the Horn-Schunck method and the Jacboi linear solver. This code runs in our Hindemith framework. The Hindemith framework analyzes the algorithm description in Python and composes hand-written OpenCL functions to eliminate unnecessary memory traffic that is common array codes such as this. This particular implementation was designed to match the implementation found in the ArrayFire example codes [14]. We’ve annotated the code with the input types, as well as the computational and structural patterns.
6
Solver Type Jacobi CG PCG RB
Runtime per Frame (s) 0.735 1.542 2.193 2.539
Average Power (W) 95.16 98.39 100.69 96.43
Energy per Frame (J) 69.98 151.74 220.80 244.79
# Iter. 400 400 400 400
Runtime per iteration (ms) 1.838 3.856 5.482 6.346
Energy per iteration (mJ) 174.9 379.4 552.0 612.0
GFLOPS per Watt 0.0338 0.0256 0.0252 0.0193
Table 3: Runtime and energy metrics for Horn-Schunck optical flow The solver consists mainly of Dense Linear Algebra and Structured Grid operations. This pattern decomposition informs hardware and software implementation choices. For example, these particular patterns are particularly amenable to vectorization and tiling optimizations so we expect this application to compile to efficient code using vectorizing compilers or implicitly parallel languages, and to execute efficiently on vector or SIMD hardware. We can also solve the Horn-Schunck algorithm using other linear solvers, such as conjugategradient (CG), preconditioned conjugate-gradient (PCG), and red-black Gauss Seidel (RB). We have also implemented those linear solvers in our Hindemith framework and will present comparative performance and accuracy results using those linear solvers. 3.1.3
Profiles of runtime and energy analysis
In this section we will analyze the runtime and energy consumption of Horn-Schunck optical flow using a variety of different linear solvers. We run our experiment on Intel Core i7-4770 CPU 3.4 GHz (Haswell) processor. We use the AMD APP OpenCL SDK compiler and runtime. The power was taken using the Watts Up Pro? power logger at one second intervals, then averaged over the duration of multiple executions. The input image pair is RubberWhale from the Middlebury optical flow benchmark set, which is size 588x384. We do not resize the image. We represent the images, the flow, and all intermediate data in grayscale single-precision floating point format. We set the parameter α to 0.1. Because the Hindemith framework fuses most of these operations together, we do not have line-by-line profiling information. Instead, we record the runtime and power consumption for an execution of 400 linear solver iterations. Then we compute the average runtime and energy per linear solver iteration. Some linear solvers converge faster than others. We will consider the trade-off between per-iteration efficiency and convergence rate in the next section. 3.1.4
Analysis of computation vs quality of solution trade-offs
As shown in Table 3, different linear solvers have different runtime and energy costs. However, there is a trade-off between computation and quality of solution that must be explored. More computationally expensive solvers such as conjugate-gradient converge to a good solution faster than cheaper solvers like Jacobi. Figure 5 shows the rate of convergence for each of the four linear solvers. The best performing solver, in terms of quality per number of iterations, is the preconditioned conjugate gradient solver, followed by the red-black Gauss Seidel, and conjugate gradient solvers. We are interested in the energy it takes to get a given solution quality. In Figure 6, we plot the quality of solution for each linear solver per Joule. This is calculated by multiplying 7
Horn-‐Schunck: Quality of Solu2on vs # Itera2ons 28
Average Angular Error (AAE)
26 24 22 HS Jacobi
20
HS CG HS PCG
18
HS RB
16 14 12 0
20
40
60
80
100
120
140
# Itera2ons
Figure 5: Quality of solution vs number iterations for different Horn-Schunck linear solvers the average number of Joules per iteration with the total number of iterations at each point. As we would expect, Jacobi becomes a more attractive option when we consider Joules instead of iterations. This is because Jacobi iterations are comparatively cheap in terms of Joules. Conversely, our implementation of red-black Gauss Seidel proves to be very inefficient when we consider Joules instead of just iterations. 3.1.5
Analysis of memory-boundedness
For our analysis of memory-boundedness and GFLOPS/Watt, we consider only the inner loop of the linear solver. In Figure 7, we annotate the number of FLOPS performed for every operation in the Jacobi linear solver: One iteration of the Jacobi linear solver for Horn-Schunck computes 28*h*w FLOPS, where h and w are the height and width of the image respectively. The number of words transferred between memory and the processor is 9*h*w (to read variables Ix, Iy, It, Ix2, Iy2, du, dv, and to write variables du, dv). We can use this information to compute the arithmetic intensity (FLOPS/Byte) of this kernel. Arithmetic intensity is a measure of the memory-boundedness of a particular algorithm or implementation [15]. Depending on the balance of floating-point and bandwidth capabilities of a particular device, we can compute a limit on the achievable performance by multiplying the arithmetic intensity by the peak memory bandwidth, computed by the STREAM benchmark [16]. 28 The arithmetic intensity of the Jacobi optical flow kernel is 4∗9 = 0.778 FLOPS per byte. We measured a STREAM copy bandwidth of up to 52 GB/Sec on the Haswell reference machine with an array size set to match the working set of the Jacobi solver (compiler flags: gcc -O3 -fopenmp stream.c -o stream omp -DSTREAM ARRAY SIZE=396536, 8 threads). This means the max achievable performance for this algorithm on the Haswell reference platform, without cross-iteration memory optimizations, is 0.778 × 52, or 40.4 GFLOPS. Our implementation actually performs 13*h*w word transfers instead of the 9*h*w theoretical minimum because the framework breaks the inner loop into two OpenCL kernels. We are currently acheiving 3.21 GFLOPS, which is 8% of the 40.4 GFLOPS limit imposed by the bandwidth-bound, assuming 8
Horn-‐Schunck: Quality of Solu=on vs Joules 28
Average Angular Error (AAE)
26 24 22 HS Jacobi
20
HS CG HS PCG
18
HS RB
16 14 12 0
20
40
60
80
100
120
140
Joules
Figure 6: Quality of solution vs number of Joules spent for different Horn-Schunck linear solvers
ubar = D * du vbar = D * dv num = Ix * ubar den = Ix2 + Iy2 du = ubar - (Ix dv = vbar - (Iy
+ + * *
Iy * lam2 num) num)
# # vbar + It # # / den # / den #
9*h*w 9*h*w 4*h*w 2*h*w 2*h*w 2*h*w
FLOPS FLOPS FLOPS FLOPS FLOPS FLOPS
Figure 7: Number of FLOPS performed for each operation in the Horn-Schunck Jacobi linear solver
9
Ap0 = (D*p0 + Ix2 * p0 + IxIy * p1) Ap1 = (D*p1 + Iy2 * p1 + IxIy * p0) alpha = rsold / sum2d(p0 * Ap0 + p1 * Ap1) du = du + alpha * p0 dv = dv + alpha * p1 r0 = r0 - alpha * Ap0 r1 = r1 - alpha * Ap1 rsnew = sum2d(r0 * r0 + r1 * r1) beta = rsnew / rsold p0 = r0 + beta * p0 p1 = r1 + beta * p1 rsold = rsnew
# # # # # # # #
13*h*w FLOPS 13*h*w FLOPS 4*h*w FLOPS 2*h*w FLOPS 2*h*w FLOPS 2*h*w FLOPS 2*h*w FLOPS 4*h*w FLOPS
# 2*h*w FLOPS # 2*h*2 FLOPS
Figure 8: Number of FLOPS performed for each operation in the Horn-Schunck conjugate gradient linear solver no cross-iteration memory optimizations. In the future, we can work to improve our bandwidth performance. The application can also benefit from the cross-iteration memory optimizations. This includes blocking and tiling the Jacobi solver and employing communication-avoiding linear solvers. Figure 8 shows the number of FLOPS computed for the Horn-Schunck method using the conjugate-gradient solver. One iteration of the conjugate-gradient linear solver for HornSchunck computes 46*h*w FLOPS, where h and w are the height and width of the image respectively. The number of words transferred between memory and the processor is 15*h*w (to read variables du, dv, p0, p1, Ix2, IxIy, Iy2, r0, r1, and to write variables p0, p1, r0, r1, du, 46 dv). This means the arithmetic intensity of this kernel is 4∗15 = 0.766 FLOPS per byte. We measured a STREAM copy bandwidth of up to 33 GB/Sec on the Haswell reference machine with an array size set to match the working set of the Jacobi solver (compiler flags: gcc -O3 -fopenmp stream.c -o stream omp -DSTREAM ARRAY SIZE=509832, 8 threads). This means the limit imposed by the bandwidth-bound for this algorithm is 0.766 × 33 or 25.7 GFLOPS. We are currently acheiving 2.51 GFLOPS, or 9.7% of the limit. In the future, we can work to improve our bandwidth performance. After optimizing for bandwidth performance, we can investigate using communication-avoiding linear solvers, which can reduce both the amount of data transferred and the number of synchronizations performed. We compute the number of GFLOPS for the rest of the Horn-Schunck linear solvers using a similar approach. This allows us to compute the GFLOPS/W values in Table 3.
3.2 3.2.1
Lucas-Kanade Method Problem Formulation
The Lucas-Kanade method is works by examining local regions across a pair of image and computing a displacement vector for each local region. The method can be visualized using a figure from the original 1981 paper [12], shown here as Figure 9. The displacement vector for each local region is computed using a least squares solution to the optical flow equation (derived in Appendix A) solved simultaneously for each pixel in the region: 10
Figure 9: From the original Lucas-Kanade paper (1981): “We wish to find the disparity vector h which minimizes some measure of the difference between F (x + h) and G(x) for x in some region of interest R”.
Runtime per Frame (s) 0.02286
Average Power (W) 59.84
Energy per Frame (J) 1.368
# Iter. 1
Runtime per iteration (ms) 22.86
Energy per iteration (mJ) 1368
GFLOPS per Watt 0.0103
Table 4: Runtime and energy metrics for Lucas-Kanade optical flow using a 4x4 window size
∂I ∂I ∂I u+ v+ =0 ∂x ∂y ∂t
(2)
The Lucas-Kanade algorithm iterates solving this least squares problem and warping the image until a local minimum is found. This process is described succinctly in a review of HornSchunck by Baker and Matthews [4].
3.2.2
Pattern Decomposition
Figure 10 shows our implementation of Horn-Schunck that runs in Python, as well as our Hindemith framework. We’ve annotated the code with the input types, as well as the computational and structural patterns within the application. Like Horn-Schunck, this method consists of mainly the Dense Linear Algebra and Structured Grid computational patterns. This tells us that the application will be amenable to optimizations such as tiling and vectorization. However, there is a data-dependent array indexing operation, image warping, that falls under the Sparse Linear Algebra pattern. This means that we won’t be able to statically partition the computation given that dependences between operations are not known until runtime. 3.2.3
Profiles of runtime and energy analysis
We evaluate the runtime and energy performance of Lucas-Kanade optical flow using the same machine, methodology, and input data as was used for the Horn-Schunck analysis in Section 3.1.3. In this case, we only run one iteration of Lucas-Kanade and our window size is 4x4. The energy per iteration is much higher than Horn-Schunck, but the energy per problem is much lower.
11
def lk_oflow
(I1, I2, u, v, Gx, Gy):
Ix = Gx * I2 Iy = Gy * I2
# # # # #
Input images Flow vectors Gradient stencils Structured Grid Structured Grid
# Structural pattern: Iterator for i in range(2): WarpedI2 = warp_img2d(I2, u, v) WarpedIx = warp_img2d(Ix, u, v) WarpedIy = warp_img2d(Iy, u, v) ErrorImg = I1 - WarpedI2
# # # #
Sparse Linear Algebra Sparse Linear Algebra Sparse Linear Algebra Dense Linear Algebra
# Structured Grid du, dv = lk_least_squares(ErrorImg, WarpedIx, WarpedIy) u = u + du v = v + dv return u, v
# Dense Linear Algebra # Dense Linear Algebra
Figure 10: Code and pattern decomposition for Lucas-Kanade optical flow 3.2.4
Analysis of computation vs quality of solution trade-offs
Figure 11 shows the quality of solution (average angular error) of the Lucas-Kanade method for our benchmark image. The average angular error for the Lucas-Kanade method is lower than both the Horn-Schunck and the Brox methods for the same image. However, the Lucas-Kanade solution is much cheaper to compute. 3.2.5
Analysis of memory-boundedness
The Lucas-Kanade algorithm is dominated by the number of FLOPs required for the solution to the local least squares problems. This depends on the size of the window under consideration. For larger windows, the computation will likely be compute-bound, for very small windows the computation will most likely be memory-bound. We run our tests with a 4x4 window. In this case, the number of FLOPS computed per pixel is 2*2*winsize*winsize, plus 3 FLOPS for computing the error image and adding the displacements to the flow vectors. So the total number of FLOPS for our example is 67*h*w, where h and w are the height and width of the image. This FLOP count is used to compute GFLOPS per Watt in Table 4.
3.3 3.3.1
Brox Method Problem Formulation
The Brox method is a recent algorithm for optical flow that attains high-quality results but also comparitvely computationally intensive [5]. It is based on an energy-minimization approach
12
Lucas-‐Kanade: Quality of Solu