Quantitative Assessment of Operational Security: Models and Tools *
Marc Dacier** IBM Zürich Research Lab. Saumerstrasse 4 CH-8803 Rüschlikon — Switzerland Tel. +(41) 1- 724 85 62 Fax: +(41) 1- 710 36 08 Email:
[email protected]
Yves Deswarte LAAS-CNRS & INRIA
Mohamed Kaâniche LAAS-CNRS
7 Avenue du Colonel Roche 31077 Toulouse Cedex — France Tel. +(33) 05 61 33 62 88; +(33) 05 61 33 64 05 Fax: +(33) 05 61 33 64 11 Email:
[email protected];
[email protected]
LAAS Research Report 96493 May 1996
Abstract This paper proposes a novel approach to help computing system administrators in monitoring the security of their systems. This approach is based on modeling the system as a privilege graph exhibiting operational security vulnerabilities and on transforming this privilege graph into a Markov chain corresponding to all possible successful attack scenarios. A set of tools has been developed to generate automatically the privilege graph of a Unix system, to transform it into the corresponding Markov chain and to compute characteristic measures of the operational system security. Keywords: quantitative security evaluation, privilege graph, Markov modeling
1. Introduction Computing system security relies mostly on users, operators and administrators, and even the best designed system, if badly operated, would be unsecure. Most authentication and protection mechanisms can be diverted by malicious or careless users, then allowing possible intruders to perform security breaches. This is not surprising since most users are less interested in security than in efficiency, flexibility and cooperation with other users. A scrupulous system administrator should try to maintain the best security for his system with the least incidence on user operation. It is thus tremendously important to assess the security level of the operational system and to monitor the evolution of this security level with respect to system configuration modifications, application or operation changes and environment evolution. This paper develops an approach to evaluate the security of operational computing systems. Examples are taken from Unix™ systems, but the approach could be extended to other operating systems and to distributed systems as well. Section 2 shows how to model a computing system in a way exhibiting vulnerabilities that could be exploited by a possible * **
This paper is an extended version of [Dacier et al. 1996] This work has been done when Marc Dacier was working at LAAS-CNRS 1
intruder. Section 3 presents a mathematical model which enables to compute probabilistic security measures corresponding to the difficulty for a possible intruder to perform a security breach. Finally, Section 4 describes a set of tools which have been developed to support this approach, and to provide automatic security evaluation of Unix systems in operation.
2. Description of operational system vulnerabilities It has been shown in [Dacier & Deswarte 1994] that vulnerabilities can be represented in a privilege graph. In such a graph, a node X represents a set of privileges owned by a user or a set of users (e.g., a Unix group). An arc from node X to node Y represents a possibility for a user owning X privilege set to extend his privileges to obtain those of node Y. A security breach can occur when a path exists between a node representing a possible attacker’s privileges to a node representing an attack target. For instance, an attacker node can be “outsider”, representing the privileges granted to those who are not registered users (e.g., the privilege to execute anonymous ftp) or “insider” which represents the minimal privileges of any registered user (e.g., the privilege to execute login, to change his own password, etc.). A target node can be the node representing the superuser privileges, or the privileges of a particular user owning some very secret files. As a matter of fact, the vulnerability represented by an arc is not necessarily a security flaw, but can be the effect of a system feature designed to improve security. To show this, we consider three examples based on Unix: a) The .xinitrc file: when running, the X Window System initializer looks for a specific file in the user’s home directory, called .xinitrc, to run as a shell script to start up client programs. Daily practice shows that novice users can encounter some difficulty to correctly configure this file. If a novice user trusts another user, more expert in X Window than himself, he may prefer use the expert’s configuration file rather than bother to understand all the commands and options. To do so, an easy solution is to establish a symbolic link1 between his own .xinitrc file and the expert’s file. Then, if the so-called expert enhances his set-up file, the novice will enjoy the result as well. From a security point of view, this can be a good solution. Indeed, if the novice chooses inappropriate options or commands, this file will turn out as a trapdoor, letting his data unprotected. Using the expert’s file — who should be aware of the vulnerabilities — his data security is enhanced. Of course, he is at the mercy of this expert who can introduce a Trojan horse in his configuration file, and then acquire most of the novice’s privileges2. b) The .rhosts file: to log in a Unix system, a password is required. However, there is a mechanism in Unix that allows remote trusted users to access local system without supplying a password. This functionality is implemented by the .rhosts file which
1
ln -s ~expert/.xinitrc ~novice/.xinitrc
2
Actually, the expert cannot acquire all the novice’s privileges since, for instance, without knowing the novice’s password he will not be able to change it. Other specific privileges could be denied to the expert due to the fact that, for instance, he is not physically located at the same place than the novice, etc. 2
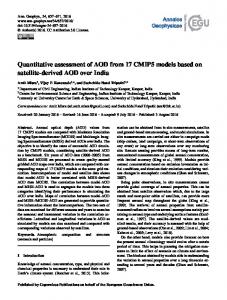
enables to bypass the standard password-based authentication: if in John’s home directory there is a .rhosts file which contains Fred’s username, then Fred, when logged in another machine, can establish a remote connection to John’s machine and be identified as John on this machine, without typing John’s password. Once again, this allows John to grant Fred almost all his privileges. This feature is frequently used, for instance if John wishes Fred to take care of any urgent work during his vacations, without giving him his own password. Another advantage of this feature is to enable remote login without transmitting a password on the network where it would be vulnerable to wire tapping. But, if such a file exists, any user who has write access to John’s .rhosts can get his set of privileges. c) Setuid files: in Unix, every process holds the same privileges as the user for whom the process is run. However, it is possible to let a process get the privileges of the owner of the program rather than the privileges of the user initiating the process. This is particularly useful when an operation needs more privileges than held by the user. An example of this is the program /bin/passwd that changes user passwords: every user must be able to change his own password but this operation requires to write in a protected file, usually the /etc/passwd file, to which no user has write access except the superuser; to do so, /bin/passwd uses the setuid facility to run with superuser privileges on behalf of less privileged users. This functionality has many other applications, all of them being examples of grants of sets of privileges by the owner of the program to the user of the program. As long as these setuid programs are correct and no low privileged user can create or modify such programs, the security is satisfactory. Indeed, this feature strengthens security since, without this feature, users should be granted more privileges constantly. But if a setuid program owner trusts another user and gives him write access to his program, he is at the mercy of this user. These examples show also that vulnerabilities can be identified by analyzing the system configuration, and in particular the file system: to each class of vulnerability corresponds some specific information in a file or a directory. Automatic tools, such as COPS [Farmer & Spafford 1990], are able to enumerate such vulnerabilities by exploring Unix file systems. We have built a similar tool, called ASA, to create automatically the privilege graph, and to label each arc in the graph with the class of vulnerability it represents. Figure 1 gives an example of such a privilege graph, with arcs being labelled by vulnerability classes.
3
5
A
5
2 2
P1 6 1
B
5
5
Xadmin 5
3
3
G
filtre
4
5
5
C D
5 2
5
1
3
E
P2
2 5
5
soft
admin
3 1
insider
5
F
1) X can guess Y's password; 2) X is in the Y's “.rhost”; 3) Y is a subset of X; 4) X can attack Y via Email; 5) Y uses a program owned by X ; 6) X can modify a “setuid” program owned by Y.
Figure 1: Example of a privilege graph
3. A Probabilistic Approach for Security Assessment The privilege graph associated with an operational system highlights system vulnerabilities which an intruder can take advantage of. Some of the identified flaws have to be eliminated, however, some other vulnerabilities may correspond to functionalities required by the users since they provide flexibility of use and ease of information sharing. In this situation, the security administrator has to decide: which flaws can be ignored and which ones must be eliminated. This decision can be supported by the evaluation of the risks induced by the residual flaws. Hence, it is important to develop a method which enables to evaluate the impact of residual flaws on operational security. In the following, we present an example (the maze analogy) which outlines the main properties that we believe should be satisfied by the model chosen for security evaluation. Then, we propose a modeling framework for security evaluation which allows these intuitive properties to be satisfied.
3.1 The “Maze” Analogy The privilege graph can be compared to a maze where the nodes correspond to rooms and each arc between two nodes corresponds to a door that allows access from one room to another. Each door can be opened in a single direction, and once opened it cannot be closed. The doors are transparent so that one can see the content of the rooms that can be directly accessed from them. Each door is equipped with a lock, the locks are of different qualities and the difficulty of breaking them is variable. Each one can be characterized by a failure rate which equivalently determines the success rate of the breaking process applied to each lock. One of the rooms contains a target which may be accessed by an attacker placed in an another room of the maze. The attacker has no knowledge of the whole topology of the maze and he has to try to reach the target. However, the attacker knows all the mechanisms that are available to break the 4
locks. He has to apply one mechanism to each lock and wait until the lock is broken. During this waiting time he can apply other mechanisms and try to open other doors. Let us assume that the attacker has two main qualities which characterize any human being: • Memory: he remembers all the rooms he has already visited and the rooms that can be accessed from them. • Common sense: he will not try to break a lock allowing access to a room he has already visited from another room. Based on this example, we would like to analyse how well the target is protected and identify the factors that allow the attacker to reach the target with more or less difficulty. Different situations are studied hereafter. Direct path. Let us suppose that the attacker is in the room which is directly connected to the target and he has only to open one door to succeed. Then, his rate of success is inversely proportional to the difficulty of breaking the corresponding lock. If there is only one path leading to the target such that each room has only one door to get into the following room (direct path), then the difficulty cumulated by the attacker to reach the target is proportional to the number of doors he has to open and also to the reliability of each lock he has to break. In this case, the cumulated difficulty can be estimated by adding the difficulties associated with each lock he has to break: this is similar to the evaluation of path length in graph theory. Multiple path. Let us assume that there are two direct paths leading to the target. Undoubtedly, the target is less protected than in the previous case due to the existence of the second path. Indeed, the attacker can simultaneously apply the mechanisms available to break different locks. Then, his rate of success depends on the failure rates of the locks which are simultaneously addressed. Major impact of the shortest path. The shortest path is the one which allows to reach the target with the lowest cumulated difficulty. It is likely that the least reliable lock (i.e., with the highest failure rate), will be easier to break than the others; then, the lowest cumulated difficulty up to the target is mainly given by the shortest path. However, since the attacker does not know the whole topology of the maze, he may decide to choose another path if he believes that it will lead him to reach the target. At each step where different possibilities are offered to him, he has to make a choice. Then, all the paths have to be considered to estimate the cumulated difficulty up to the target. Intuitively, the cumulated difficulty taking into account all the paths will be of the order of magnitude of the shortest path divided by the number of paths having this value. The remaining paths will have less impact on the final value. Security evaluation: intuitive properties. The maze analogy allows us to derive some intuitive properties that should be satisfied by the quantification model to be chosen for security evaluation based on the privilege graph: P1: Security increases if the “length of the paths” leading to the target increases. P2: Security decreases if the “number of paths” leading to the target increases. P3: Security is mainly affected by the shortest path leading to the target. In the following, we propose a modeling framework which satisfies these intuitive properties. Firstly, we introduce two basic variables (Time and Effort) which allow us to define 5
a measurement scale in order to rank potential attacks and evaluate security, and we explain how they can be estimated. Then, we present a framework based on Petri nets allowing the privilege graph to be transformed into another model which is well suited for quantification.
3.2 Quantification Variables for Security Assessment The first step towards operational security quantification is to define significant variables that can be used to characterize and evaluate security. Ideally, the identification of these variables should be based on the analysis of real life data describing the occurrence of —successful or unsuccessful— intrusions in operational systems. Unfortunately, as far as we know, this kind of data is not available. Nevertheless, valuable information can be obtained from the analysis of some well known intrusions described for instance in [Reid 1986, Stanley 1986, Spafford 1988, Stoll 1988, Rochlis & Eichin 1989, Seeley 1989, Cheswick 1991, Stanley 1991, Bellovin 1992]. Unfortunately, these intrusions are rare and cannot be considered as a representative sample. These data can be complemented by additional information provided by security experts concerning the definition of potential intruders profiles. For instance in [Denning 1990], it is suggested that most intruders apply well known breaking methods. Similar conclusions were derived from a pilot experiment described in [Olovsson et al. 1995] in which students from the Chalmers University Computer Club have been asked to try to break into a target Unix system. It has been observed that all the students used well known breaking techniques published in popular books dealing with Unix security, for instance [Wood & Kochan 1987, Curry 1990, Spafford & Garfinkel 1991], or reported in newsgroups, for instance “comp.unix.security”. Moreover, the attackers generally applied attacks which are easy to implement and also those which have a high probability to succeed in short time. It is likely that this kind of profile will be more and more representative of most intrusions since the current trend in the security community is to extend the diffusion of known breaking techniques in order to promote the implementation of security mechanisms in operational systems. Moreover, it appears that “Effort” and “Time” spent by a potential attacker to reach the security target play a major role in the intrusion process. We believe that these variables are sufficient to characterize the potential intrusion process. Indeed, some kinds of attacks, for instance Trojan Horses, require a small amount of effort to be spent by the attacker for their implementation, however a long period of time may pass before the attack is successful. Other attacks are complex, but once implemented their effect is immediate. Combinations of both kinds of attacks are also possible. A priori, it is difficult to define a unique variable that integrates the effects of both “Effort” and “Time” without leading to a loss of pertinent information. As a consequence, we have chosen to derive evaluations with respect to both variables and then to analyse simultaneously the results obtained. In the following we present some intuitive properties that characterise the evolution of security with respect to “Time” and “Effort” together with some illustrative examples.
3.2.1 Security Evolution with respect to “Time” Security is directly proportional to the time needed by an attacker to succeed in his attack. This is supported by the following considerations: 6
• •
The probability that the presence of an intruder in a system is detected, and then the interruption of his process, increases with the time he spends in the system. The probability for an attack to be selected by an intruder decreases with the expected time required for the success of the attack.
Let us consider the following example. Suppose that B can write in the .xinitrc file of A. B can launch an indirect attack against A by inserting some malicious instruction in this file. This is represented in the privilege graph by an arc from B to A. If A never uses X-Windows facilities, then B has no chance of succeeding his attack. However, the risk exists and the time required for the success of the attack is infinite. As a matter of fact, the probability for the success of an attack during a period of time is proportional to the frequency of use of the program. Other kinds of attacks also depend on time. For instance, password guessing requires the analysis of a huge number of combinations of words. The definition domain (i.e., the sequence of characters) of the password determines the probability of cracking the password in a given period of time [Riddle et al. 1989, Spafford & Garfinkel 1991]. One can also mention other attacks which require an action on the part of the attacker only and for which “Time” plays a major role for the success of the attack: for instance, analysis of data transmission through a network, analysis of memory content, periodic inspection of user display screens, etc. It is noteworthy that, in these situations, security increases as the time required for the success of an attack increases.
3.2.2 Security Evolution with respect to “Effort” Security is directly proportional to the effort required for the implementation of an attack. Indeed some attacks require a deep knowledge of the system and only few attackers may have this information. For instance, some intrusions can be achieved by memory modifications; these intrusions are not well known since they are specific to the operating system of the target (this is also the case of intrusions via daemon fingerd in Unix systems described in [Spafford 1988]). Other attacks require the availability of complex, expensive hardware that only few attackers may possess; for example, some passwords may be catched by the analysis of electro-magnetic radiation from screens or keyboards by a specific hardware. Moreover, the implementation of some attacks is so fastidious that only few obstinate attackers may try them; for instance, creating in a specific directory a large number of files containing mistyped common commands.
3.2.3 Estimation of “Time” and “Effort” Based on the observation that most attacks applied by potential intruders rely on well known breaking techniques we believe that it is possible for security experts who have a deep knowledge of the system under study (for instance a Unix system) to build a database gathering identified breaking rules and then assign “Time” and “Effort” values to each attack. As regards the estimation of “Time” and “Effort” values relative to each attack, we propose the following approach.
7
Time estimation. Time plays a major role in all Trojan Horses based attacks. Obviously, it is impossible to estimate the amount of time an attacker should wait for before he succeeds in his attack. However, if we know the activation rate of most used commands, we can estimate the probability for a Trojan Horse to be activated in a given interval of time. Indeed, the success rate of the attack depends on the target user profile; for instance the success rate of an .xinitrc file based attack is directly proportional to the frequency of use of X-window by the target user. Tools are available for statistical estimation of user profiles based on the analysis of the users behaviour and of their interactions within the system. These tools have been developed for intrusion detection, for instance IDES [Lunt et al. 1990] and more recently NIDES [Javitz & Valdez 1994] which can be used in Unix environments. Then, we can use the statistical profiles provided by such tools in order to estimate the success rates relative to the attacks identified in the privilege graph, without relying only on security experts judgement. Moreover, these statistical profiles can be continuously updated in real-time which allows to observe dynamically the variation of estimated values of the success rates of the attacks. Effort estimation. Estimation of effort is more difficult, but it is possible to define a measurement scale allowing to order the different attacks according the difficulty of implementing them. We propose a 4-level rating scale as an example: • the lowest level (Level 1) corresponds to the least difficult attacks (well known attacks frequently used by intruders in reported detected intrusions), • Level 2 corresponds to known attacks which have been seldom used by intruders, • Level 3 gathers sophisticated attacks which are theoretically possible but never recorded in detected intrusions in the field, • Level 4 includes sophisticated attacks that require the intruder to be physically close to target system. Note that, since our main objective is to define a quantification scale to observe security evolution, we do not need to have too much levels for ranking attacks. Moreover, having a reduced number of levels will allow easier interpretation of the security quantification results.
3.3 Intrusion Process Model In the previous sections, we have mentioned that security may be affected if at least one path leading to the specified target exists, i.e., if at east one attack scenario can succeed. Nevertheless, we didn't clearly explain yet how these scenarios can be identified from the privilege graph. This is the aim of the following section. A Assumptions Let us consider the privilege graph given in Figure 2. Each arc in the graph refers to a specific attack. In order to derive all the scenarios of attacks that might be made by the user “insider” in order to reach the user A, we need to make assumptions about the behavior of this potential intruder. As real data characterizing intruders profiles are not available, we have derived a minimum set of assumptions which are based on common sense: A1) A priori, the intruders do not know the whole topology of the privilege graph. They only know the attacks that can be directly applied in a single step. 8
A2) The intruders have a good memory. They remember all the sets of privileges they already acquired during the intrusion process. A3) The intruders are sensible. They will not attempt an attack which would give them privileges they already have. The last two assumptions are clearly realistic. The first assumption is justified by the fact that any one who wants to build the whole privilege graph needs all the set of privileges described in the graph. If the intruder already has these privileges, then he does not need to build the graph! Finally, we should note that the intrusion process is stopped when the target is reached. 3
P1
7
A
B
6 X admin
5
1
4 2
insider
F
Figure 2: Example of a privilege graph
Let us examine the scenarios of attacks that can be followed by the user “insider” to obtain user A's set of privileges. • At the beginning, he knows that attacks 1 and 2 are possible. • Suppose that he chooses attack 1; at the next step he has the choices between attacks 3 and 2; indeed based on assumption 2, the intruder remembers that he has the possibility to try attack 2 that he did not apply at the previous step. • If at this step he successfully applies attack 3 then the target is reached and the intrusion process is stopped. • However, if he tries attack 2 after 1, then he will have the same set of privileges as if he tries attack 2 followed by 1. At this step, he has the choice between attacks 4 and 3, etc.
9
I
1
2
IP1
FI
3
2
AIP1
1
FIP1
4
3
FIP1 X
AFIP1
3
6
AFIP1 X
FIP1
3 AFIP1
3
AFIP1 X
4
AFIP1 X
FIX
4
1
5
FIP1 X
FIP1 X
BFIX
6
3
AFIP1 X
6
AFIP1 X
ABFIX
5
BFIP1 X
5
BFIP1 X
6
BFIP1 X
6
ABFIP1 X
AFIX
6
AFIP1 X
5
6
ABFIP1 X
3
3
3
ABFIP1 X
ABFIP1 X
ABFIP1 X
7
BFIP1 X
BFIP1 X
6
6
ABFIP1 X
1
6
ABFIP1 X
3 ABFIP1 X
ABFIP1 X
3 ABFIP1 X
Figure 3: Intrusion process state graph summarising the scenarios of potential attacks
B Intrusion process state graph Figure 3 plots the complete state graph3 characterizing the intrusion process derived from Figure 2. States transitions occur when new privileges are obtained. The arcs between states are labelled by the names of the attacks corresponding to new privileges acquisition. When the process moves from one state to another one, the set of privileges indicated in the new state includes all the privileges obtained in the already visited states. Blacked states indicate that the target has been reached. It can be noticed that depending on the path followed by the intruder, there are some states in the graph from which some possible transitions have been discarded. This is due to assumption A3. For instance, from state BFIP1 X only attacks 3 and 6 are taken into account; attack 7 is discarded because it corresponds to the acquisition of P1 privileges which have already been obtained by the intruder. Figure 3 can be simplified since different states are duplicated due to assumption 2 mentioned above. For instance state FIP 1 can be reached by applying the scenarios 1-2 or 2-1. Hence, duplicated states can be grouped together; the simplified graph is given on Figure 4. It is noteworthy that when different transitions lead to the same state starting from a given state, only one transition is plotted which is labelled with the corresponding transitions names ("3 or 6" for instance).
3
To improve the clarity of the figure, X admin and insider are respectively referred to as X and I. 10
I
1
2
IP1
FI
2
1
4
FIP1
FIX
4
1
5
FIP1 X
BFIX
5
1 or 7 BFIP1 X
3
3 AIP1
AFIP1
3 or 6
3 or 6
AFIP1 X
ABFIP1 X
6 ABFIX
6 AFIX
Figure 4: Simplified intrusion process state graph
It is possible to generate automatically the simplified intrusion process state graph by transforming the privilege graph into a Petri net [Peterson 1981]. Each node and arc are transformed into a pattern in the Petri net constituted of a set of places, transitions and arcs. These patterns enable to implement the three assumptions A1, A2 and A3. The simplified intrusion process state graph is obtained by generating the marking graph of the Petri net (See Annex for further explanation).
3.3 Mathematical Model For Security Quantification In the previous sections, we have introduced the main concepts allowing us to derive the scenarios of attacks that can be performed by a potential intruder to reach a specified target. We have also identified two variables “Time” and “Effort” that can be used to rate the different attacks described in the privilege graph. A transition rate is associated to each attack in order to estimate the mean effort and the mean time to succeed in the corresponding attack (i.e., for a single attack). The last step in our approach concerns the definition of a mathematical model that allows us to evaluate the mean effort and the mean time to reach the target (i.e., that takes into account the identified paths leading to the target). The evaluation of these measures requires the definition of a mathematical model and the specification of the probabilistic distributions that characterize the intrusion process. This topic is addressed in this section: we propose a Markovian framework for security evaluation and show that the intuitive properties introduced in the previous sections concerning security evolution with respect to “Time” and “Effort” are satisfied by the proposed model.
3.3.1 Mathematical Model The choice of a mathematical model for security evaluation should undoubtedly be based on plausible assumptions in order to obtain significant results. Any model is an approximation of reality, with some unavoidable trade-offs between plausibility and usability. Our investigations led us to choose a Markovian model which satisfies the following requirements: 1) the results derived from the model are consistent with the intuitive properties regarding security evolution, 11
and 2) the model is mathematically tractable. In the following we briefly outline some results which support this statement considering the “Time” variable. The same justifications also apply to the “Effort” variable. The Markov model is based on the assumption that the probability to succeed in a given attack before time t is described by an exponential distribution given by: P(t) = 1- exp(-λ t). P(t) is a monotonically increasing function which is initially equal to zero and asymptotically reaches 1. Practical considerations derived from the use of this distribution are the following: • The potential intruder will eventually succeed in reaching the target, if a path leading to the target exists, provided that he spends enough time. • The rate to succeed in a given attack is constant with respect to time4. • The mean time to succeed in a given attack is given by 1/λ. The last point is particularly valuable since the knowledge of the attack rates is sufficient to characterize the whole distribution. These rates can be estimated as discussed in Section 3.2.3. Furthermore, the use of a Markov model allows us to use Stochastic Petri Nets to build automatically the intrusion process state graph from the privilege graph. The state graph obtained in this case is also a Markov chain that can be processed by conventional Markov tools. It is noteworthy that Markov models are widely used for dependability evaluation and the mathematical properties of these models have been extensively discussed in the literature. Clearly, Markov models fit our requirements from a usability point of view. Plausibility of the model is discussed hereafter.
3.4.2 Model Validation with respect to Intuitive Properties Various probabilistic measures can be derived from Markov models, among these, the MTTF (Mean Time To Failure) which characterizes in our context the mean time for a potential intruder to reach the specified target. This metric allows easy physical interpretation of the results: the higher the MTTF the better the security. Moreover, simple analytical expressions can be easily obtained and analysed in order to check the plausibility of model results. Indeed, for acyclic Markov state graphs5, the MTTF is given by the sum of the mean sojourn times in the states leading to the target which are weighted by the probability of visiting these states. The mean sojourn time in state j, denoted as Tj, is given by the inverse of the sum of state j's output transition rates:
/
Tj = 1 Erreur!)
(1)
Let us denote by MTTFk the mean time to failure when state k is the initial state and Pkl the conditional probability transition from state k to state l, then: MTTFk = Tk +
∑
Pkl × MTTF kl ; Pkl = λ kl × Tk
(2)
l∈out(k)
4 5
The probability to succeed in a given attack in [0, dt] is equal to the probability to succeed in [t, t+dt] given that the intrusion did not succeed before t. Clearly, the intrusion process state graph derived from the privilege graph is always acyclic due to assumption A2 which requires any state in a path of the graph can not be visited more than once. 12
out(k) is the set of output transitions from state k and λ kl is the transition rate from state k to state l. Using the analytical expression of MTTF, let us analyse the different cases considered in the maze analogy example and check whether the intuitive properties introduced in Section 3.1 are satisfied by the Markov model. Direct path. Let us consider the example given in Figure 5 in which only one path is possible to reach the target. In this case, the MTTF is given by ∑1/λj where k is the number of j=1..k
arcs in the path and λ j is the success rate associated to attack j. Clearly, as the number of arcs increases, the MTTF increases and the security improves. Also, when the values of λ j increase, the MTTF decreases and the security degrades. These results are consistent with the intuitive properties presented in Section 3.1.
X
λ1
Y
λ2
λk
Z
W
Figure 5: Markov graph corresponding to a direct path
Multiple path. Let us consider the example of Figure 6 where X is the intruder and Z is the target. The privilege graph indicates the presence of two paths leading the target. The Markov graph identifying the scenarios of attacks that are possible to reach the target is also given. In this graph, each state is represented by three binary variables identifying the possession of privileges X, Y and Z. Let us respectively denote by T1 and T2 the mean sojourn times in states (1,0,0) and (1,1,0). Application of equations (1) and (2) leads to: λ1 1 1 T1 = λ + λ ; T2 = λ + λ ; P12 = λ + λ (3) 1 3 2 3 1 3 λ1 1 1 MTTF1 = T1 + P12 × MTTF2 = T1 + P12 × T2 = λ + λ + λ + λ × λ + λ (4) 1 3 1 3 2 3 It could be seen that, for any value of λ1, λ 2 and λ3, the expression of MTTF1 is always lower than 1/λ1 + 1/λ2 (which corresponds to the case where only the first path exists), and to 1/λ3 (which corresponds to the case where only the second path exists). This result illustrates the fact that the suppression of any path leading to the target in the privilege graph surely leads to an increase in the value of the MTTF which indicates security improvement. This result can be easily generalized. In fact let us consider a privilege graph and generate the associated intrusion process state graph. The suppression of a path from the privilege graph is equivalent to considering that one of the arcs belonging to this path in the corresponding state graph has a transition rate equal to zero. The choice of the arc to be cut from the corresponding path is irrelevant. Let us suppose that λz the transition rate of the last arc of the path leading to the target is equal to zero. In the MTTF expression, λ z appears in the denominator of some Ti and Pij; if λz is equal to zero, then the values of all these Ti and Pij increase since ∀ X, Y, δ >0, X Y
X
> Y+δ . As a result the contribution of Ti and P ij to all the components of the MTTF expression in which they are involved increases, and the MTTF also increases. Therefore, if we cut one path from the privilege graph the security surely improves. 13
(1,0,0)
Z
λ2
λ1
λ3 Y
λ1
‡
(1,1,0)
λ2
(1,1,1)
λ3
(1,1,1)
λ3
(1,0,1)
X
(a) Privilege graph (c) Markov graph Figure 6: Multiple path—example
Major impact of the shortest path. From the previous examples, it can be seen that the mean time to reach the target is always lower than the mean time calculated based on the shortest path only. However, due to the weighting factors Pij the shortest path has always the major contribution to the final value of the MTTF. Let us consider again the example of Figure 6, and let λ1= λ2 = λ3 /10 = λ. In this case, we assume that the direct path from X to Z is faster than the other path via Y. If we substitute these values in the expression of the MTTF calculated above, it can be seen that the contribution of the direct path (= 1/10λ) is of the same order of magnitude of the final value of the MTTF ( = 12/121λ) and the contribution of the second path via Y is negligible. This result is always true.
4. Evaluation Tools In order to show the feasibility of our approach, we have developed a prototype integrating a set of tools allowing the implementation of the different steps of the approach in order to evaluate the operational security of a Unix system. Figure 7 presents an overview of its graphical interface. Black boxes represent tools while white boxes represent inputs (resp. outputs) given to (resp. produced by) the tools. The complete procedure consists of four different phases which are detailed hereafter. 1) Building the privilege graph: in a first step, we model the system under study by building its privilege graph. As mentioned in Section 2, we have developed a tool, named ASA for Automatic Security Advisor, to construct automatically the privilege graph related to a Unix system. Therefore, ASA looks for known vulnerabilities present in the system under study. So far, ASA is using many procedures included in the COPS package [Farmer & Spafford 1990]. 2) Definition of the security policy: in this step, the security targets and the potential attackers are specified. In terms of the privilege graph, this comes to define two sets of conflicting nodes respectively representing the targets (what must be protected) and the attackers (against whom). This phase is facilitated by the use a graphical language called Mirò [Heydon 1992]. 3) Evaluation Phase: the privilege graph is transformed into a Stochastic Petri Net. The output of the tool “Security Policy” is used to generate different initial markings using the tool
14
BuildPetri6. The reachability graph corresponding to each marking is derived and some security measures are evaluated using the tool EvaluateSecurity. 4) Presentation of the results: the results are processed according to some selection criteria defined by the tools ProcessResults and DisplayResults in order to be displayed on the graphical user interface of the prototype in an efficient way.
5. Example In order to illustrate some results that can be obtained with our approach, let us consider the example already presented in Section 2. In Figure 8, the thickness of the arcs characterizes the difficulty of the attacks: the thicker the arc, the easier the attack. In this figure a unit failure rate corresponds to one success of the corresponding attack per week in average; 0.2 corresponds to one success per month, etc. To characterize very easy attacks (quasi-instantaneous transition firing) we have attributed to them a very high transition rate value: 5000. The users identified in the privilege graph were grouped into different sets according to the roles assigned to them in the system (see Figure 9). For instance users A and E belong the same group “Professor”, additionally A belongs to “Proj1” and E also belongs to “Proj2”.
Figure 7. Tools set for operational security evaluation
6
BuildPetri&PruneGraph is an improved version of BuildPetri, the definition of which resides beyond the scope of this paper. 15
Mean time to fire the transition qu asi-instantaneous (0.000 2)
9
A 2 2
P1 12
B
6
7
6
Xadmin 7
3
1
3 3
G
filtre
4 8
o ne d ay (0.2)
8
C
8
one week (1)
2
D
7
11
E
P2
2 5
6
so ft
admin
3
one month (5) one yea r (50)
8
10
insider
one hour (0.02 )
F
1) Y has no password; 2) X is in the Y's “.rhost” ; 3) Y is a subset of X; 4) X can attack Y via Email; 5) Y uses a program owned by X (one time per hour); 6) Y uses a program owned by X (one time per day); 7) Y uses a program owned by X (one time per week); 8) Y uses a program owned by X (one time per month); 9) Y uses a program owned by X (one time per year); 10) X can guess Y's password in a week; 11) X can guess Y's password in a month; 12) X can modify a setuid program owned by Y.
Figure 8: Example
A
E PROF1
F
G
internal
SYSTEM
insider
PROF2
PROFESSOR B
C PhD D
P1
P2 STUDENT
PROJ1
PROJ2
Figure 9. Grouping the users according to their roles in the system
Let us assume that A, E and F are the security targets that we want to protect from potential intruders. Based on this example, we have analysed different case studies considering in each case a different set of potential intruders, and we have evaluated the corresponding MTTF in order to identify the nodes in the privilege graph which have the most impact on system's security. The MTTF values obtained are given in Figure 10 in an increasing order for various possible attackers. The lessons learned from Figure 10 are summarized hereafter. • Considering the three targets together, the most threatening groups are PROJ1 (A, B, D, P1), PhD (C, D) and SYSTEM (F, G). The analysis of the privilege graph shows that this situation is mainly due to the presence of an arc between B and G which allows other users from PROJ1 to reach easily the specified targets. • The MTTF to reach A from PROJ1 is around 0.98 (≈ 1 week) which almost corresponds to the contribution of path B-Filtre-G- Xadmin-A. 16
Target A: MTTF
Target E: MTTF
Target F: MTTF
PROJ1:
0.980980
PROJ2:
1.000000
PhD:
0.191057
PhD:
0.980984
PhD:
1.000200
SYSTEM:
0.199540
SYSTEM:
0.983763
SYSTEM:
1.020092
PROJ1:
0.199734
insider:
1.143936
PROJ1:
1.200590
insider:
0.305684
STUDENT:
1.176475
insider:
1.314162
PROFESSOR:
0.364364
PROJ2:
2.983863
PROFESSOR:
1.400790
STUDENT:
0.399934
PROFESSOR:
2.984063
STUDENT:
1.400790
PROF1:
0.399934
PROF2:
2.983863
PROF1:
1.400790
PROJ2:
2.095333
PROF2:
2.095333
Figure 10. MTTF (in # weeks) evaluated for different attackers
•
•
The low value of the MTTF from insider to F (0.305) indicates that the evaluated threat mainly results from path insider-P1-B-Filtre-G-Xadmin-F rather than from insider-F. Note that the presence of this path can be easily detected since the calculated value is lower than the MTTF obtained when only the path insider-F is considered (equal to 1). This is an easy way to identify the presence of multiple paths leading to a given target in a large privilege graph. The existence of multiple paths between an intruder and a target have a major impact on security. For instance, the group PROF2 which contains user E only, can easily obtain user F privileges (MTTF≈ 2 weeks) while the length of all the paths between E and F is more than 4 weeks (because all these paths contain either P2-F or P2-G).
To reduce the impact of node B on the security of the targets, some modifications have to be made. For instance: "Cut the arc Filtre-G and reduce the value of the transition rate P1- B". Practically, in this case, G will be required to use no longer the electronic mail filter implemented by B; moreover, B will be asked to execute the programs owned by “P1” using an entry in P1’s .rhost instead of executing these programs under his own identity(with setgid bit set for the program). Moreover, in order to reduce the impact of node P2, we have reduced the value of the transition rate P2- E (E will use the P2's program once a year instead of once a week)7. The new MTTF values obtained after these modifications are given in Figure 11. It appears that the security of Target E in the new configuration has been dramatically improved since the MTTF is around 1 year (compared to 1 week in the previous case). This is due to the fact that all paths leading to E contain the transition P2-E which is now an attack with a low success rate. Moreover, it appears that target A is still threatened by “insider”, not because of node B (as this was the case in the initial situation) but rather due to the presence of path insider-F whose influence has been masked in the initial situation by the impact of path insider-P1-BFiltre-G-Xadmin-F. This example, illustrates some interesting analyses that can be made using the proposed evaluation tools. Additional modifications can be investigated using the prototype in order to check whether these modifications may have an impact on system security.
7
Of course P2 can use a local copy of P2's program, however this copy may have to be updated once a year. 17
Target A: MTTF
Target E: MTTF
Target F: MTTF
SYSTEM:
0.983763
PROJ2:
50.000000
SYSTEM:
0.199546
insider:
1.929514
PhD:
50.000200
insider:
0.987739
PhD:
2.866150
SYSTEM:
50.020092
PROJ2:
2.095333
PROJ2:
2.983863
insider:
50.979290
PhD:
2.095533
PROFESSOR:
2.984063
PROJ1:
54.000200
PROFESSOR:
2.095533
PROF2:
2.984063
PROFESSOR:
58.000400
PROF2:
2.095533
PROJ1:
6.357536
STUDENT:
58.000400
PROJ1:
6.095533
STUDENT:
9.590511
PROF1:
58.000400
STUDENT:
10.095733
PROF1:
10.095733
Figure 11. MTTF (in # weeks) evaluated after privilege graph modification
6. Potential Applications and Conclusion The deliberately simple example presented in the previous section allowed us to illustrate some advantages of our approach. However, the proposed approach can be applied to more complex case studies. We are currently working on some enhancements of the prototype in order to allow efficient application of the approach to real life systems. Various potential applications of the proposed approach are summarized hereafter. 1) Monitoring of the operational security. Once the security policy defined, each phase of the evaluation process is completely automated. Therefore, it is possible to use the prototype every night to monitor the system security evolution. A degradation of the results can highlight the introduction of some new vulnerabilities due to, for example, the installation of a new software or the registration of new users. Also, such a modification of the values can be useful to detect a malicious user, stealing, day after day, new privileges from other users. 2) Simulation and deduction. Protecting the system is one thing, using it is another one! Indeed, it is a fact that the security constraints are sometimes conflicting with the requirements of the users. Most of the time, users ask for widely open systems, ease of use and flexibility while the security administrator tries to keep the sensitive information as protected as possible. Our prototype can help the administrator to manage this kind of problems. If he must improve the security of his system, he can evaluate the effectiveness of different possible configurations by modifying the privilege graph. Once the “best” modification identified, he has some pragmatic data that should help him to convince the users of the validity and usefulness of the changes he proposes to the system. 3) Enrichment of the intrusion detection tools. We have already mentioned in Section 3.2.3 the existing link between our work and the one made in the intrusion detection community. As explained before, some of the transition rates used for the evaluation could be derived thanks to the statistical profiles calculated by various tools such as NIDES. In this case, our tool can benefit from their results. From an other point of view, we think that NIDES, as an example, could benefit from our results. Indeed, the role of intrusion detection tools is to identify potential attackers and raise an alarm if necessary. Sadly, these tools are unable to evaluate the “danger” inherent to a potentially detected intruder. Furthermore, they still are characterized by a high number of false alarms. It is clear that they would be much more useful if the raised alarm was proportional to the level of the danger. This is possible if we enrich them 18
with the functionalities of the privilege graph. Once a potential intruder is detected, we consider him as an attacker and evaluate the danger that he represents with regard to the security constraints. The result of the evaluation is returned to the intrusion detection tools that decide the kind of alarm to raise. We are currently experimenting a beta version of NIDES to study the feasibility of this approach.
REFERENCES [Bellovin 1992] S. M. Bellovin, “There be Dragons”, in the Third Usenix Security Symposium, (Baltimore), 1992. [Cheswick 1991] B. Cheswick, An Evening with Berferd in Which a Cracker is Lured, Endured, and Studied, AT&T Bell Laboratories, Technical Report, 1991. [Curry 1990] D. A. Curry, Improving the Security of your Unix System, SRI International, Technical Report, N°ITSTD-721-FR-90-21, April 1990. [Dacier & Deswarte 1994] M. Dacier and Y. Deswarte, “The Privilege Graph: an Extension to the Typed Access Matrix Model”, in European Symposium in Computer Security (ESORICS’94), (D. Gollman, Ed.), (Brighton, UK), Lecture Notes in Computer Science, 875, pp.319-34, Springer-Verlag, 1994. [Dacier et al. 1996] M. Dacier, Y. Deswarte and M. Kaâniche, “Models and Tools for Quantitative Assessment of Operational Security”, in 12th International Information Security Conference (IFIP/SEC’96), (S. K. Katsikas and D. Gritzalis, Eds.), (Samos, Greece), pp.177-86, Chapman & Hall, 1996. [Denning 1990] D. E. Denning, “Concerning Hackers Who Break into Computer systems”, in the 13th NIST/NCSC National Computer Security Conference, (Washington, USA,vol.2,), pp.653-64, 1990. [Farmer & Spafford 1990] D. Farmer and E. H. Spafford, “The COPS Security Checker System”, in the Summer Usenix Conference, (Anaheim, CA, USA), 1990. [Heydon 1992] C. A. Heydon, Processing Visual Specifications of File System Security, Ph.D. Thesis, School of Computer Science, PA, USA, January 1992. [Javitz & Valdez 1994] H. S. Javitz and A. Valdez, The NIDES Statistical Component: Descriptions and Justification, SRI International, Annual Report, N°A010, March 1994. [Lunt et al. 1990] T. F. Lunt, A. Tamaru, F. Gilham, R. Jagannathan, P. G. Neumann and C. Jalali, “IDES: A Progress Report”, in the Sixth Annual Comp. Security Applications, (Tucson, Arizona, USA), 1990. [Olovsson et al. 1995] T. Olovsson, E. Jonsson, S. Brocklehurst and B. Littlewood, “Towards Operational Measures of Computer Security: Experimentation and Modelling”, in Predictably Dependable Computing Systems Basic Research Series, (B. Randell, J.-C. Laprie, H. Kopetz, B. Littlewood, Ed.), pp.555-69, Springer-Verlag, Berlin, Germany, 1995. [Peterson 1981] J. L. Peterson, Petri Net Theory and the Modeling of Systems, Prentice-Hall, Englewoods Cliffs, 1981. [Reid 1986] B. Reid, “Lessons from the Unix Breakings at Stanford”, ACM SIGSOFT Software Engineering Notes, 11 (5), pp.29-35, October 1986. [Riddle et al. 1989] B. L. Riddle, M. S. Miron and J. A. Semo, “Passwords in Use in a University Timesharing Environment”, Computers & Security, 8, pp.569-79, November 1989. [Rochlis & Eichin 1989] J. A. Rochlis and M. W. Eichin, “With Microscope and Tweezers: The Worm from MIT’s Perspective”, Communications of the ACM, 32 (6), pp.689-98, june 1989. [Seeley 1989] D. Seeley, “A Tour of the Worm”, in the Winter USENIX Conf., (San-Diego, CA, USA), pp.287-304, 1989. [Spafford & Garfinkel 1991] E. Spafford and S. Garfinkel, Practical Unix Security, 483p., O’Reilly & Associates (Inc.), 1991. [Spafford 1988] E. H. Spafford, The Internet Worm Program: An Analysis, Purdue University, Technical Report, N°CSD-TR-823, November 1988. [Stanley 1986] P. M. Stanley, “Computer Crime Investigation - The Lessons Learned from Experience”, in IFIP/SEC’86, (Monte-Carlo, France), pp.319-26, 1986. [Stanley 1991] P. M. Stanley, “Computer Crime Investigation Training - Concept, Content and Cases”, in IFIP/SEC’91, (Brighton, UK), pp.420-9, 1991. 19
[Stoll 1988] C. Stoll, “How Secure are Computers in the USA”, Computers & Security, 7, pp.543-7, 1988. [Wood & Kochan 1987] P. H. Wood and S. G. Kochan, Unix System Security, Collection Hayden Unix System Library, Hayden Book Company, 1987.
20
ANNEX: Privilege Graph Transformation into a Petri Net Model We present in this annex the transformation rules based on Petri nets [Peterson 1981] allowing automatic construction of the simplified intrusion process state graph from the privilege graph. This is highly relevant especially when the size of the privilege graph is very large. Petri nets are well suited for automatic generation of state graphs from concise description of the logical behavior of the system considered. Moreover, many tools are now available that support Petri net model processing and state graph generation. The main idea is to define a generic Petri net model for each attack identified in the privilege graph that accounts for the assumptions characterizing the behaviour of potential intruders. Each attack from a node X to a node Y in the privilege graph is then automatically substituted by the corresponding generic Petri net model. The resulting model is then processed by a Petri net tool in order to derive the corresponding intrusion process state graph. The transformation rule is illustrated on Figure 12. To each node Y of the privilege graph corresponds two places Y and Yg in the Petri net model. The first place is called the main place and the second one the memory place. Each arc from node X to node Y (X → Y) in the privilege graph is transformed into a transition in the Petri net model which has the following characteristics: • Place X is an input and also an output place of the transition. • Place Y is only an output place of the transition. • Place Yg is an input place of the transition. This place is initially marked (i.e., a token is put in this place). Y
Y
➠ Yg X
X
Figure 12: Transformation rule
Once all the arcs of the privilege graph are transformed, potential intruders can be identified by putting tokens in the corresponding places; also the targets to be protected can be specified by indicating the main places in the Petri net associated to the corresponding nodes. The resulting marked Petri net can be processed in order to generate the marking graph which describes the intrusion process state graph associated to the analysed case study. Each state with a token in the target place must be considered as a terminal state (the intrusion process is stopped). The basic generic Petri net model described above takes into account the assumptions concerning the intruder behavior presented in Section 3.3. This is illustrated in the example given in Figure 13. Let us assume that W is the intruder (a token is put in the corresponding place in the Petri net) and Z is the target. Four scenarios of possible attacks can be derived from 21
the state graph derived from the Petri net: 1-3, 2-4-3, 1-2-3, and 2-1-3. The presence of scenarios 1-2-3, and 2-1-3 is due to the fact that the intruder is supposed to remember all possible attacks he has identified but not yet applied (assumption A2). At the Petri net level, memory is accounted for by the fact that each input place of a transition is also an output place of that transition. Therefore, the token used to fire a transition remains available for other firable transitions from that place (transition t1 can be fired after t2 and vice-versa using W's token). Furthermore, one can notice the absence of scenarios 1-2-4-3 and 2-4-1-3 in the generated state graph. This is due to assumption A3; since it is assumed that the intruder will not try to obtain the same set of privileges by applying two different attacks, transitions t1 and t4 of the Petri net are always mutually exclusive. The use of memory places in the Petri net model allows this assumption to be always satisfied since each memory place is shared by all transitions which lead to the same output place (i.e., the acquisition of the same privileges). Z
Z
3 Y
4
X
2
1
➠
t3
1
➠
t4 Y
t1 W
2
WY
X Yg
WYZ
t2
W
(a) Privilege graph
W
Zg
3
WX
2
1 ou 4
WXY
3 Xg
(b) Petri net Figure 13: Transformation approach: example
22
WXYZ
(c) State graph