Quantitative Assessment with Using Ticket Driven Development for Teaching Scrum Framework Hiroshi Igaki
Naoki Fukuyasu
Sachio Saiki
Graduate School of Information Science and Technology, Osaka University 1-5 Yamadaoka, Suita-shi Osaka, Japan
Faculty of Systems Engineering, Wakayama University 930 Sakaedani, Wakayama-shi Wakayama, Japan
Graduate School of System Informatics, Kobe University 1-1 Rokkodai-cho, Nada-ku, Kobe-shi Hyogo, Japan
[email protected]
[email protected]@sys.wakayamau.ac.jp u.ac.jp Shinsuke Matsumoto Shinji Kusumoto
Graduate School of System Informatics, Kobe University 1-1 Rokkodai-cho, Nada-ku, Kobe-shi Hyogo, Japan
Graduate School of Information Science and Technology, Osaka University 1-5 Yamadaoka, Suita-shi Osaka, Japan
[email protected]
[email protected]
ABSTRACT
projects in the viewpoints of quality, assignment, and delivery of projects.
Developing software by teams which adopted the agile development methodology such as Scrum seems totally natural in industry. On the other hand, students belonging to graduate schools of information science who have some experience on the agile team software development are rare. In the initial education on the Scrum, there exists some challenges. The first one is a concept of self-organization. In the Scrum project, members of the team determine how best to accomplish the tasks by themselves. However, it is challenging for students with less experience on team software development to cultivate the self-organizing team by themselves. The 2nd one is inequality on task assignment. In the Scrum project, each member pulls tasks to perform, and do not wait to be assigned by Project Manager. The assignment behavior may cause inequality on task assignment. As a result, such inequality may also cause inequality on learning opportunities to acquire skills and knowledge on the process and the product. In this paper, we propose quantitative assessment methods for the Scrum project with using TiDD(Ticket Driven Development) for the initial education on the Scrum framework and web application production. We report on our basic PBL(Project-Based Learning) course which involved 49 students. The use of quantitative criteria enabled students and teachers to assess the Scrum
Categories and Subject Descriptors D.2.8 [Metrics]: Process metrics, Product metrics
General Terms Measurement
Keywords SE education, Scrum, quantitative assessment, Project-Based Learning
1.
INTRODUCTION
Recently, the companies which exploit the agile software development to combat waste, and reduce the risk of project failure, have become increasingly common in industry. In many curriculums, education and training on the agile software development such as XP or Scrum, are performed[13, 10, 9]. From this April, we have made one-year curriculum which is based on the PBL(Project-based Learning), to teach the Scrum framework against students who are less experienced on the team software development. The Scrum framework consists of Scrum Teams and their associated roles, events, artifacts, and rules. Each component within the framework serves a specific purpose and is essential to Scrum’s success and usage[15]. Teachers should make students understand these components in the initial education of Scrum. Though the Scrum framework is lightweight and simple to understand, there are some challenges to teach such components to the students. The first challenge is a concept of self-organization. In the Scrum project, the Scrum teams are required to be selforganizing. Self-organizing teams choose spontaneously how
Permission to make digital or hard copies of all or part of this work for personal or classroom usetois make granteddigital withoutorfeehard provided thatofcopies not made or work distributed Permission copies all orarepart of this for for profit or commercial advantage and that copies bear this notice and the full citation personal or classroom use is granted without fee provided that copies are on the first page. Copyrights for components of this work owned by others than ACM not made or distributed forwith profit or iscommercial and that copies must be honored. Abstracting credit permitted. Toadvantage copy otherwise, or republish, to postthis on notice servers and or tothe redistribute to lists, specific permission and/ortoa bear full citation onrequires the firstprior page. To copy otherwise, fee. Requesttopermissions from
[email protected]. republish, post on servers or to redistribute to lists, requires prior specific
permission and/or a fee. ICSE Companion’14, May 31 – June 7, 2014, Hyderabad, India ICSE ’14, May - June 7, 2014, Hyderabad, India Copyright 201431 ACM 978-1-4503-2768-8/14/05...$15.00 http://dx.doi.org/10.1145/2591062.2591162 Copyright 2014 ACM 978-1-4503-2768-8/14/05 ...$15.00.
372
best to accomplish their tasks, rather than being directed by others. In the Scrum project, therefore, the Scrum Master takes a facilitative approach to other members and does not apply command-and-control. In order to become a self-organizing team, each member should visualize their project status, inspect them, and adapt the project to a project goal continuously. However, they are all difficult for less experienced students in team software development. The Scrum framework includes several rules for supporting collaboration among members and maintaining quality of products. In a rule called DoD (Definition of Done) in the Scrum, for example, coding, unit testing and reviewing must be performed to complete implementation of a component. Though every member should follow such rules, it is difficult to confirm mutually how much he/she follows them in the project. It is also difficult for teachers to confirm whether every student abides by the rules of the project. The second challenge concerns about equity in learning opportunities. As denoted above, in the Scrum project, all members pull tasks for themselves to perform spontaneously. Therefore, inequality on quantity, difficulty level, and variety of the task assignment may occur. As a result, inequality of the learning opportunities for each developer may also occur. In the initial education on the Scrum framework, such inequality should be avoided, because it causes demotivating developers and reducing the opportunities to share knowledge among developers. In this paper, we report a PBL (Project-Based Learning) implementation for the initial education on the Scrum framework. We built some quantitative metrics in the viewpoint of QAD (Quality, Assignment, and Delivery) to visualize the process, the rules, and the task assignment with using the ticket driven development method. The QAD indicates the quality of the project, equity of the task assignment, and the delivery management, respectively. The metrics provide us with the quantitative assessment criteria of the Scrum project. The remainder of this paper is presented as follows: Section 2 denotes the Scrum Framework, and its difficulty on education. Section 3 gives our quantitative assessment criteria. Section 4 presents overview of our PBL course and Section 5 shows assessment results of the PBL. Finally, we conclude in Section 6.
2.
Product d B Backlog kl
Product Owner
Sprint Backlog
Sprint(1W~4W) Customer
Sprint Review
Product Owner
Develop (Daily Scrum) Increment
Development Team
Scrum Master
Figure 1: A Typical Event Flow of a Scrum Project
Manager) in the project who controls progress and task assignment etc.. On the other hand, Scrum projects have no PM. In the scrum project, every member is responsible to the whole of projects. Based on a concept of selforganization, each member performs task assignment and progress management spontaneously. In order that each member acts in self-organization, the Scrum projects must equip three characteristics, transparency, inspection, and adaptation[15]. Every member in the Scrum project should frequently inspect visualized project, and adapt the project itself according to the inspection. Fig.1 shows an example event flow of a Scrum project. In the following, we explain each event in the Scrum.
2.1.1
Sprint Planning Meeting
The Sprint Planning Meeting must be held at the beginning of each Sprint. In the meeting, the Scrum team decides the following two questions. • What will be done in this Sprint? • How will be the chosen work get done? First, the Product Owner (PO) provides the Scrum team with Product Backlog. Product Backlog includes user stories offered by a client (in our situation, the client is a teacher). The PO and the team select how many stories they develop during the Sprint based on the achievements in the past Sprint. Next, the PO and the team decide how they develop the selected user stories for building product increment during the Sprint. Typically, they convert the selected user stories into a working product increment which consists of several work packages, and extract tasks required for development of those work packages. A list of the extracted tasks is called Sprint Backlog. Here, it is important to define Definition of Done (DoD) for each task. Normally, the DoD is determined for each task or each set of tasks to judge completion of it by a developer. For example, a java component as the work package requires developers to perform coding, unit testing, and reviewing. The Scrum team must follow every DoD to maintain product quality of the package.
PRELIMINARY
In this section, we denote several features of the Scrum with which students have an experience in our curriculum, and their challenges in teaching to the students which have less experienced on team software development.
2.1
Sprint Planning Meeting
Sprint Retrospective
Scrum Framework
Scrum is a framework of an iterative software process which consists of Scrum teams (a Scrum Master, a Product Owner, and Development Members), events (Sprint Planning Meeting, a Daily Scrum, a Sprint Review, and a Sprint Retrospective), and artifacts (a Product Backlog, a Sprint Backlog, and an Increment)[15]. In the Scrum, the iteration is called a Sprint. The Sprint has a fixed period (called a time-box) of less than one month. During the Sprint, the Scrum Team develops potentially releasable product increment. In many of conventional software development processes such as the waterfall model[16], there is a PM (Project
373
2.1.2
Development Phase with Daily Scrum
2.2.2
The Scrum team can start to develop the anticipated increment based on the result of the Sprint Planning Meeting. In the development phase, every member determines which tasks he/she performs for himself through communications and collaborations with each other in self-organizing. Daily Scrum is a meeting for inspecting how developers carried out the tasks since the last Daily Scrum. The Daily Scrum enables the Scrum team to clarify and share present problems occurred during the development phase.
2.1.3
Sprint Review
A Sprint Review is held at the end of the development phase, and it has the following objectives mainly. • To identify what has been “Done” and what has not been “Done” based on the DoD. • To demonstrate the product increment that it has “Done”. Results of the Sprint review are input to the Sprint Retrospective and the next Sprint Planning Meeting.
2.1.4
Retrospective
The Sprint Retrospective is held at the end of the Sprint to inspect and improve the Scrum team and its project before the next Sprint. In the Sprint Retrospective, the Scrum team is expected to inspect members, process, and relationships during the Sprint. The KPT method is leading technique for retrospectives[4]. The KPT means Keep, Problem and Try, respectively. Keep indicates elements which went well during the Sprint. Problem indicates matters which occurred during the Sprint. Try indicates plans which improve next Sprint. With using this method, the Scrum team identifies problems should be improved and creates plans for the next Sprint.
2.2
In group work, there are real problems such as free riding or social loafing which means a member contributes little or nothing to the work of the group[19]. Team software development includes various kinds of tasks, and their difficulty level is also various. In Scrum projects, developers should pull the tasks to perform for themselves, do not wait to be assigned by the PM. Therefore, some students in the team who lack technical capacity select easy tasks preferably. Such inequality on task assignment may bring projects to a successful conclusion in the view point of delivery time. It is because developers with sufficient technical capacity can accomplish difficult tasks effectively. On the other hand, such inequality on the task assignment may cause the inequality on the learning opportunities for students. For example, in a java application development, if a student conducted only the review tasks, he/she can not learn how to conduct unit testing and coding except reviewing. Furthermore, the opportunity of the knowledge share or transfer between students may also be lost, because every student just has to perform the tasks which he already knows. This inequality problem depends on a design choice in PBL education. In a sense, the inequality on task assignment is a practical problem to be solved by students themselves. However, in the initial education of the Scrum framework, we assume that the inequality problem should be taken into consideration in advance by teachers.
2.2.3
Project Assessment
Project assessment is a well known challenge in projectbased learning[2]. The challenge has the following aspects. • What should teachers assess in the student projects. • How should teachers assess the student projects. In many existing educational research, teachers assess the surveys or the output of projects such as the developed software, the presentation, the work plan, and the daily report etc. based on some kinds of rubric rating scales qualitatively [3, 5, 11, 17, 20]. The focus of many conventional assessment approach is the output of the project and the communication behaviour including user contribution. As far as we know, there is hardly any assessment about the software development process with the associated rules such as the DoDs in Scrum projects. The criteria for the project assessment are important for not only teachers but also students. In the initial education, in order to make students conscious of the quality of the project in the viewpoints of the process and the product, teachers should provide them with methods to visualize the quality of the project.
Difficulty in Teaching Scrum
Teaching the Scrum framework has several challenges. Especially, we are targeting the students who have not experienced the team software development. Therefore, it is difficult for us to make the students understand the selforganizing behaviours realized with the combination of inspection and adaptation. We classified this problem into process, task assignment, and project assessment in the following.
2.2.1
Inequality in Learning Opportunities
Disregarded Process and Rules
In team software development, developers must follow the process with several associated rules such as DoD. However, many of students with little experience of the team software development tend to pay attention only to meet the deadline. As a result, they tend to disregard such process and rules. For example, method implementation without unit testing or code reviewing and committing source code including obvious bugs to a VCS (Version Control System) are often performed by students. Generally, disregarding process by developers causes debasement of product quality, and late delivery by setback of the development. In fact, in many students’ projects, more effort is devoted to the project just before deadlines to catch up the delivery time[12]. In such case, software without exception handling is often developed.
3.
QUANTITATIVE PROJECT ASSESSMENT
We introduced a ticket-driven development method (TiDD) for enabling task-by-task progress monitoring and quantitative assessment in the Scrum project. Ticket-driven development is a method in which the development process is divided into multiple tasks according to the type of activity and/or its results and a ticket is assigned to each task[1, 6, 8].
374
Combining the TiDD and the Scrum visualizes the students’ process in the Scrum project. The visualized process enables us to assess the project quantitatively. In the following section, we denote details of the combination of the TiDD and the Scrum, and our new criteria for the assessment of students’ projects.
3.1
TW U T : means a task about coding test cases for unit testing TRV : means a task about reviewing the implemented source code, test cases, and results of unit testing. TW IT : means a task about writing test cases for integration testing
Ticket Driven Development
TEIT : means a task about reviewing the test cases for the integration testing and their results.
Under the ticket-driven development, a ticket is generated for each task performed by a developer to complete a specific product. In the Scrum project, tasks are extracted in the Sprint Planning Meeting as the Sprint Backlog. Therefore, we related the tasks in the Sprint Backlog to the tickets in TiDD. In the students’ project, tasks in the Sprint Backlog are input to Issue Tracking System (ITS) such as Trac1 or Redmine2 , as tickets. Here, we could use a backlog management system like Agilefant3 or ScrumWise4 . In TiDD, what matter is that every task which affects any products in the project is managed as a ticket using the tool. The introduction of ticket-driven development makes it possible to understand the tasks being performed by individual students, along with their progress. As a result, both teachers and students become aware of the progress of a project on an individual level, and ultimately, both are able to identify process, delays, and load distribution for each ticket. Individual tickets registered here contain the following information.
TBF : means a task about bux fixing. Introduction of TiDD visualizes what kinds of tasks each developer performed.
3.2
QAD (Quality, Assignment, and Delivery)
Usual software development projects are assessed based on the criteria named QCD[7]. These three letters indicate Quality of the project, Cost for the project, and Delivery. We have adopted the new criteria named QAD for measuring the project of our basic PBL. The letter ‘A’ indicates Assignment criterion which is introduced, instead of Cost. This criterion represents variation in task assignment by students themselves. We introduced this criterion to prevent the situation in which a particular member executes only a particular kind of tasks. In the following section, we describe each assessment criteria and rules included in the QAD.
3.2.1
Ticket summary: A brief description of the ticket
Quality
We define two kinds of metrics about the process and the product to assess the quality of students’ projects. The code coverages, such as line and branch, are the well known metrics for the product quality. It is easy to calculate these metrics by using the code coverage tool5 . We define the following metrics to assess the process quality. The metrics indicates how correctly developers followed the associated rules of the development process such as DoDs.
Ticket type (kinds of task): Identify for which kinds of task (coding, unit testing, reviewing, integration testing, and bug fixing, etc.) the ticket is Ticket description: A detailed description of the ticket Component: The component for which the task is assigned. Here the component indicates a file developed in the task. Ticket owner: The person in charge of the ticket
QSB : In team software development, developers usually use a version control system (VCS) for sharing source code such as git or subversion. It is important for all developers to upload buildable code in case of using the VCS. If unbuildable code are uploaded to the VCS, anyone who checks out the code, must fix it firstly. As a result, it becomes difficult for other developers to continue their development. Here, we define QSB as the rate of the number of times that developers in a team uploaded the source code which can be built normally. QSB illustrates how much attention the developers pay to maintain the source code in the VCS. In our assessment environment, whenever a developer uploads the code to the VCS, the whole project is built and tested to confirm whether the project is buildable or not.
Milestone: The Sprint to which the ticket is associated Estimated number of hours: Estimated man hours required for completing the task is entered when planning the task Total hours: Actual man hours it took to complete the task is entered upon completion of the task Starting time: The time at which the developer started the task. It is automatically recorded through the ITS as soon as a developer registers a ticket. Completion time: The time at which the task is completed In our PBL, students perform various kinds of tasks indicated in the following.
QCT : Uploading source code to the VCS is called commit. QCT indicates the rate of the number of commits which have a corresponding ticket, respectively. In TiDD, all tasks which affect the source code in the VCS, must be recorded to the ITS. If there are some commits which have no corresponding ticket, it shows the possibility
TCOD : means a task about coding source code 1
http://trac.edgewall.org/ http://www.redmine.org/ 3 http://agilefant.com/ 4 https://www.scrumwise.com/ 2
5
375
http://www.eclemma.org/jacoco/
3.2.3
that there are some tasks which are not managed by the team appropriately. Here, the corresponding ticket means a ticket which satisfies the following all conditions.
In the Scrum project, the Scrum team estimates which user stories they could develop in the Sprint Planning Meeting. We defined two metrics on the delivery which assess the size of developed products, and the accuracy of the estimation.
• The owner of the ticket is the committer of the commit. • The component of the ticket is included in the commit.
DN OU : means the number of implemented user stories in each Sprint.
• The commit is performed between the starting time and the completion time of the ticket.
DP OA : means the rate of the actual developed user stories in the estimated values.
QRV : Every component included in the increment should be reviewed by the other developer other than a developer who implemented the component, to maintain the quality of it. QRV indicates the rate of the number of components which are reviewed appropriately. We calculate QRV by checking the final task about each component.
3.3
Assessment of Scrum Master
The Scrum Master should serve the Development Team by coaching in self-organization and facilitating the Scrum events. The concrete behaviors which the Scrum Master should perform were not determined in advance. It is difficult to assess the Scrum Master quantitatively. Therefore, we adopted a survey to assess the role of the Scrum Master qualitatively. In the survey, we asked the students to evaluate their Scrum Master in the following viewpoints.
QIT : Every user story must be tested by the member of Scrum team before the Sprint review. QIT indicates the rate of the number of user stories for which developers executed the integration testing.
3.2.2
Delivery
Scrum Master as a Leader: Whether the Scrum Master led to accomplish high targets for the Sprint.
Assignment
We defined the following metrics to assess the inequality on the task assignment.
Scrum Master as a Facilitator: Whether the Scrum Master facilitated the Sprint, such as good time management, supporting knowledge sharing and encouraging the expression of various viewpoints.
ACOD : means the rate of the number of members who satisfied a constraint on the number of the assigned TCOD tasks. The definition of the constraint is that the number of the assigned TCOD tasks for a developer should be within ± 20 % of the average number of all the assigned TCOD .
Scrum Master as a Gate Keeper: Whether the Scrum Master encouraged members to follow the process and rules such as DoDs, and improvement plans proposed in the last Sprint.
AW U T : means the rate of the number of members who satisfied a constraint on the number of the assigned TW U T tasks. The definition of the constraint is that the number of the assigned TW U T tasks for a developer should be within ± 20 % of the average number of all the assigned TW U T .
Scrum Master as a Supporter: Whether the Scrum Master supported so that members could develop products efficiently by collecting data for the project assessment and visualization.
ARV : means the rate of the number of members who satisfied a constraint on the number of the assigned TRV tasks. The definition of the constraint is that the number of the assigned TRV tasks for a developer should be within ± 20 % of the average number of all the assigned TRV .
4.
PROJECT SETUP
Cloud Spiral6 is being held as one of the Educational Network for Practical Information Technologies (enPiT) programs on “Project for Establishing a Nationwide Practical Education Network for IT Human Resources Development” led by the Ministry of Education, Culture, Sports, Science and Technology, Japan at Osaka University in 2013. Multiple graduate schools in the Kansai area of Japan and private corporations attend the Cloud Spiral. Its one-year curriculum aims at nurturing agile team software development method and cloud computing technology such as scaling and big data processing. Cloud Spiral consists of 4 courses:foundation of cloud development courses, it advanced cloud development courses, basic PBL and advanced PBL. In this paper, we focus on the basic PBL course which aims at teaching the Scrum framework as an initial education.
AW IT : means the rate of the number of members who performed the TW IT task at least once. AEIT : means the rate of the number of members who performed the TEIT at least once. AV F : means the rate of the number of members who implemented all kinds of source files such as *.java and *.html etc. at least once. Providing these metrics enables students and teachers to inspect inequality on the task assignment in the above viewpoints.
6
376
http://cloud-spiral.enpit.jp/
4.1
Overview of Our Basic PBL
In the PBL, students form a team with 5∼6 members belonging to different universities, and develop a web application named “EventSpiral” based on the Scrum in five days. Target students of our courses are information science students belonging to the graduate schools. Most of the students have less experience on the team software development. In summer 2013, forty-nine students from nine universities attended these courses, and they were divided into nine groups. Our educational goal of the PBL is to increase students’ skill and knowledge on the Scrum framework and web application development.
4.2
Start
TCOD (Coding source code)
source code
TWUT (Coding test case)
test code for unit tes ng
TBF(Bug fix)
NG
TRV(Review)
Review result
OK Done
Figure 2: Workflow Example as a DoD for a java Component Sprint Burndown Chart
Development Process of the PBL
The process of our PBL exploits Scrum. Key points of our implementation of Scrum are as follows.
Sprint Burndown Chart: Sprint #1 Ideal Actual Remaining effort (minutes)
S1 Sprint time-box is 1 day. We limited student’s sprint to the hours between 9:00 and 21:00. A typical one-day time table of the students’ project is as follows. 9:00∼10:30: Sprint Planning Meeting 10:30∼17:00: Development with Daily (Hourly) Scrum 17:00∼17:30: Sprint Review
Time
17:30∼19:00: Sprint Retrospective S2 Our PBL consists of five sprints; Sprint#1, Sprint#2, Sprint#3, Sprint#4, and Sprint#5. In the Sprint#1, teachers provide students with tutorials on the project infrastructure.
Figure 3: Tools.
S3 Each student is assigned to the Scrum Master by turns.
4.3
A Screen Image of Our Visualization
Project Infrastructure
In order to offer students experience of practical software development, we provided the following development environment and server software packages to support the development.
S4 Teachers prepared some DoDs (Definition of Done) in the viewpoint of our QAD criteria and provided them to the students beforehand. Figure 2 shows one of the DoDs for tasks about development of java components. In order to complete a java component, a developer must perform the TCOD , TW U T , and TRV in order. Examples of other DoDs are as follows.
• Client-side Development Environment – Eclipse IDE for Java Developers 4.2 – Apache Tomcat 7.0.41
– Owner of the TCOD task and TRV task should be different.
– MongoDB 2.4.2 • Server-side Development Support Environment
– A developer should commit products (such as source code, test code, or review reports) after completing them in the VCS.
– Subversion 1.8.0 – Trac 0.12
– Source code in the VCS should be able to be built normally after committing by developers.
– Jenkins 1.525 Students use the client-side development environment for developing the web application “EventSpiral” which consists of Java, JavaScript, HTML, and MongoDB. We have installed three server software packages on the server; Subversion for software configuration management, Trac for TiDD and Jenkins7 . Jenkins automatically builds students’ developed source code on the Subversion repository and reports the build results and test results. This allows students to be aware of the development process and its quality. We also develop and provide visualization tools for sprint burndown chart from tickets recorded in Trac. Figure 3 shows
– The number of the assigned TCOD tasks for each developer should be within ± 20 % of the average number of all the assigned COD tasks. S5 The Sprint retrospective is performed on the basis of the KPT method, which classifies various activities in 3 categories-those that were found to be effective and should be continued (Keep), those that have problems and should be improved (Problem), and those to be tried in the future (Try). Scrum Master puts results of these activities into minutes.
7
377
http://jenkins-ci.org/
100% 90%
T1
80%
T2
70%
T3
60%
T4
50%
T5
40%
T6
30%
T7
20%
T8
10%
T9
0% #1
#2
#3
#4
#5
Figure 5: The Assessment Result of QSB for All Teams 100%
T7
90%
T1
80%
T2
70%
T3
T3
60%
Figure 4: All User Stories of EventSpiral.
T4
50%
T5
40%
our Trac tickets visualization tool. Sprint burndown chart shows how many tasks are still remaining based on prior estimated efforts in a specified sprint[15, 14]. These project infrastructure helps not only project management but also self-organization in terms of process transparency. Furthermore, we also prepare some physical discussion tools (e.g., whiteboard, marker pen and sticky notes) for some scrum events.
4.4
T6
30%
T7
20%
T8
10%
T9
0% #1
#2
#3
#4
#5
Figure 6: The Assessment Result of QCT for All Teams
Development Software
100%
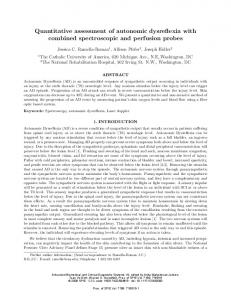
The assignment for the PBL involves adding features to a ticket reservation system named “EventSpiral”. The system is designed as a web application using a web application framework named DWR8 . The system consists of 13 user stories shown in figure 4 such as “login” and “Display Event List”. The effective LOC of the “EventSpiral” is about 4000 lines. As runtime environments, apache tomcat is used for web and application container, and MongoDB is used for NoSQL type DB management system. Each student group receives the detailed software specifications such as “use case diagram”, “robustness diagram”, and “class and method specification”. Students can decide freely upon the order of development in the user stories.
90% 80% 70%
M31
60%
M32
50%
M33
40%
M34
30%
M35
20%
M36
10% 0% #1
#2
#3
#4
#5
Figure 7: The Assessment Result of QCT for T3
5. RESULTS OF OUR PROJECT ASSESSMENT
sprint. We can grasp the transition for every sprint from these graphs. Fig.5 shows QSB for all teams. The Y-axis indicates the success rate of building the uploaded code normally. At the first of our PBL, the success rates varied widely among teams. Finally, 7 teams have achieved 100% of success rate. Our PBL could make it possible for students to understand the importance of uploading buildable code, to some extent. Fig.6 shows QCT for all teams. The Y-axis indicates the rate of the number of commits which have a corresponding ticket. Fig.8 and fig.7 show transitions of QCT values for
In this section, we denote our assessment results in the viewpoints of the QAD. Henceforth, we outline the assessment results of all the 9 teams and describe two teams (T3 and T7) of them for details.
5.1
Quality
Fig.5–9 show some examples assessed by the criteria of process Quality. The X-axis of each graph indicates the 8
http://directwebremoting.org/dwr/index.html
378
100%
100%
90%
90%
80%
80%
70%
10%
0%
0%
#2
#3
#4
T6
#5
T8 T9 #1
Figure 8: The Assessment Result of QCT for T7
T7
T7
20%
10% #1
T5
30%
M75
20%
T4
40%
M74
30%
T3
50%
M73
40%
T2
60%
M72
50%
T1
70%
M71
60%
T3
#2
#3
#4
#5
Figure 10: The Assessment Result of ACOD for All Teams
100% 90%
240%
T1
80%
220%
T2
70% 60% 50% 40%
200%
T3
180%
T4
160%
M71
T5
140%
M72
120%
T6
30% 20% 10% 0% #1
#2
#3
#4
M73
100% 80%
M74
T8
60%
M75
T9
40%
T7
20%
#5
0% #1
Figure 9: The Assessment Result of QRV for All Teams
#3
#4
#5
Figure 11: The Assessment Result of ACOD for T7 240%
all members in the team, respectively. Fig.8 indicates that the team T7, which consists of 5 members, have recognized the importance of management by appropriate tickets at the 3rd sprint. Finally, 3 members manage all commits appropriately. On the other hand, although some improvement is found in 4th sprint, the team T3, which consists of 6 members, has many un-managed tasks in the last sprint. Fig.9 shows QRV for all teams. The Y-axis indicates the rate of the number of components of which the final task is TRV . There are great differences between the rates of following the rules of DoDs for each team. In this case, both T3 and T9 left many components un-reviewed. In the last sprint, this result shows that they started to develop many components with no plan, and could not complete most of them.
5.2
#2
220% 200% 180%
M31
160%
M32
140% 120%
M33
100%
M34
80%
M35
60%
M36
40% 20% 0% #1
#2
#3
#4
#5
Figure 12: The Assessment Result of ACOD for T3
Assignment In the team T7, the rate of the number of the assigned TCOD tasks for each developer is within ± 40% of the average number. The result on inequality of the task assignment indicates the student M75 who have only limited experience on the task TCOD relatively.
Fig.10 shows transitions ACOD for all teams. The X-axis indicates the time and the Y-axis indicates the rate of the number of members who satisfied a constraint on the number of the assigned TCOD tasks. The figure shows cumulative value on ACOD . For example, #5 indicates ACOD value for all the Sprint periods. Fig.11 plots the rates of the number of assigned TCOD tasks for every member to the average value of the team T7 for each sprint. Fig.12 plots that rates for every member of the team T3. Assignment of the team T3 improved in the 3rd sprint. Finally, all members executed almost same number of tasks.
5.3
Delivery
Tab.1 shows the user stories implemented by each team through all sprints. ‘◦’ means completed user stories. ‘×’ means planned user stories which are uncompleted. DN OU is the total number of ‘◦’. DP OA is the value of DN OU divided by the number of planned user stories that is the sum of ‘◦’
379
T1 T2 T3 T4 T5 T6 T7 T8 T9
T1 T2 T3 T4 T5 T6 T7 T8 T9
QSB 100% 95% 95% 87% 96% 92% 96% 98% 93%
U S1 ◦ ◦ ◦ ◦ ◦ ◦ ◦ ◦ ◦
QCT 92% 82% 86% 84% 79% 82% 90% 80% 91%
U S2 ◦ ◦ ◦ ◦ ◦ ◦ ◦ ◦
Table QRV 84% 83% 60% 88% 87% 81% 76% 50% 72%
U S3 ◦ ◦ ◦ ◦ × ◦ ◦ ◦ ◦
Table 1: Delivery Metrics U S4 U S5 U S6 U S 7 U S8 ◦ ◦ ◦ ◦ ◦ × ◦ ◦ × × × × ◦ ◦ ◦ ◦ × × × ◦ × × × × ×
2: All QAD Metrics Values after the QIT ACOD AW U T ARV AW IT 75% 60% 40% 40% 100% 100% 100% 80% 100% 100% 63% 100% 67% 100% 67% 83% 100% 100% 100% 100% 83% 100% 40% 80% 100% 50% 83% 100% 100% 100% 100% 40% 40% 40% 100% 40% 83% 67% 100% 67% 57% 83% 33% 67% 100%
and ‘×’. Though the DN OU value of T4 is smaller than that of T3, the DP OA value of T4 is higher that that of T3. This means that T4 developed most of the user stories according to the plan.
6.
U S9 ◦ ×
× ×
DN OU 7 5 5 4 4 4 3 3 3
Sprint AEIT 100% 100% 83% 100% 100% 100% 100% 100% 83%
#5. AV F 73% 100% 100% 100% 100% 100% 93% 94% 100%
DP OA 100% 83% 56% 80% 80% 57% 60% 60% 50%
DN OU 7 5 5 4 4 4 3 3 3
DP OA 100% 83% 56% 80% 80% 57% 60% 60% 50%
In conventional quantitative assessment criteria, the karma model to assess the amount and the quality of user contribution in collaboration quantitatively is proposed [18]. In [5], fundamental assessment perspectives for their authentic assessment model are proposed; Content, Process, Output, Performance and Client. Though the perspectives are also essential for assessing the Scrum project, quantitative criteria could improve their assessment model. In [10], a mixed-method approach combining qualitative and quantitative methods is adopted. They used communication data (emails, chats) and interviews, etc. for assessing the role of distributed Scrum in their course. The mixed-method is a promising approach on the project assessment. On the other hand, the conventional assessment criteria are not necessarily considered being exhibited to students beforehand. In the future research, we plan to add communication measurement to assess the role of the Scrum based on the method. In our assessment method, input failures, which occur when students record their tasks, restrict us to calculate exact values of the QAD criteria. Depending on the teams, in this PBL, there existed multiple input failures. Currently, teachers have to check them manually to make students correct the mistakes. Hereafter, we are planning to create visualization tools to find such input failures by students easily. In this PBL, we focused to teach Scrum framework itself rather than the whole of software development lifecycle. Therefore, due to time constraints, our basic PBL omitted “design task” by students. That is, specifications (such as basic algorithm and parameters) of almost all classes and methods were given by teachers beforehand. Hereafter, in our next step, we are planning to conduct more practical PBL which includes “design phase” by students. In our plan, component design phase will be included in the Sprint Planning Meeting. The objective of the component design phase is to clarify which component should be developed in the sprint. Based on the result of the component design phase, students define the Sprint backlog.
DISCUSSION
Our QAD criteria aim at achieving the following objectives for students and teachers. • Students assess their project and decide how best to achieve the project goal based on the criteria in selforganizing. • Teachers assess quantitatively whether the team follows the provided process and rules to acquire the skill and knowledge on the Scrum and the web application production. Tab.2 shows all the assessment results for all teams after the sprint#5 was finished. From the results, we could assess that the project of the team T2 and T4 are good on the whole. In the aspect of DN OU , T1 and T3 also developed more user stories. However, these teams have low values of some metrics, such as ACOD , AW U T , ARV and AV F of T1 and QRV , QIT and AW IT of T3. By assessing students’ projects based on the criteria of QAD, it becomes possible to grasp the problem of each project quantitatively As a result, the above objectives were achieved to some extent. Especially, in the criteria on the assignment, some following positive comments were given by students after the PBL. I did not almost have experience not only using Java but JavaScript. However, the constraints on assignment motivated me to learn both of them. The assignment constraints promoted our team to help each other. As a result, I could have experiences on various tasks.
380
7.
CONCLUSIONS
5:369–386, 1996. [8] S. Hosono. A devops framework to shorten delivery time for cloud applications. International Journal of Computational Science and Engineering, 7:329–344, October 2012. [9] V. Mahnic. A capstone course on agile software development using scrum. IEEE Transactions on Education, 55:99 – 106, February 2012. [10] D. D. P. R. Maria Paasivaara, Casper Lassenius and A. Schroter. Teaching students global software engineering skills using distributed scrum. In Proc. the 2013 International Conference on Software Engineering(ICSE ’13), pages 1128–1137, 2013. [11] M. Persson, K. A. Ivan Kruzela, O. Johansson, and P. Johansson. On the Use of Scrum in Project Driven Higher Education. In Proc. the World Congress in Computer Science, Computer Engineering and Applied Computing(2011), 2011. Las Vegas/Nevada. [12] F. Rocha and E. Stroulia. Understanding individual contribution and collaboration in student software teams. In Proc. 2013 IEEE 26th Conference on Software Engineering Education and Training (CSEE&T), pages 51–60, May 2013. [13] C. Scharff. Guiding global software development projects using scrum and agile with quality assurance. In Proc. 24th IEEE-CS Conference on Software Engineering Education and Training (CSEE&T), 2011. [14] C. Scharff and R. Verma. Scrum to support mobile application development projects in a just-in-time learning context. In Proc. the 2010 ICSE Workshop on Cooperative and Human Aspects of Software Engineering(CHASE ’10), pages 25–31, May 2010. NY, USA. [15] K. Schwaber and J. Sutherland. The scrum guide. https://www.scrum.org/Scrum-Guides, July 2013. [16] I. Sommerville. Software Engineering. Addison, 2010. [17] G. X.-L. Tai and M. C. Yuen. Authentic assessment strategies in problem based learning. In Proc. the Australasian Society for Computers in Learning in Tertiary Education (ASCILITE 2007), pages 983–993, 2007. Singapore. [18] I. H. Terhi Kilamo and M. A. Chatti. Teaching collaborative software development: a case study. In Proc. the 2012 International Conference on Software Engineering, pages 1165–1174, 2012. [19] N. M. Webb. Group collaboration in assessment: Multiple objectives, processes, and outcomes. Educational Evaluation and Policy Analysis, 17(2):239–261, June 1995. [20] S. Yamin and A. Masek. ducation for sustainable development through problem based learning: a review of the monitoring and assessment strategy. In Proc. International Conference on Education for Sustainable Development in Technical and Vocational education and Training, pages 171–178, 2010. Manila, Philippines.
In this paper, we presented our PBL course design for educating students who have less experience on the team software development, about skill and knowledge on the Scrum framework and web application production. In the PBL, we employed the Ticket Driven Development to bring transparency to the process on their projects. Using the process enabled students and teachers to assess the projects quantitatively in the viewpoints of the quality of the project, the task assignment, and the delivery. We conclude that the quantitative assessment criteria are important for teaching the skill and knowledge on the Scrum process and the product especially in the initial education. In our future research, we plan to reduce the input failures of tickets in Ticket Driven Development.
8.
ACKNOWLEDGMENTS
This work is being conducted as a part of the enPiT (Education Network for Practical Information Technologies) project supported by Ministry of Education, Culture, Sports, Science and Technology, Japan and JSPS KAKENHI Grant Number 24700030.
9.
REFERENCES
[1] C. Bang and M. Sakai. What is Ticket Driven Development, and why is it attracting attention in Japan? http://blogs.atlassian.com/2013/03/what-isticket-driven-development-and-why-is-it-attractingattention-in-japan/, March 2013. [2] W. Cheng and M. Warren. Making a difference: Using peers to assess individual students’ contributions to a group project. Teaching in Higher Education, 5(2):243–255, April 2000. [3] N. Clark. Evaluating student teams developing unique industry projects. In Proc. the 7th Australasian conference on Computing education(ACE2005), volume 42, pages 21–30, 2005. [4] A. Cockburn. Agile Software Development. Addison-Wesley, 2003. [5] S. dos Santos and F. Soares. Authentic Assessment in Software Engineering Education Based on PBL Principles A Case Study in the Telecom Market. In Proc. the 35th International Conference on Software Engineering (ICSE2013), pages 1055–1062, 2013. San Francisco, USA. [6] N. Fukuyasu, S. Saiki, H. Igaki, and Y. Manabe. Experimental Report of the Exercise Environment for Software Development PBL. In Proc. 13th ACIS International Conference on Software Engineering, Artificial Intelligence, Networking and Parallel/Distributed Computing, pages 482–487, 2012. [7] W. S. G Button. Project work: The organisation of collaborative design and development in software engineering. Computer Supported Cooperative Work (CSCW): The Journal of Collaborative Computing,
381