APPLIED PHYSICS LETTERS
VOLUME 82, NUMBER 18
5 MAY 2003
Quantum dot amplifiers with high output power and low noise Tommy W. Berga) and Jesper Mørk Research Center COM, Technical University of Denmark, Build. 345V, DK-2800 Kgs. Lyngby, Denmark
共Received 9 October 2002; accepted 5 March 2003兲 Quantum dot semiconductor optical amplifiers have been theoretically investigated and are predicted to achieve high saturated output power, large gain, and low noise figure. We discuss the device dynamics and, in particular, show that the presence of highly inverted barrier states does not limit the performance of these devices. © 2003 American Institute of Physics. 关DOI: 10.1063/1.1571226兴
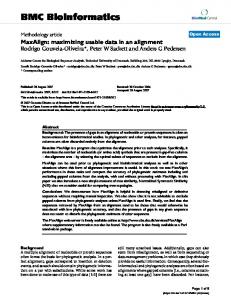
The dominance of the erbium-doped fiber amplifier 共EDFA兲 in optical communication systems stems from its high output power and good noise properties compared to bulk and quantum well 共QW兲 semiconductor optical amplifiers.1 Progress in growth technology has resulted in the realization of high-quality quantum dot 共QD兲 lasers with record low threshold current density and high output power,2 and recently the wavelength range has been extended to 1.55 m.3 A number of basic material properties render QD devices extremely interesting not only as lasers but also as amplifiers.4 – 6 Due to an inherently small confinement factor, QD material normally exhibits a small modal gain,6 necessitating the use of long 共millimeters兲 devices in order to achieve a significant device gain. This might pose a problem since, under high pumping conditions, the wetting layer 共WL兲 and barrier states could achieve much larger modal gains than the QD states and the device could, therefore, start lasing at these higher states. Also, the upper states with high gain could be expected to consume a large fraction of the injected carriers through amplified spontaneous emission 共ASE兲, limiting applications to low pumping and low gain. We present here a detailed numerical analysis of QD amplifiers and predict that these devices may promise superior characteristics regarding gain, power, and noise compared to other types of semiconductor amplifiers. The potential problems just mentioned are thus found not to limit the performance as long as the antireflection 共AR兲 coating of the device is of a good, but realistic quality. The gain spectrum of the device under consideration is illustrated in Fig. 1. The system is composed of an inhomogeneously broadened QD ground state 共GS兲, an excited state 共ES兲, and a WL in the shape of a narrow QW. Inhomogeneous broadening is taken into account by splitting the ensemble of QDs into a number of populations depending on the eigenenergies of the GS levels. The WL is assumed to be in quasi-equilibrium 共i.e., described by a Fermi distribution function兲 and is, consequently, described by a single carrier density, N W . In accordance with Ref. 4, we assume that dynamics are limited by conduction-band electrons, due to the larger level spacing compared with valence-band holes and the resulting larger relaxation times. The dynamics of this a兲
Electronic mail:
[email protected]
system are then described by a set of rate equations for the densities of the different electron populations 共we have chosen to normalize using the respective active material volumes兲: 0 E fW NW I ⫽ ⫺ t eV W c V W
⫺
NW aW ⫺ W
兺n
兺p
0 D n ˆf En ⫹ ˆf W
V0 VW
兺n
Dn
N En
c En
W p 共2 f W p ⫺1 兲 P p , ␦បp
共1兲
0 N n 0 N En n Nn N En f W E n N ˆf E ⫺ En ˆf W ˆf G ⫹ Gn ˆf En ⫺ E ⫺ ⫽ t cV 0 0 E c E 0 G
⫺
冉
aE E 2N En ⫺ V0
冊兺 p
E n,p P , ⌬ប p p
冉
N Gn N En n Nn Nn a G n ˆf G ⫺ Gn ˆf En ⫺ G ⫺ G 2N G ⫽ ⫺ t 0 G V0 0 G ⫻
兺p
G n,p P . ⌬ប p p
共2兲
冊 共3兲
Here, N ni (i⫽G,E) is the GS/ES carrier density of the nth dot population, V W and V 0 are the volumes of the WL, and a single dot, respectively, D n is the absolute number of dots in population n, i is the degeneracy of the dot levels including spin 共two for GS and four for ES兲, f ni is the occupation probability of the QD states, and ˆf ni ⫽1⫺ f ni is the probability
FIG. 1. 共a兲 Gain spectrum for a current density of 1 kA/cm2 and under full inversion. 共b兲 Schematic illustration of the density of states.
0003-6951/2003/82(18)/3083/3/$20.00 3083 © 2003 American Institute of Physics Downloaded 26 Mar 2010 to 192.38.67.112. Redistribution subject to AIP license or copyright; see http://apl.aip.org/apl/copyright.jsp
3084
Appl. Phys. Lett., Vol. 82, No. 18, 5 May 2003
T. W. Berg and J. Mørk
0 of finding an empty electronic QD state. f W is the occupation probability at the WL band edge, i is the QD GS/ES spon2 ) taneous carrier lifetime, and W ⫽1/(A W ⫹B W N W ⫹C W N W is the carrier lifetime in the WL. 0 ⫽1/(A 0 ⫹C 0 N W ) and c ⫽A c ⫹C c N W are the carrier intradot relaxation 共ES to GS兲 and capture 共WL to ES兲 characteristic times 共assumed identical for all populations兲, respectively, including phonon 共the A coefficients兲 and Auger 共the C coefficients兲 contributions as described in Ref. 5. Intradot excitation and re-emission of carriers into the WL are related to the opposite transitions of Gn relaxation and capture by the ratios: n n n ⫽( G / E ) exp(⌬EG,E/kBT) and E ⫽exp(⌬EE,W/kBT), where n n and ⌬E E,W are the electronic activation energies from ⌬E G,E the GS to ES and the ES to WL band edges, respectively. In the gain terms 关last term in Eqs. 共1兲–共3兲兴, a i is the differential gain, and ⫽WH/⌫ is the absorption cross section, where ⌫, W, and H are the confinement factor, the width, and the height of the active region. ASE noise leads to broadband emission, and we have accordingly discretized the spectral density into appropriate energy ranges. Thus, P p is the number of photons in the energy range ⌬ប p ⫽ប p⫹1 i and n,p is defined as: i n,p ⫽
冕 冕 ប p⫹1
បp
i
E n⫹1 i
En
G i 共 E ⬘ 兲 B 共 ប ⬘ 兲 dE ⬘ d 共 ប ⬘ 兲 ,
共4兲
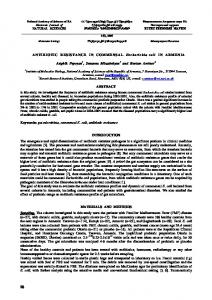
where G i (E) is the normalized inhomogenous 共Gaussian兲 broadening function, and B(ប ) is the homogeneous broadening function 共Lorentzian兲. In the WL gain term, W p is defined as in Eq. 共4兲 except that G i is replaced by the homogeneously broadened reduced density of states of the WL. f W p is the WL Fermi function at the center energy of photon population p, and a W is the differential gain. ASE and signal propagation is included by sectioning of the amplifier and using a standard propagation equation, which accounts for the relation between gain and spontaneous emission.7 The specific device modeled here is similar to the one used in Ref. 6, i.e., InAs dots on a GaAs substrate with an InGaAs overgrowth layer and a sheet dot density of 4 ⫻1011 cm⫺2 . The only difference is that the number of active layers increased from three to six and the modal gain accordingly increased. The intradot relaxation time in this device is short, on the order of 150 fs under high inversion 共Auger dominated兲 and we use a phonon dominated capture time of 1 ps. Essential parameter values used in the simulations are shown in Table 1. For the results presented here, the device is biased with 1 kA/cm2 , which gives rise to an inversion as shown by the solid line in Fig. 1共a兲 共without the influence of ASE saturation and waveguide losses兲. The maximum modal gain is 22 cm⫺1 for the GS, 36 cm⫺1 for the ES, and 150 cm⫺1 for the WL peak. The waveguide loss is assumed to be 2 cm⫺1 , in accordance with experimental results.8 The output ASE spectral density from one facet is shown in Fig. 2 for three different device lengths. For the shortest device of 1 mm, the ASE spectrum resembles the gain spectrum, with a dominating WL due to the high gain of this level. However, for the longer devices of 4 mm and 7 mm, the ASE spectrum is seen to move toward longer wavelengths and the intensity at the WL gradually decreases. As
TABLE I. Essential parameter values used. Parameter a G ⫽a E aW ⌫ G⫽ E center ⌬E G,E center ⌬E E,W
Value ⫺20
2
3⫻10 m 4⫻10⫺20 m2 0.2665 4.7⫻10⫺13 m2 1 ns 62 meV 59 meV
Parameter
Value
Ac A0 Cc C0 AW BW CW
1⫻1012 s⫺1 5⫻1011 s⫺1 1⫻10⫺14 m3 s⫺1 3.5⫻10⫺13 m3 s⫺1 1⫻108 s⫺1 7⫻10⫺16 m3 s⫺1 1⫻10⫺41 m6 s⫺1
the device length is increased, the QD GS and ES generate increasingly more ASE, resulting in a lowering of the inversion of the structure, and thus, in an overall decrease of the WL gain. Also, the ASE from the ES transition is seen to decrease between the 4 mm and 7 mm devices, whereas the GS emission continues to increase for the device lengths shown here. The fact that the QD GS is energetically lower than the WL means that the WL only consumes carriers through recombination when these are not required for amplification of either a signal or ASE in the QD GS. The length-dependent amplification properties are illustrated in Fig. 3. The QD GS small signal gain 关solid line in Fig. 3共a兲兴 is seen to start saturating due to ASE only for devices longer than 6 mm, while the WL gain 共dashed line兲 starts saturating already at a length of 2 mm. The GS gain reaches a high maximum gain of 45 dB. It is noteworthy that the WL peak gain, despite the initially higher modal gain, does not reach a small signal gain higher than the maximum achievable gain from the QD GS. Figure 3共b兲 summarizes the saturation characteristics, obtained when a continuouswave beam is injected at the center of the GS transition, by 3 dB plotting the 3 dB saturation power at the input ( P in ) and 3 dB 3 dB is output ( P out ) of the amplifier versus device length. P out seen to be above 20 dB m for nearly all lengths and reaches a high value of 25 dB m for intermediate lengths. Finally, Fig. 3共c兲 shows the noise figure 共NF兲 calculated at the center of the GS transition. The NF is seen to be below 4.5 dB for devices shorter than 6 mm, but increases rapidly as ASE saturates the device. These predictions appear, in all respects, significantly better than what is commonly reported for bulk
FIG. 2. Spectral density of ASE for three different device lengths (L ⫽1 mm, L⫽4 mm, and L⫽7 mm). Downloaded 26 Mar 2010 to 192.38.67.112. Redistribution subject to AIP license or copyright; see http://apl.aip.org/apl/copyright.jsp
Appl. Phys. Lett., Vol. 82, No. 18, 5 May 2003
FIG. 3. 共a兲 Small signal gain at the center of the QD GS (G GS), WL (G WL), and maximum gain at any wavelength (G max), 共b兲 3 dB saturated output power ( P 3outdB) and input power ( P 3indB), and 共c兲 NF at the center of the GS transition.
and QW devices1 and suggest that long QD amplifiers could offer significant advantages. The reason for the improved performance is a combination of the low modal gain, low differential gain, and the large energy separation between GS, ES, and WL. The latter results in a system, which can, in many respects, be considered as a three-level system similar to the EDFA, and the results shown here indeed more closely resemble the properties of an EDFA than those of bulk and QW amplifiers. Next, we discuss the physical interpretations and consequences of the main QD characteristics. The low modal gain of the GS results in a low rate of stimulated emission locally, even at high powers. Combined with the comparatively fast carrier capture and intradot relaxation, this means that limitations due to spectral hole burning are avoided. Furthermore, the upper states of the device 共ES, WL, and barriers兲 act as a nearby reservoir of carriers, resulting in a low GS differential gain under high inversion, which in turn leads to the high saturation power. The saturation power thus increases with current until the slower process of either carrier capture or intradot relaxation becomes the limiting factor. In the present case, this occurs at a power level of 27 dB m, limited by capture. The high saturation power allows the device to sustain a large amount of ASE before the gain saturates. Hence, ASE saturation becomes important only for very long devices, enabling a high total gain of the device. An important factor in the slow saturation of the amplifier is the energy spacing between the GS and the high gain WL region. Without this separation, the strong and rapid depletion of the inversion in the WL would affect the GS gain significantly, causing a much more rapid saturation of the gain with length. This latter effect is what would be observed if operating a bulk device close to the band edge, where the modal gain is small, but the transitions are closely coupled to nearby transitions with higher gain. The energy
T. W. Berg and J. Mørk
3085
splitting between levels should thus be significantly larger than the thermal energy in order to avoid ASE saturation from higher levels influencing the active QD states. The high modal gain of the WL means that the small signal gain of this layer increases much more rapidly with length than the QD GS gain, as seen in Fig. 3共a兲. However, the high gain also implies a large generation of ASE, which rapidly decreases the inversion at this level and limits the maximum gain to a value slightly smaller than the saturated GS gain. Hence, if the AR coating of the device is good enough to sustain the maximum gain of the QD GS 共in this case, 45 dB兲, it will also be sufficient to avoid lasing from the upper levels for long devices, because the presence of ASE limits the gain of these upper levels. It is important to note that a more complete model for the WL 共e.g., including hole dynamics兲 would lead to a reduction of the maximum achievable gain from the WL. The large energy separation between the energy levels means that the GS is almost completely inverted for all device lengths until the point where ASE saturation starts to deplete the GS population 共around 6 mm兲. It is the high GS inversion 共corresponding to a population inversion factor, n sp , close to unity兲 combined with the small waveguide losses, which lead to the small NF. Good noise properties for QD amplifiers were also predicted by Komori et al.9 The NF shown in Fig. 3共b兲 is seen to be below 3 dB for short lengths, which simply reflects the fact that the gain is very low 共9 dB for L⫽1 mm). We are thus not within the high gain approximation, which is assumed when predicting the lower limit of 3 dB.10 For devices longer than the saturation length, the ASE saturation reduces the GS inversion significantly. This leads to a rapid increase in the NF indicating that it is not feasible to operate in this regime. The results presented in this letter obviously depend on the parameter values used, and since these are not yet very well known and there are only few experimental results on long QD amplifiers available, there is some uncertainty associated with the numerical values calculated. However, the mechanisms leading to the improved performance are quite general, indicating that the results are not specific to one type of QD amplifier as long as a number of key criteria are fulfilled. To summarize, these are: Moderately low modal gain, low differential gain, a sufficiently high-energy separation between energy levels of the QD and the WL 共comparable to the thermal energy or larger兲, and small waveguide losses.
A. Mecozzi and J. M. Wiesenfeld, Opt. Photonics News 12, 36 共2001兲. M. Grundmann, Physica E 共Amsterdam兲 5, 167 共2000兲. 3 R. H. Wang, A. Stintz, P. M. Varangis, T. C. Newell, H. Li, K. J. Malloy, and L. F. Lester, IEEE Photonics Technol. Lett. 13, 767 共2001兲. 4 M. Sugawara, N. Hatori, T. Akiyama, Y. Nakata, and H. Ishikawa, Jpn. J. Appl. Phys., Part 2 40, L488 共2001兲. 5 T. W. Berg, S. Bischoff, I. Magnusdottir, and J. Mørk, IEEE Photonics Technol. Lett. 13, 541 共2001兲. 6 P. Borri, W. Langbein, J. M. Hvam, F. Heinrichsdorff, M.-H. Mao, and D. Bimberg, IEEE J. Sel. Top Quantum Electron. 6, 544 共2000兲. 7 E. Desurvire and J. R. Simpson, J. Lightwave Technol. 7, 835 共1989兲. 8 F. Klopf, R. Krebs, J. P. Reithmaier, and A. Forchel, IEEE Photonics Technol. Lett. 13, 764 共2001兲. 9 K. Komori, S. Arai, and Y. Suematsu, IEEE Photonics Technol. Lett. 3, 39 共1991兲. 10 E. Desurvire, Opt. Fiber Technol.: Mater., Devices Syst. 5, 40 共1999兲. Downloaded 26 Mar 2010 to 192.38.67.112. Redistribution subject to AIP license or copyright; see http://apl.aip.org/apl/copyright.jsp 1 2