20 Science Park Drive ... sentence extracted from C, based on the assumption that ... Permission to make digital or hard copies of all or part of this work for.
Query Based Event Extraction along a Timeline Hai Leong Chieu and Yoong Keok Lee DSO National Laboratories 20 Science Park Drive Singapore 118230 {chaileon, lyoongke}@dso.org.sg ABSTRACT In this paper, we present a framework and a system that extracts events relevant to a query from a collection C of documents, and places such events along a timeline. Each event is represented by a sentence extracted from C, based on the assumption that “important” events are widely cited in many documents for a period of time within which these events are of interest. In our experiments, we used queries that are event types (“earthquake”) and person names (e.g. “George Bush”). Evaluation was performed using G8 leader names as queries: comparison made by human evaluators between manually and system generated timelines showed that although manually generated timelines are on average more preferable, system generated timelines are sometimes judged to be better than manually constructed ones.
Categories and Subject Descriptors H.3.1 [Content Analysis and Indexing] –Linguistic processing. H.3.3 [Information Search and Retrieval] – selection process.
General Terms Algorithms, Experimentation.
Keywords Event and Entity Tracking, Text Data Mining, Automatic Summarization, Timelines.
1. INTRODUCTION The growth of the World Wide Web means that users need tools to find what they want. In this paper, we attempt to summarize a big collection of documents that could have been returned by a query-based search, by placing sentences that report “important” events related to the query along a timeline. For this purpose, we assume that documents are time-tagged, and each sentence is assigned a date by using simple rules to resolve date expressions with respect to the document's date. While the definition of “importance” is subjective, events that are of interest to many people are often reported in many different news articles (from different sources). Updates and commentaries Permission to make digital or hard copies of all or part of this work for personal or classroom use is granted without fee provided that copies are not made or distributed for profit or commercial advantage and that copies bear this notice and the full citation on the first page. To copy otherwise, or republish, to post on servers or to redistribute to lists, requires prior specific permission and/or a fee. SIGIR’04, July 25–29, 2004, Sheffield, South Yorkshire, UK. Copyright 2004 ACM 1-58113-881-4/04/0007...$5.00.
of such events would also persist for a period of time. Our system made use of this property to determine if events are “important”. In our experiments, we used the Reuters Corpus Volume 11 and the English Gigaword2 Corpus for system development and evaluation respectively. We used event types (“earthquake”) and person names (e.g. “Blair”) for development and evaluation respectively.
2. RELATED WORK Past work on summarization focused on either summarizing single document [10], or summarizing similarities and differences in small clusters of documents, usually pertaining to the same topic [11][13][14]. The summarization tasks as defined by the require Document Understanding Conferences3 (DUC) summarizing clusters of around 10 documents. Recent DUC introduced summarization focused by a viewpoint or a question, but still from small clusters of documents. McKeown et al. [14]used different summarizers for different types of document clusters. Schiffman et al. [16] summarized collections of documents to produce biographical summaries, without taking into account temporal information. The biographies were generated using person-typing information, subject-verb associations, and by merging appositives. Although one of the source corpus (“Clinton” corpus) contains 1300 documents, the three examples of biographies given in [16] are generated from at most hundreds of sentences. Work has also been done on abstracting, where sentences are generated instead of extracted [2][13]. Kevin and Marcu[9] explored summarization by sentence compression. Summarization can also be based on information extraction systems[15], where the summary is generated from extracted templates. For multidocument summarization (MDS), the ordering of sentences within a summary has also been explored to produce coherent summaries for the reader[3][4]. However, the nature of the problem of sentence ordering in traditional MDS is more complicated as sentences tend to be strongly coupled since they often address the same or related events. In this paper, sentences extracted on a timeline usually refer to different events that happened on different dates. Most work on temporal aspects of linguistics addresses the annotation of temporal expressions [6], and the temporal attributes of events [12]. The DARPA ACE (Automatic Content Extraction)
1
http://www.reuters.com/researchandstandards/corpus
2
http://www.ldc.upenn.edu/Catalog/CatalogEntry.jsp?catalogId=L DC2003T05
3
http://duc.nist.gov
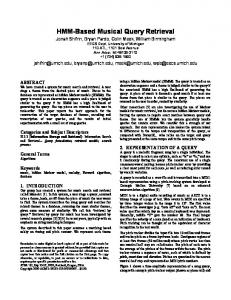
Figure 1 Framework for timeline extraction Given a corpus C and a query q 1. Get set of relevant sentences, i.e. get SC(q)= {sentence s from C | s mentions q.} 2. Resolve dates of events in these sentences: ∀s∈SC(q), date(s) = {dates of events regarding q mentioned in s} 3. Rank the set of sentences 4. Remove duplicate sentences 5. Order top N sentences {si}1≤i≤N along a timeline based on date(si).
task of Relation Detection and Tracking involves attaching temporal attributes to relations. The area of Topic Detection and Tracking also brought forth some work on summarization of incoming streams of information. Recently, Swan and Allan [19] pioneered work on timeline overviews. They extracted noun phrases and named entities salient in specific time periods, and attempted to organize them into stories by clustering the phrases into clusters. However, the user would still have to decipher the story from these clusters. Allan et al. [1] addressed temporal summarization of news topics by providing sentence-based summaries, where they defined precision and recall measures that capture relevance and novelty. Their work aimed at helping a person monitor changes in news coverage over time. Their system summarized documents on a topic by topic basis, each topic containing an average of around forty documents. While their summary is temporal in the sense that they worked on incoming stream of articles, and aimed at including in a summary sentences containing useful and novel information, their work did not deal with summarizing multiple events on a timeline. Smith [17] extracted associations between date and location and showed that associations detected corresponded well with known events. Kleinberg [8] modeled data streams to infer a hierarchical structure of bursts in the streams, and extracted bursts of term usage in titles of papers from conference databases. In this paper, our system summarizes documents returned by a query-based search. In the experiments conducted, each search returned thousands of documents. Although not all sentences in returned documents are considered, the number of sentences considered by our system still numbers in the thousands to tens of thousands. We aim to extract events related to an entity (e.g. “Bill Clinton”) or type of event (e.g. “earthquake”), by sentence extraction, along a timeline. In Section 3, we describe a framework for timeline construction, and defined two different measures, interest and burstiness, for ranking sentences. In Section 4, we describe practical implementations of the system. In Section 5, we discuss, using a case study, the pros and cons of the two measures defined. In Section 6, we show results of manual evaluation conducted with 4 human evaluators.
3. FRAMEWORK FOR TIMELINE CONSTRUCTION A framework of the algorithm is given in Figure 1. In this section, we describe two theoretical measures: interest and burstiness for ranking sentences.
3.1 Ranking Sentences “Important” events are often repeated in many news articles over a period of time surrounding the date of occurrence of the event, with possibly varying updates and commentaries. We define ranking measures to rate “importance” of sentences based on this principle
3.1.1 Ranking Metric: “Interest” We define “interesting events” in SC(q) (see Figure 1) as events that are a subject of interest in many sentences in SC(q). We define “interesting sentences” as sentences reporting “interesting events”. With such a definition, interest of a sentence s can then be quantified as Interest(s|q) = cardinal {s'∈ SC(q)’|s’ reports the same event as s regarding q} The sentences in the set SC(q) can then be ranked according to their interest.
3.1.2 Ranking Metric: “Burstiness” Reports of “important” events often cluster around the date of their occurrence. To sift out “important” events, we compare the number of reports of an event within and outside a date duration. Hence, we extract sentences that are strongly associated to the date duration surrounding the date of the sentence. Swan and Allan [19] converted documents to bags of features, which are noun phrases and named entities. They modeled the arrival of features as a random process with an unknown binomial distribution, and used the chi-square test to check for statistically significant associations between features and time periods. Features are then grouped into clusters by using chi-square tests to check for association between features. Smith[17] compared different measures of association between place and time, including chi-square, mutual information, and log likelihood ratio. In the experiments carried out, he showed that log likelihood ratio returns the highest mean reciprocal rank in detecting Civil War events. Kleinberg [8] detects events by using infinite state automata to model the stream of incoming emails, in which the bursts are modeled by the transitions between states of high and low “burstiness”. In an analogous manner to [19], if we model reports of events as a random process with an unknown binomial distribution, we can check for associations between events and dates. For each sentence s, we calculate the contingency table in Table 1. Table 1 Contingency Table for s in tk, where tk is the date duration k days before and after date(s)
s
s
tk
a
b
tk
c
d
The first row labeled tk contains counts of sentences within k days of date(s), and the second row outside k days of date(s). The first column labeled s contains counts of sentences that report the same event as s regarding q, and the second column contains counts of the rest of the sentences. Instead of taking a fixed value for k, we calculate the log likelihood ratio for each value of k from 1 to 10. Swan and Allan used maximum chi-square values in a range of dates as measure to sort features. Our definition of burstiness is analogous except that we used the log likelihood ratio [5]: Burstiness=LL(n), where LL(k) = log likelihood ratio for contingency table in Table 1, and n such that n≤10,∀k∈[1,n-1], LL(n)>LL(k)
4. IMPLEMENTATION In order to concentrate on the problem of ranking sentences, we made a few assumptions here for implementing steps (1) and (2) of Figure 1. In step (1), a sentence s is deemed relevant to query q, if one of the terms in q appears in s. In step (2), we resolve date(s) with a few simple rules described in Section 4.1. We also assume that only one event is mentioned per sentence: each sentence is mapped to one date. Moreover, one date is attached to each sentence: date(s) is a one-to-one mapping. In Section 4.3, we defined practical implementations of “interest” and “burstiness”.
4.1 Resolving Date While it is a difficult problem to correctly extract the chronological order of events from free text [12], we attempt only to attach dates to sentences extracted from news articles. We restrict ourselves to the case where C in Figure 1 is a news archive. We further assume that the first date expression detected in a sentence s is the date of the event mentioned in s. We crafted simple rules to detect date expressions in sentences, and resolve them to absolute dates using the article date as reference. For example, “today” will be resolved to be the article's date, “September” to mean the last month of September before the article's date, and “Sunday” to be the last Sunday before the article's date. Such dates may be a single day, a whole month or a whole year. In the case where no date expression is detected in the entire sentence s, date(s) is taken to be the date of publication of the article containing s. While this assumption may be frequently false in document types such as biographies, literary writings or historical texts, we found that it is a reasonable assumption for news articles. News, by definition, report up-to-date events. Previous work on analyzing streams of incoming news articles or emails [1][8][18] takes the date of reception of incoming items as the date of the item. Smith [17], in the context of digital libraries of historical texts, made used of dates and geographical terms extracted by their system. Even for news articles, we find that it is beneficial to do some date resolution for more effective sentence extraction. For example, in describing a current event, it is frequent to mention related events in history as context. However, in news articles, sentences relating past events tend to be brief and contain the date of the event, e.g. “The 1967 quake killed about 300 in the Venezuela capital and surrounding areas.”
4.2 Mapping sentences to vectors Both measures of interest and burstiness require a way of determining whether two sentences s and s’ report the same event regarding q. In order to compare sentences, we mapped each sentence to a vector. In IR, inverse-document-frequency (idf) is
often used for term weighting. The measure of idf must be calculated with respect to a corpus. Here, we used SC(q) explained in Figure 1 as the corpus to calculate idf. SC(q) is however, a set of sentences rather than documents. Instead of using the traditional idf, we use the inverse-date-frequency (iDf) for term weighting: sentences are grouped by dates rather than by documents. We used a cutoff of 3 for date-frequency: all terms that occur in 3 dates or less would have iDf calculated based on a date-frequency of 3. It is beneficial to use SC(q) as the corpus for term weighting as we are interested in “important” sentences in SC(q). Terms that are considered high content in another corpus may not be high content in SC(q). For example, for the query earthquake on the Reuters corpus (See Section 5), the five terms of lowest weights were: earthquake, said, richter, scale, and quake respectively. Besides removing stop words from each sentence vector, words that are found to be date expressions are also removed: e.g. words such as "February", "Saturday" will not be used in the sentence vector.
4.3 Sentences reporting the same event It can be quite subjective to determine whether two sentences s and s’ report the same event regarding q, as s may contain more or less information than s’, and people with different perspectives might decide differently. The decision of whether two sentences report the same event boils down to the problem of paraphrasing. Paraphrasing has been widely investigated in the domain of summarization, but mostly in the context of language generation[4]. Hatzivassiloglou et al.[7] clustered sentences using machine learning algorithms to learn from an annotated corpus. They used a log-linear regression model to convert various features to a sentence similarity value. In this paper, we use the cosine similarity between the vectors of the 2 sentences as the probability that they paraphrase each other:
� � P(s' reports the same event as s) = cosine(s ' ,s )
We can hence redefine interest and burstiness. Initially, we defined interest as:
∑ P(s' reports the same event as s) � � = ∑ cosine( s ' ,s )
Interest* (s) =
s'∈SC s'∈SC
However, due to low precision of the cosine measure to detect paraphrasing (see Section 5), we used the date dimension to filter away sentences that are unlikely to be paraphrases of each other: Sentences reporting events happening on different dates are unlikely to be paraphrases of each other. We redefine interest as
� � cosine(s ' ,s ) , Interest(s,T) = numdays s'∈SC,| date(s' ) - date(s) | ≤T
∑
numdays = ( number of days in date(s)) + 2T , where T is a constant. In practice, T should be adjustable by the user. In all our experiments, we set T to 10 days. It is necessary to normalize by numdays as date(s) can be a single day, a month or a whole year. For burstiness, we use a similar method for the calculation of the four elements in Table 1:
� �
∑cosine(s ' ,s )
a=
s'∈SC,| date(s' ) - date(s)| ≤T
� �
∑(1-cosine(s ' ,s ) )
b=
s'∈SC,| date(s' ) - date(s)| ≤T
∑
c=
� � cosine(s ' ,s )
s'∈SC,| date(s' ) - date(s)| >T
∑
d=
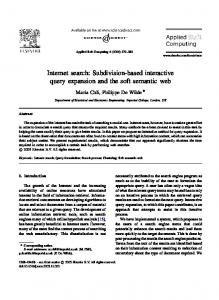
Figure 2 Graphs for query "earthquake(s) quake(s)". The 2 circles in the scatter plot for interest correspond to 2 major earthquakes in Iran, and the circle in the scatter plot for burstiness corresponds to an earthquake in Venezuela.
� � (1- cosine(s ' ,s ))
s'∈SC,| date(s' ) - date(s)| >T
With such definitions, the variables a, b, c and d are real numbers instead of integers, but the log likelihood ratio can still be calculated.
Histogram of sentence frequencies 400 300 200 100 0 0
4.4 Removing Duplicated Sentences A simple ranking of sentences by interest or burstiness would result in many similar, even duplicate, sentences at the top of the list. We found that sentences with similar dates often describe the same event. Moreover, in a timeline, it is necessary that not too many sentences be cluttered together at the same date. Hence, we decided to simply delete sentences that are “near” each other in terms of their dates. In order to decide the range of the neighborhood in which sentences are deleted, we define extent of each sentence for each of the measures interest and burstiness. For interest,
200 150 100 50 0 0
120 160 200 240 280 320 360
3
Preprocessing required to compute interest and burstiness are sentence segmentation, tokenization, and word stemming. Direct computation of the sum of cosines as defined in Section 4.3 would still be expensive if SC(q) contains a large number of sentences. However, after normalizing sentence vectors, the cosine between normalized vectors of s and s' is equal to their dot product. As the dot product is distributive with respect to addition, the sum of dot products used in the measures can be converted to a dot product of sums, i.e.
1
∑
80
Scatter Plot for Interest
2
∑
40
Number of days after 1s t Jan 1997
4.5 Efficiency
� � s ' ). s
120 160 200 240 280 320 360
Scatter Plot for Interest*
For all our experiments, we used P=80%. From the definition of burstiness, extent is naturally defined as the n in the equation defining burstiness in Section 3.1.2
(s�'. s� )= (
80
Number of days after 1s t Jan 1997
Extent-I=min{t | t∈[1,10], Interest(s,t) > P%*Interest (s,10)}
Extent-B = n such that n≤10,∀k∈[1,n-1], LL(n)>LL(k) For both measures, extents can take a maximum value of 10 days. While picking the top N sentences after ranking, sentences are discarded if they are within any of the extents of sentences already selected.
40
0 0
40
80
120
160 200 240 280 320 360
Number of days after 1s t Jan 1997
Scatter Plot for Burstiness 80 60
5. CASE STUDY ON DEVELOPMENT CORPUS For development, we conducted our experiments on articles from the corpus of Reuters Volume 1, dated from January to August 1997. In this section, we discuss the performance of our system using the query “earthquake(s)” and “quake(s)”. We found a
40 20 0 0
40
80
120 160 200 240 280 320 360
Num be r of days afte r 1st Jan 1997
chronology of major earthquakes in a Reuters article4 on the internet. (All quakes in this list "killed more than 1,000 people"). Although many earthquakes occurred in January to August 1997, only 2 of them were major enough to figure in this list: (i) an earthquake on 10 May 1997 in eastern Iran that “inflicted heavy damage on the towns of Qaen and Birjand”, and in which “1,560 people were killed”, and (ii) another earthquake on 28 Feb 1997 in northeastern Iran that hit Ardabil and Meshkinshahr, that “killed 1,000 people”. These 2 earthquakes correspond to the highest 2 peaks in the histogram of sentence frequency in the first graph of Figure 2. The next 3 graphs are scatter plots of interest*, interest and burstiness of the sentences in the year 1997. The scatter plot of interest* is messy due to the unreliability of the cosine measure for detecting that two sentences are reporting the same event. For example, the following 3 sentences have high cosine similarity, but are actually referring to 3 different earthquakes in Iran (i.e. minor quake on 18 February, moderately strong quake on 26 May, and the major quake on 28 February respectively):
1. Quake hits northern Iran, no casualties reported. 2. Quake jolts southwest Iran, no damage reported. 3. Iran rebuilds areas destroyed by February quake. The second graph (interest) shows peaks at more or less the same places as the histogram. This is natural if we consider the way interest is calculated. The last graph (burstiness), however, shows peaks at different points from the histogram. The two earthquakes in Iran do not have highest burstiness due to the fact that there were a few earthquakes on separate dates in Iran in the year 1997 (other than the 2 major ones). On the other hand, an earthquake in Venezuela in July 1997 shows high burstiness, being the only earthquake in Venezuela in the period of the news articles in SC(q). Table 2 Number of articles/sentences containing query term q in the evaluation corpus. q=Entity Name Berlusconi Blair Bush Chirac Chretien Koizumi Putin Schroeder Average
No. of articles 1619 4058 30239 3255 717 2394 4733 2620 6204
No. of sentences 4369 9720 96711 9648 1590 6527 11232 5671 18184
6. EVALUATION To the best of our knowledge, there is no annotated corpus available for the task of constructing timeline summaries from large corpora. Although corpora are available for generation of extracts or abstracts from small clusters of documents, we could not find any annotated corpora that is specific to our purpose of producing a query-based timeline summary from a large corpus. In order to evaluate our system, we performed a small experiment to compare our timelines against manually constructed timelines. For this evaluation, we chose to use articles from the first 6 months of 2002 from the English Gigaword corpus, as they were 4
http://www.alertnet.org/thefacts/reliefresources/228607.htm
the most recent in the corpus, and documents were available from three different sources: Agence France Press English Service, Associated Press Worldstream English Service, and The New York Times Newswire Service. For our evaluation, we used person names, namely, the eight leaders of the countries in G8 in 2002. The number of articles and sentences containing the query, q, for each experiment is listed in Table 2. From machine generated timelines, we automatically removed events that are not in the period of January to June 2002 (duration of the news articles). Such sentences exist due to the resolution of dates described in Section 4.1 For this evaluation, we used only the top ten sentences generated by each measure, interest and burstiness (after removal of duplicates). We employed four arts undergraduates majoring in history to help us evaluate our system. The evaluation was carried out in three phases: Phase 1: Evaluators were told to construct timelines of ten sentences for queries assigned to them by doing their own research. Each evaluator was assigned 4 queries so that we have exactly 2 manually constructed timelines per query. They were to select the most important events regarding the leader in the time period of January to June 2002. They were given 2 days to complete phase 1. Phase 2: They were then given 4 timelines (2 manually constructed timelines, a timeline generated by interest, and another generated by burstiness) for each of the 8 queries, and asked to answer questions on each timeline. They were also told to rank the 4 timelines for each query from best to worst, and to rank all 40 sentences from the 4 timelines from 1 to 40, in terms of importance. While ranking sentences, they were asked to tie ranks for sentences that relate “equivalent” events. They were not told which of the timelines were manually constructed. Phase 3: They were asked to judge on the dates of the events for the machine generated timelines, given the sentence and its source document. This evaluation attempts to compare manually constructed timeline abstracts with machine generated timeline extracts. Ideally, we should have asked the evaluators to read through the corpus and generate timelines by sentence extraction. However, the size of the corpus involved is prohibitory (thousands of articles per query). In this evaluation, the evaluators actually constructed the timelines independently of the corpus used by the system. We aim only to compare the qualities of manual and machine timelines based on the same query. Results gathered from the four evaluators are labeled H1 to H4, timelines generated by interest are labeled I, and those generated by burstiness are labeled B. Two examples of timelines (generated by H3 and I on Bush) are shown in Table 3 and Table 4 respectively. Results of the evaluation are summarized in Table 5 to Table 11. Table 5 shows the average scores for questions asked in phase 2. Evaluators were told to answer on a scale of 1 to 6 for questions in rows R1, R2, R3 and R4. The results in R1 of Table 5 showed that the 2 machine generated timelines are, on average, judged to be more representative than H2. In terms of comprehensibility and conciseness (R2 and R3), it is not surprising that humans did better than machine, as human constructed timelines are abstracts written by the evaluators. For
Table 3 Best ranked human generated timeline for Bush (average rank = 1.25, author=H3). The table is in chronological order. The rank column gives the original rank of each sentence as given in the timeline constructed by H3. Date
Sentence
Rank
2-Jan-02 The Democrats call Bush administration’s relationship to Enron into question.
9
30-Jan-02 Bush aims to rally public support for his war on terror and economic policies in his first State of the Union address.
1
30-Jan-02 Bush classifies Iraq, Iran and North Korea as the "Axis of Evil".
2
14-Feb-02 Bush announces an alternative to the Kyoto pact that he rejected.
10
18-Feb-02 Bush shows support for Koizumi's leadership in a speech to the Japanese legislature.
7
22-Feb-02 Bush meets Chinese President Jiang Zemin in a trip to China.
4
16-May-02 News breaks out that George Bush has known of the possibility of terrorist hijacking.
5
24-May-02 Bush and Putin conclude a treaty to reduce nuclear warheads by two-thirds.
6
7-Jun-02 Bush proposes the expansion of bureaucracy in order to deal with the terrorist threat.
3
Bush states that the US government will support the establishment of a temporary Palestinian state if Arafat is replaced 24-Jun-02 and terror stopped.
8
Table 4 Best ranked machine generated timeline for Bush (average rank = 3.25, metric=interest). The table is in chronological order. The rank column gives the rank of each sentence ordered by its interest score. Date
Sentence
Rank
27-Jan-02
EXP-BUSH-STATE-OF-UNION (Washington) _ On the preparations for President Bush's State of the Union address.
10
7-Feb-02
U.S. President George W. Bush said in a speech last week that North Korea was part of an "axis of evil" along with Iran and Iraq.
1
19-Feb-02 U.S. President George W. Bush has called Iraq part of an "axis of evil" that includes Iran and North Korea.
3
30-Mar-02
U.S. President George W. Bush said Saturday that Palestinian leader Yasser Arafat "can do a lot more" to prevent attacks against Israelis and that the United States supports Israel's right to defend itself.
7
9-Apr-02
Powell already was facing resistance by Israeli Prime Minister Ariel Sharon to President Bush's demand that Israel withdraw its troops from Palestinian areas of the West Bank.
8
WASHINGTON _ The United States is committed to a Palestinian state with Yasser Arafat as its likely leader, 5-May-02 President George W. Bush's foreign policy advisers said, heading off opposition expected from Israel's prime minister at his White House meeting this week.
6
20-May-02 Moscow _ U.S. President George W. Bush travels to Russia to meet Russian President Vladimir Putin.
5
3-Jun-02
Israeli Prime Minister Ariel Sharon will meet with President George W. Bush at the White House next week, just after Bush's weekend talks about the Middle East situation with Egyptian President Hosni Mubarak.
9
17-Jun-02 UNITED NATIONS _ Palestinians hope Bush will support a Palestinian state that is not provisional.
4
In a speech outlining his new Middle East peace strategy on Monday, Bush demanded that the Palestinians replace 24-Jun-02 Yasser Arafat with a new leadership "not compromised by terror" as a condition for supporting the creation of a Palestinian state within three years.
2
Table 5 Comparison of results between manually generated timelines H1 to H4 and 2 system generated timelines (I:interest, B:burstiness). Each cell contains 2 numbers: mean ± standard deviation of the responses of the 4 evaluators. R1 and R5 (hence R6) were asked regarding entire timelines. R2 to R4 were asked sentence by sentence for each timeline. R 1 2 3 4 5 6
Criteria Representative of media coverage (1=totally irrelevant to 6=most representative) Comprehensibility (1=totally incomprehensible to 6=totally comprehensible) Conciseness (1=long-winded to 6=concise) Importance (1=least important to 6=most important) Average ranking (1=best to 4=worst) Number of times ranked first
H1
H2
H3
H4
I
B
4.4 ± 1.1
3.3 ± 0.8
4.1 ± 1.1
4.3 ± 0.8
3.8 ±1.0
3.5 ± 1.0
5.5 ± 0.3 4.7 ± 0.5 4.7 ± 0.7 1.7 ± 0.6 6
5.3 ± 0.7 5.4 ± 0.6 4.0 ± 0.5 2.3 ± 1.2 5
5.2 ± 0.6 5.1 ± 0.6 4.6 ± 0.6 2.1 ± 1.1 6
4.9 ± 0.7 4.8 ± 0.5 4.5 ± 0.6 1.7 ± 0.8 8
4.5 ± 0.9 3.4 ± 0.7 4.4 ± 0.7 2.8 ± 1.1 6
4.3 ± 0.9 4.3 ± 0.7 3.8 ± 0.6 3.4 ± 0.8 1
Table 6 Rank correlation coefficient between evaluators for all timelines: mean ± standard deviation over the 8 queries H2 0.3 ± 0.2
H1 H2 H3
H3 0.4 ± 0.2 0.4 ± 0.2
H4 0.3 ± 0.3 0.5 ± 0.2 0.3 ± 0.2
H1 Berlusconi
Table 7 Rank correlation coefficient between evaluators and machine for timelines generated by interest(I): mean ± standard deviation over the 8 queries H1 H2 H3 H4
H2 0.3 ± 0.3
H3 0.3 ± 0.4 0.3 ± 0.2
H4 0.3 ± 0.5 0.5 ± 0.4 0.1 ± 0.5
I 0.3 ± 0.4 0.4 ± 0.3 0.1 ± 0.4 0.5 ± 0.2
Table 8 Rank correlation coefficient between evaluators and machine for timelines generated by burstiness(B): mean ± standard deviation over the 8 queries H1 H2 H3 H3
H2 0.4 ± 0.3
H3 0.4 ± 0.2 0.4 ± 0.1
H4 0.3 ± 0.4 0.5 ± 0.3 0.4 ± 0.3
B 0.0 ± 0.3 0.2 ± 0.3 0.1 ± 0.2 0.2 ± 0.3
Table 9 “Equivalent” events between timelines. T1 and T2 are the 2 manually constructed timeline per query. Each cell contains the mean ± standard deviation over judgements of the 4 evaluators. Berlusconi Blair Bush Chirac Chretien Koizumi Putin Schroeder Average
Table 10 Number of duplicate events for timelines generated by interest, burstiness, and timelines constructed by each evaluator: mean ± standard deviation over judgements by 4 evaluators.
T1-T2
T1,T2-i
T1,T2-b
i-b
0.5 ± 0.6 0.8 ± 0.5 1.5 ± 0.6 2.0 ± 0.0 1.0 ± 1.4 0.8 ± 1.0 1.3 ± 0.5 1.8 ± 1.0 1.2 ± 0.7
2.0 ± 2.2 0.8 ± 0.5 2.5 ± 0.6 2.5 ± 1.3 2.0 ± 1.4 3.3 ± 0.5 2.0 ± 0.8 1.8 ± 1.0 2.1 ± 1.0
1.5 ± 1.3 0.8 ± 0.5 2.8 ± 0.5 2.5 ± 1.3 2.5 ± 2.4 3.5 ± 0.6 2.3 ± 0.5 2.0 ± 1.4 2.2 ± 1.1
2.5 ± 1.3 2.8 ± 1.3 2.8 ± 0.5 1.5 ± 0.6 2.3 ± 1.5 3.5 ± 1.3 3.0 ± 0.8 2.3 ± 0.5 2.6 ± 1.0
R4, interest timelines beat H2 again (on average) in terms of importance of the events related in the timelines. R5 and R6 are compiled from rankings the evaluators gave to the 4 timelines for each query. For R5, machine timelines are on average worse ranked than human timelines. R6 shows that interest timelines are frequently (6 times) judged to be better than human timelines. Although H2 fared worse than I for R1 and R4, it is generally better ranked. This shows that representativeness of timelines and importance of events are not the sole criteria for ranking timelines: readability, or conciseness, might be part of their criteria. The high standard deviations of the scores in Table 5 do not allow us to conclude in favor of machine timelines with respect to H2. However, R6 seems to show that timelines based on interest are as frequently ranked first as manually constructed timelines, whereas timelines based on burstiness are ranked first only once. In Phrase 2, evaluators were asked to rank sentences from 4 timelines from 1 to 40 for each query, tying ranks for sentences
Blair
0±0
Bush
0±0
Chirac
0.3± 0.5
Chretien
H2 0±0
Putin Schroeder
0±0
Average
0.1± 0.1
H4 0±0
0.5± 0.6 0±0
0.3± 0.5 0.5± 0.6 0.3± 0.5
Koizumi
H3
0.3± 0.4
1.5± 3.0 0.5± 1.0 0±0 1.0± 0.0
0.4± 0.1
0.3± 0.5 0.6± 1.1
I 1.3± 1.5 1.8± 1.7 2.0± 2.0 2.3± 3.9 1.8± 2.4 1.8± 1.7 2.0± 1.4 1.0± 1.4 1.7± 2.0
B 0±0 0±0 0±0 1.5± 2.4 1.5± 1.7 0.8± 1.0 0.5± 1.0 0±0 0.5± 0.8
Table 11 Event dates agreement (%) between evaluators and machine for machine-generated timelines. The first (second) number in each cell shows the percentage agreement given 0 (+/1)-day grace. H1 H2 H3 H4
H2
H3
H4
I
B
33/38
20/35
31/34
38/39
39/40
39/68
64/70
78/79
70/78
48/81
46/68
44/81
65/68
80/84
relating equivalent events. Table 6, 7 and 8 show the average correlation coefficient between rankings produced by the evaluators and machines for the 8 queries. (Due to the presence of tied ranks, it is inappropriate to use Spearman’s coefficient). On average, there is higher human-human correlation than humanmachine correlation, but correlation is at best moderate in all cases. From tied ranks, we can calculate the number of sentences that the evaluators think are referring to “equivalent” events. Table 9 shows the average number of events that evaluators think are equivalent between timelines. The low agreement between human timelines (T1-T2) is to be expected, as evaluators had the freedom to do their own research and had limited time. To compare with machine timelines, the 2 human-generated timelines are merged as a single timeline. Table 9 shows that there are on average around 2 event matches between machine-generated timelines and the merged human-generated timelines. Table 10 shows the average number of duplicate events found by the evaluators per timeline. We also evaluated the accuracy of our method of resolving dates (described in Section 4.1). We asked all 4 human evaluators to find the date of the event described in all machine-generated timelines given the source documents of the sentences (without applying their own knowledge of the events). Dates that are not explicitly stated, but can be reasonably inferred are also accepted.
If a reasonable date cannot be found in the source document, they will state the date as “unknown”. The inter-human and the human-machine agreement rates given 0 and +/- 1 day grace are shown in Table 11. When an evaluator states that the date is "unknown", and the machine attached a date to the event (which the machine always does), then the event date is counted as wrong. We observed that the variability of agreement rates (both human-human and human-machine) is quite large. This indicates that resolving dates can be inherently ambiguous. We also observed that human-machine agreement rates are higher than most inter-human agreement. This might be due to the bias that machine timelines present to each evaluator.
7. CONCLUSION AND FUTURE WORK We have described a system for extracting sentences from a big corpus to be placed along a timeline given a query from the user. This allows users to have quick overviews of events relating to their queries. Unlike previous work on summarization, we summarize from a big corpus and paid special attention to the time dimension of the summary. Swan and Allan [19] constructed timelines by extracting clusters of noun phrases and named entities. Our work has a few advantages over [19]: (i) efficiency: expensive operations such as noun phrase chunking and named entity recognition are not required. (ii) Sentences are better units of information as they allow quick access to their source documents, and may by themselves be informative enough for the user. Evaluation shows that although there is low inter-human agreement on the top ten events for G8 leaders, human evaluators found machine timelines representative of media coverage, and sometimes judge them to be better than human constructed timelines. We believe that this system can serve as an aid to users doing research on entities or event types that are well covered by news articles. Currently, this system works independently of any search engine. It is our intention to integrate it with a search engine so that it can work real time on user queries.
8. REFERENCES [1] James Allan, Rahul Gupta, and Vikas Khandelwal. Temporal summaries of new topics. In Proceedings of the 24th Annual International ACM SIGIR Conference on Research and Development in Information Retrieval, pages 10-18, 2001.
[7] Vasileios Hatzivassiloglou, Judith Klavans, Melissa Holcombe, Regina Barzilay, Min-Yen Kan, and Kathleen KcKeown. SimFinder: A Flexible Clustering tool for Summarization. In Proceedings of the Workshop on Automatic Summarization, NAACL2001, pages 41-49, 2001. [8] Jon Kleinberg. Bursty and Hierarchical Structures in Streams. In Proceedings of the 8th ACM SIGKDD International Conference on Knowledge Discovery and Data Mining, pages 91-101, 2002. [9] Kevin Knight and Daniel Marcu. Statistics-based summarization--- step one: Sentence compression. In Proceedings of the 17th National Conference on Artificial Intelligence, pages 703-710, 2000. [10] Julian M. Kupiec, Jan Pedersen, and Francine Chen. A trainable document summarizer. In Proceedings of the 18th Annual International ACM SIGIR Conference on Research and Development in Information Retrieval, pages 68-73. 1995. [11] Inderjeet Mani and Eric Bloedorn. Summarizing Similarities and Differences among related documents. Information Retrieval 1:35-67, 1999. [12] Inderjeet Mani and G. Wilson. Robust temporal processing of news. In Proceedings of the 38th Annual Meeting of the Association for Computational Linguistics, pages 69-76, 2000. [13] Kathleen McKeown, Regina Barzilay and Vasileios Hatzivassiloglou. Towards Multi-Document Summarization by Reformulation: Progress and Prospects. In Proceedings of the Sixteenth National Conference on Artificial Intelligence, pages 453-460, 1999. [14] Kathleen McKeown, Vasileios Hatzivassiloglou, Regina Barzilay, Barry Schiffman, David Evans and Simone Teufel. Columbia multi-document summarization: approach and evaluation. In Proceedings of the Document Understanding Workshop (DUC), 2001. [15] Dragomir Radev and Kathleen McKeown. Generating natural language summaries from multiple on-line sources. Computational Linguistics. 24-3. 469-500. 1998.
[2] Regina Barzilay, Kathleen McKeown, and Michael Elhadad. Information Fusion in the Context of Multi-Document Summarization. In Proceedings of the 37th Annual Meeting of the Association for Computational Linguistics, pages 550-557, 1999.
[16] Barry Schiffman, Inderjeet Mani and Kristian J. Concepcion. Producing Biographical Summaries: Combining Linguistic Knowledge with Corpus Statistics. In Proceedings of the 39th Annual Meeting of the Association for Computational Linguistics, pages 450-457, 2000.
[3] Regina Barzilay, Noemie Elhadad, and Kathleen McKeown. Inferring Strategies for Sentence Ordering in Multidocument News Summarization. Journal of Artificial Intelligence Research 17: 35-55, 2002.
[17] David A. Smith. Detecting and Browsing Events in Unstructured Text. In Proceedings of the 25th Annual International ACM SIGIR Conference on Research and Development in Information Retrieval, pages 73-80, 2002.
[4] Regina Barzilay. Information Fusion for Mutlidocument Summarization: Paraphrasing and Generation. Ph.D. Thesis, Columbia University, 2003.
[18] Russell Swan and James Allan. Extracting Significant Time Varying Features from Text. In Proceedings of the 8th International Conference on Information and Knowledge Management, pages 38-45, 1999.
[5] Ted Dunning. Accurate methods for the statistics of surprise and coincidence. Computational Linguistics. 19(1): 61-74. 1994. [6] Lisa Ferro, Inderjeet Mani, Beth Sundheim and George Wilson. TIDES Temporal Annotation Guidelines Version 1.0.2. Mitre Technical Report. 2001.
[19] Russell Swan and James Allan. Automatic Generation of Overview Timelines. In Proceedings of the 23rd Annual International ACM SIGIR Conference on Research and Development in Information Retrieval, pages 49-56, 2000.