Erschienen in: Carolin Müller-Spitzer (Hrsg.): Using online dictionaries. Berlin, Boston: De Gruyter, 2014. (Lexicographica : series maior - 145), S. 189–204.
Alexander Koplenig, Carolin Müller-Spitzer
Questions of design Abstract: All lexicographers working on online dictionary projects that do not wish to use an established form of design for their online dictionary, or simply have new kinds of lexicographic data to present, face the problem of what kind of arrange ment is best suited for the intended users of the dictionary. In this chapter, we pre sent data about questions relating to the design of online dictionaries. This will provide projects that use these or similar ways of presenting their lexicographic data with valuable information about how potential dictionary users assess and evaluate them. In addition, the answers to corresponding open-ended questions show, detached from concrete design models, which criteria potential users value in a good online representation. Clarity and an uncluttered look seem to dominate in many answers, as well as the possibility of customization, if the latter is not connected with a too complex usability model.
Keywords: screen layout, clarity, usability, adaptability
Carolin Müller-Spitzer: Institut für Deutsche Sprache, R 5, 6-13, 68161 Mannheim, +49-(0)621-1581429,
[email protected] Alexander Koplenig: Institut für Deutsche Sprache, R 5, 6-13, 68161 Mannheim, +49-(0)621-1581435,
[email protected]
1 Introduction “The challenge [...] is to try to assess which particular e-lexicographic Solutions work best (and for whom, and under what circum stances), so that future electronic dictionaries can be made more effective than their paper predecessors, and more effective than the dictionaries available today.” (Lew, 2012, p. 344)
Tarp developed four categories of digital dictionary “in terms of both their present Situation and their future possibilities” (Tarp, 2011, p. 58) in analogy to the famous quote which is assigned to Henry T. Ford:1 In his opinion, almost all actual online dictionaries belong to the “faster horses” category, because they do not use the full ränge of possibilities of the digital medium.
1
See http://quoteinvestigator.com /2011/07/28/ford-faster-horse/ for a discussion of whether this
attribution is correct (last accessed 13 July 2013).
19 0 ------ Alexander Koplenig, Carolin Müller-Spitzer
“Moré than 99 per cent of all lexicographical works on electronic platforras are probably Fastet horses of this kind, which shows that lexicography has still a long way to go until it has fully adapted to the new technologies.” (Tarp, 2011, p. 60)
Tarp qualifies all digital dictionaries as faster horses which are presented in a very similar way to printed dictionaries. However, a quick glance at some Contemporary electronic dictionaries reveals that there are already clear differences between online dictionaries and printed ones in more than l‘}v> of cases. Instead of arranging the dictionary entries unidimensionally using compressions and common abbreviations typical of conventional printed dictionaries, alternative ways of presenting word entries in online dictionaries can be and are already being used (cf. Lew, 2012). However, there has so far been little empirical research into the basic design of dic tionaries. One exception is Tono (Tono, 2000) who tested the usefulness of three interfaces (i.e. traditional, parallel, layered) against paper dictionary (control) conditions (cf. also Dziemanko, 2012, p. 328). There are also some studies on quite a specific question relating to the design of dictionary entries, namely the use of socalled sign-posts or menus, i.e. special guiding elements for identifying word senses in a polysemous entry (Lew & Tokarek, 2010; Lew, 2010; Nesi & Tan, 2011), in one case with the aid of eye-tracking procedures (Tono, 2011). Therefore, lexicographers who do not wish to choose an established form of presentation, or simply have to present new kinds of data, face the problem of what kind of arrangement is best suited for the intended users of the dictionary. On the question of how to arrange thesaurus data in a dictionary, Trap-Jensen and Lorentzen (Trap-Jensen &Lorentzen, 2011, pp. 177-178) argue that: “This Organization also reflects the editor’s way of organizing the them atic group. There has, however, been heated discussion among the editors whether this is also the best way of pre senting data.”
A similar question has also been debated in relation to elexiko, an online academic monolingual dictionary for German (cf. Klosa et al., this volume). In elexiko, the entries consist of a large spectrum of microstructural items. Thus it did not seem to be a feasible option to arrange the items one below the other on the website; it seemed better to allocate them appropriately over the screen or different screens. So in the end, the final decision for a design was just based on a discussion within the project because there were no relevant empirical studies. In elexiko, a tab presenta tion was chosen, which allows selective switching between different components, and where different groups of items are distributed to different pages. On the one hand, the potential advantage of this design strategy is a greater amount of clarity. On the other hand, the disadvantage is that a quick overview of the entire entry is not possible. Therefore, this leads to the atomization of linguistic relations, a prob lem which some view as criticai in dictionaries generally:
Questions of design —
191
“Typically, the particularised presentation of lexical data in sem asiological dictionaries, i.e. the individualised access to each lemma entry, does not bring the system atic nature of such phenomena to the fore, but rather obscures it by distributing the members of the set across the whole m acrostructure. For some dictionary use situations, this is not a major issue, and some lexicographers counterbalance this effect by including system atic m orphological or syntactic overview tables (inflection paradigms, inventories of closed d a ss item s, subcategorisation tables, etc.) into their dictionaries, for exam ple as outer texts, in an appendix or in a dictionary grammar [...].” (Bothma, Faaß, Heid, & Prinsloo, 2011, p. 297)
This atomization may be a drawback of the tab view, but the requirement not to overload the screen by providing an adequate, easy-to-read basic design is fulfilled. As this example illustrates, it is not possible to achieve all desired properties with one basic design; usually each design has its particular advantages and disad vantages. Therefore, the interesting issue is what aspects potential dictionary users highlight as positive or negative in different approaches to screen designs. One question is whether the clarity of the design is considered to be essential, or if it is more important to be able to see as much Information as possible at a glance. This also raises the question of whether - as is pointed out in the quote from Lew - dif ferent user groups make different evaluations. A hypothesis that might be put for ward for testing is, for example, that translators, who are usually under severe time pressure (cf. Bowker, 2012), prefer to have a quick overview with the entire entry presented on one screen instead of a very widely distributed view. So, the Provision of empirical data could help those working on lexicographical projects to reach various decisions in this context. In this chapter, we present our evaluation of the question of how to arrange an entry with a detailed microstructure which is divided between different screens or different parts of a screen, again using a survey design, since this problem is difficult to address using log file analyses alone. To do so, we selected four prototypical ways of presenting word entries for academic dictionaries. We chose this type of dictionary both because these dictionaries are especially affected by the question of how to present word entries, and because there are no studies on the layout of this kind of dictionary, except for Bank (2010, 2012), which is, however, more focused on the usability of the dictionaries than on questions of design. Therefore, we were interested not only in the assessment of individual views, but also, and in particu lar, in the reasons for this assessment. As a result, more general conclusions can be drawn about important aspects of design. Since this issue was only one among a number of others in the second questionnaire (cf. Koplenig/Müller-Spitzer: First two international studies, this volume), participants only had 10 minutes to complete this section, so we could not go into more detail.
192
Alexander Koplenig, Carolin Müller-Spitzer
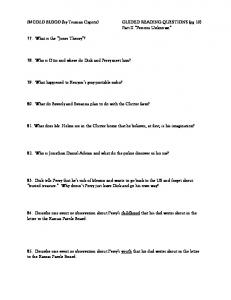
2 Method In one set of questions, respondents to our second study were asked to rate different basic alternative ways of presenting word entries in an online dictionary and to decide which they preferred. All alternatives included in the survey illustrated the same word entry (“summer”) covering (as far as possible) identical content. All alternatives except the last one were implemented using ja v a script.2 Thus, the participants could interactively navigate their way through the content of the word entry. The first alternative is an adaption of the well-known Microsoft Windows Ex p l o r e r v ie w (cf. Figure 1). In this layout, the word entry is structured as a tree. The user can change the displayed information by expanding (with a click on the plus sign) or collapsing (with a click on the minus sign) different parts of the nodes. Two examples of online dictionaries that use this kind of layout are the Danish diction ary ‘Den danske Ordbog’3 and the ‘Algemeen Nederlands Woordenboek’,4 an online dictionary of Contemporary Dutch. .
summer "season" E
Grammar Part of Speech: nourr (countable, uncountable) summers Plural:
E
Paraphrase
£E
typical contexts
E
Sense relations
Fig. 1: Explorer view.
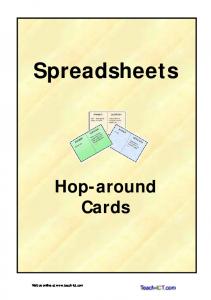
The second layout is structured as a table, with different modules of information. The Digital Dictionary of the German Language (DWDS)5 uses a screen layout that allows the user to select between multiple panels. (However, in the case of the DWDS, the different panels do not consist of different parts of one word entry as in our example, but of additional information about an entry, such as corpus samples etc.) This view is called the P a n el V ie w (cf. Figure 2).
2 We thank our colleague Peter Meyer for preparing the relevant scripts. 3
http://ordnet.dk/ddo (last accessed 13 July 2013).
4
http://anw .inl.nl/ (last accessed 13 July 2013).
5 http://www.dwds.de (last accessed 13 July 2013).
Questions of design —
193
summer "season"
Paraphrase
Grammar
the wärmest season of the year, between spnng and autumn
Part oi speech noun (countable. uncountabie) Plural
summers
CtaUon
Typlcal contexts
Sense relations
a hot. wet. dry summer. in the summer o12006 summer i$ comtng. nas amved. c s summer. to spend tne summer oy m e sea. m me mountams. we are gomg on hoftdaythts summer. ln me rWddie o* the Summer, tnis. next. last summer. smce last summer. an summer »ong for one summer. Dom m summer and m winter
Synonym s:
m e warm season
Ineompatlbl« p a rtn trs: spnng. autumn, fai, wnter Hyporonym s: season P arttronym s:
year
Partonym s:
May, September. June. July. August
Fig. 2: Panel view.
The third alternative way of presenting word entries is the so-called t a b v ie w (cf. Figure 3), which allows selective switching between different components (‘tabs’) of the word entry. This layout structure is used in elexiko,0 a monolingual German dictionary and ‘ELDIT’,7 an electronic learners’ dictionary for German and Italian.
summer "season"
Grammar
Paraphrase
Typical contexts
Sense relations
Grammar
Part of speech: noun (countable, uncountable) Plural: summers
Fig. 3: Tab view.
6
http://ww w .elexiko.de (last accessed 13 July 2013).
7 http://w w w .eurac.edu/eldit (last accessed 13 July 2013).
194 —
Alexander Koplenig, Carolin Müller-Spitzer
The last alternative we presented was a PRiNT-oriented Version of the entry (cf. Fig ure 4), since there are still some online dictionaries which closely resemble their printed counterparts, e.g. the French online dictionary TLFi.8 summer. noun (countaDle, uncountaBle): the wärmest season ot the year, between spring and autumn, a hot, wet, diy summer; in the summer of 2006, the summer is coming, has arrived; Its summer; to spend the summer By the sea, in the mountains; we are going on holiday this summer; in the middle of the summer, this. next, last summer; since last summen all summer long; for one summer; both In summer and In winten Syn.: the warm season; Incomp. autumn. fall, spring, Winter; Hyper, season; Parter.: year; Parto. May, September, June. July, August
Fig. 4 : Print view.
The procedure was as follows. First, every respondent was shown the four alterna tive views one after another. The alternatives were randomly selected to avoid any order effects. After the respondents had had the opportunity to have a look and try out each alternative, they were asked to rate all four types of presentation with respect to the following characteristics, using 7-point Likert scales: Quality (1 = not good, 7 = very good); Arrangement (1 = not well arranged, 7 = very well arranged); Comprehensibility (1 = not comprehensible, 7 = very comprehensible). After that, the participants were asked to rank the options according to their preference. The best type of presentation was ranked first, while the type of presentation the re spondent liked second best was ranked second, etc. When the respondents had finished the ranking task, they were shown the view they had rated best and asked what they particularly liked about it in an open-ended question. To identify potential user group differences, we used similar background varia bles to those in the last section: academic and Professional background and the language Version of the survey.
3 Results 3.1 Descriptive results All the ratings of all four alternatives were averaged to form a reliable scale of rat ings, with higher values indicating higher ratings.9 Table 1 summarizes the average
8
http://atilf.atilf.fr/ (last accessed 13 July 2013).
Questions of design —
195
ratings and first rank percentages for each alternative way of presenting word entries. Alternative
Mean-rating3
Ta b V iew
5.43
1.39
SD
First rank percentage
42.82
Pa n e l V iew
5.15
1.46
32.82
Ex p lo r e r V iew
4.93
1.44
17.69
P rint V iew
3.36
1.55
6 .67
aAll means are significantly different from each other as indicated by separate t-tests (ps < .05).
Tab. 1: Means and standard deviations of the ratings and first rank percentages for each tested view.
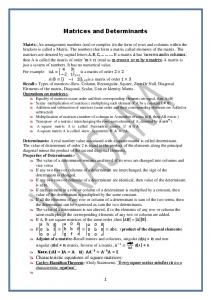
The T a b V ie w was both rated best and chosen as the best view most often. Although the P a n el V ie w and the E x p l o r e r V ie w received somewhat lower, but still high rat ings, they were chosen less often as the favourite view. The P r in t V ie w was rated worst, as well as chosen least often as the best view.
3.2 Subgroup analyses To analyze potential group differences, we conducted several X2 difference tests. Neither language Version (cf. Table 2),10 nor academic background11 are significant predictors of preference for a screen format. However, there is a significant relation ship between Professional background and preferred view (cf. Table 3):12 non translators strongly prefer the tab view - roughly one out of two non-translators prefers this way of presenting word entries. Most translators prefer the panel view (17/11%), although almost as many respondents in this group choose the tab view (34.69%).
9
To fest for reliability we used Cronbach’s alpha. All the coefficients were above .89, indicating
that the scales have a strong internal consistency. However, we only compared the percentage of first rank preferences, since it does not seem m eaningful to compute means and standard deviations of a ranking of four items.
10 X2(3) = 4 .2 0 , p = .24. 11 X2(3) = 3 .0 8 , p = .38. 12 X2(3) = 6.38, p < .10.
196 —
Alexander Koplenig, Carolin Müller-Spitzer
|
Tab
]
Matrix
|
Explorer
Fig. 5: Pie chart of the view rated best.
First rank
Language Version German
English
Total
T a b V iew
3 8 .2 4
4 7 .8 5
4 2 .8 2
P an el V iew
3 6 .7 6
2 8 .4 9
3 2 .8 2
E x p l o r e r V iew
18 .1 4
17 .2 0
1 7 .6 9
P rint V iew
6 .8 6
6 .4 5
6 .6 7
Tab. 2: Percentage of first ranks as a function of language Version.
First rank
Professional background Non-translator
Translator
Total
T a b V iew
4 7 .7 4
3 4 .6 9
4 2 .8 2
P an el V iew
3 0 .0 4
37 .4 1
3 2 .8 2
E x p l o r e r V iew
1 6 .0 5
2 0 .4 1
1 7 .6 9
P rint V iew
6 .1 7
7 .4 8
6 .6 7
Tab. 3: Percentage of first ranks as a function of Professional background.
As an interim conclusion, two things can be said: firstly, the tab view is - on aver age - the favourite; secondly, the subgroup analyses do not paint a clear picture, with the possible exception that translators seem to prefer the panel view.
Questions of design —
197
3.3 Analysis of the open-ended responses To explain why respondents preferred one type of presentation over the others, we manually inspected the answers to the open-ended question (“This is the view you rated best. What do you particularly like about it?”). Here, some participants justified their selection in some detail, as well as in other parts of our studies it became obvious that the willingness to answer open-ended questions was higher than expected (cf. Müller-Spitzer: Contexts of dictionary use, this volume). To illustrate this, 2-3 complete typical responses for each type of view are listed below. For example, participants gave the following reasons for preferring the tab view: - Clear simple view for me to look at. I can easily see that there are other types of information available to me besides the tab I’m on, but I don’t actually have to navigate through them unless they’re what I’m looking for. - I like that it doesn’t force the user to scroll down like the one with the -/+ does. It’s clearly separated, but easy to view the other features. The one thing that I would change is have the definition always visible just under the word. Then the Grammar, Sense Relations, and Typical Contexts are visible just underneath for the user to click and still see the definition just above. Two participants eite the following reasons for preferring the panel view: - Everything is available, in a consistent place on the page. After a few words you know where to look every time, but you dont have to click to see anything, and you dont have to read continuous text to jump to the information you seek. - gives the sense of overview as well as the benefit of detail; does not require further investigation of how the user interface works; immediacy of content; presents information that otherwise the user might not have known to consider. Regarding the explorer view, the possibility of easily gaining an overview was highlighted: - It’s (presumably) possible to see the information I want without too much noise (and hopefully without too much clicking on the + signs as well). Good to have a structured overview without having to read the whole screen or having the necessary information on separate tabs with no way to see it all together. - That you are able to only view the information you want to view (no information overload). It’s clearly marked so you know what your options are and it’s easy to open and close sections (but also easy to see them all at once if you want). Inter alia, the following reasons were mentioned for choosing the print view: - All the information is available, and users dont have to know the names of cate gories, such as paraphrasing, parts of speech, etc. The definition is clear and
198 —
-
-
Alexander Koplenig, Carolin Müller-Spitzer
visible, as is everything eise. It looks like a print dictionary entry, which is also nice. Compact in the field of view. Quickly scannable for all the available infor mation. Once the format it understood, can be quickly scanned for location of given types of related information. It is what I am used to. I am a power user, a Professional writer, and I am 66, so I am fixed in my ways. Category
Examples
Clarity
easy to read clearly separated uncluttered
No need to click
no clicking involved no need to click on anything all information can be accessed without clicking through the links doesn’t force the user to scroll no need to scroll simple not too much information at once concise easy to navigate easy to use comprehensible stylish visually appealing large buttons functional intuitive consistent it is possible to select only the information required adaptability of dictionary contents; 1can choose information unnecessary for me is not shown without sacrificing information to brevity hierarchical like the one 1am used to similar to other applications consistent with web browser formatting quick, open view presents all the data quickly does not take up traffic if used on a mobile phone
No need to scroll No information overload
Navigation
Look & Feel
Efficiency
Adaptability/Selectivity Essential Information
Familiarity
Quickness
Others Don’t know/no answer Tab. 4: Coding scheme used to categorize the open-ended question.
Questions of design —
Category
Preferred alternative of presentation Tab Panel Explo Print
199
Total
X2 / p-valuea
rer
Clarity No need to click Navigation Adaptability/Selectivity No Information overload Essential Information Efficiency Look & Feel
63.64a 5.45 36.12 32.12 24.24
55.12 76.38 29.13 3.94 8.66
56.06 16.67 25.76 56.06 16.70
28.00 16.00 16.00 8.00 28.00
57.18 31.59 40.81 25.33 18.54
11.76 / 0.10 179.64/0.00 5.92/1.00 71.68 / 0.00 13.30 / 0.05
12.73 10.30 12.73
12.60 11.02 4.72
22.73 9.09 7.58
4.00 12.00 16.00
13.84 10.44 9.40
0.79 6.30 3.15 0.79 212.60 categories
6.74 / 0.97 0.24/1.00 6.94/ 0 .89 49.28 / 0.00 1.67/1.00 2.88/1.00 2.0 0/1 .00
1.52 40.00 8.36 7.58 12.00 6.53 0.00 0.00 2.35 0.00 0.00 1.04 180.00 215.40 222.73 for each alternative in b old.b P values are
Familiarity 12.12 Quickness 5.45 Others 3.03 No need to scroll 1.82 220.00 Total aThe three most frequently mentioned Bonferroni adjusted.
Tab. 5: Reason for preference (percentages) as a function of chosen alternative of presentation.
To make this data analyzable, several categories were created in a bottom-up process in order to summarize recurring arguments. Then, the data were coded according to the method of structuring (Diekmann, 2010, pp. 608-613; Mayring, 2011). Table 4 presents the developed categories and provides excerpts of typical answers for each category. In Table 4, the frequency distributions of the categories for each alternative are displayed. The three most frequently mentioned categories for each alternative are highlighted. All alternatives are preferred for being clear, as ‘Clarity’ is the most mentioned criterion overall (57.18%), especially by respondents who favour the tab view (63.64%). Compared to the panei view (3.94%) and the print view (8.00%), both the tab view (32.12%) and the explorer view (56.06%) stand out for being adaptable to the preferences of the user. This difference is highly significant.13 A user interface that is easy to navigate also seems to be an important factor in the decision, for respondents who chose the tab view (36.12%), those who chose the panei view (29.13%), and those who chose the explorer view (25.76%). In relation to the three other ways of presenting word entries, the panei view (76.38%) is preferred because it allows the user to access all Information without clicking.14 Unsurprising-
13 X2(3) = 71.68, p < .00. 14 X2(3) = 179.64, p < .0 0 .
200 —
Alexander Koplenig, Carolin Müller-Spitzer
ly, the print view is mostly chosen for being familiar (40.00% ). The contrast to the other three alternatives is highly significant (cf. Table 5).15
4 Discussion Our analyses show that most of our respondents tended to prefer the tab view. Po tential group differences in this context only seem to play a minor role. Further analyses (not reported here) reveal that neither command of German (in the German-language version)/command of English (in the English-language Version), nor linguistic background, nor age of participants affect the outcome: in almost every subgroup, the tab view receives the most first-place votes. The analyses of the openended responses show that the respondents like this way of presenting word entries because it is clear, easy to navigate, and adaptable. One exception is translators, as shown above. Thus, the initial hypothesis that translators may prefer a view that provides all the data at a glance can be considered as confirmed. At the same time, however, the differences are quite small, so the significance of this result should not be overestimated. It is not possible to conclude from the data that the tab view is preferred in actual situations of dictionary use, because e. g. the disadvantage of the lack of Over View does not apply in the same way in the questionnaire Situation as in an actual dictionary consultation. Rather, it is an assessment of the helpfulness of the basic design which was evaluated here. However, the responses to the open-ended ques tion clearly show that the main advantages and disadvantages were also clear to our participants in the study context. For example, a recurring argument for choosing the panel view is that it is possible to see everything at once, such as in the follow ing answer: The information is well-ordered. All sections of the entry can be viewed either simultaneously or separate ly (which is what the view with tabs cannot do). Similarly, someone who has decided on the tab view writes: most intuitive online - can have as clear a page as you want. Unlikely to be comparing the different tabs at the same time, takes few clicks to navigate around. In the following response, criticisms of the tab view are even complemented by suggestions for improvement: “Although it hides some information, and requires excess clicking, the uncluttered, tabular interface helps focus your attention on the details you are looking
15 X2(3) = 49.28, p < .00.
Questions of design —
201
for. If this were paired with a customizable search that brought you to the tab corresponding most to what youre searching for (e.g. "dog" sense relations > sense relations tab for entry "dog"), this would be fantastic.“ In addition, comparisons between the different views are drawn which show that many basic characteristics were also evident in the questionnaire Situation: “That all the relevant information is on one page, immediately visible without further clicking. The two-dimensional arrangement without any visible boxes is somewhat irritating and the categorization of the examples is missing, which is a pity. The tree structure was OK, but having to explicitly open not only the first, but also the second level was a bit much. The article in print dictionary style would have been fine, too, if line breaks and paragraphs were inserted, the abbreviations spelled out, and all information from, for example, the tabbed Ver sion available. In this tabbed Version you always have to click back and forth, and are never able to see the data side by side.” It could be objected that this high rating of the tab view could be the result of a so cial desirability bias. It is commonly known that respondents tend to present themselves in a favourable light (Diekmann, 2002, pp. 382-386). Since our project is closely related to elexiko and this online dictionary uses the tab structure, respond ents might have claimed to prefer the tab view, because they assumed that we would be impressed by this decision. However, this objection does not hold, be cause of the following two points: as mentioned above, there is no significant rela tionship between the language Version of the survey and the preference distribu tion. Due to the fact that elexiko is a German monolingual online dictionary, it is rather unlikely that respondents in the English-language Version from all over the world would prefer the tab view as a result of a social desirability effect, because additionally we know from our third survey (German-language Version only) that elexiko is only known by 21.46% of German-speaking respondents (cf. Klosa et al., section 2.4, this volume). The analysis of the open-ended question shows very clearly the reasons for the preferences. Surprisingly, adaptivity is a very frequently cited criterion. This came as a surprise because this criterion was evaluated as very unimportant as a characteristic of good online dictionaries. One possible explanation, we assume, is the fact that respondents are not used to online dictionaries incorporating those features. Thus, participants currently have no basis on which to judge their potential usefulness. We confirmed this assumption in an experiment incorporated into our second survey. (cf. Müller-Spitzer/Koplenig: Expectations and demands, section 2 and 4, this volume). It was shown in the experiment that respondents who were first pre sented with examples of possible innovative features of online dictionaries judged adaptability and multimedia to be more useful than participants who did not have this information. A similar phenomenon may also be observed here: as soon as sub-
202 —
Alexander Koplenig, Carolin Müller-Spitzer
jects see the different ways in which entries can be presented, they see the possibility of an adaptive adjustment as an advantage. It is less surprising that the criterion of clarity is often found to be important. This coincides with the general results on the characteristics of good online diction aries from our first study. However, the ränge of what is considered to be clear is very wide. What participants write on that topic can by no means be regarded as an argument for monofunctional dictionaries, as proposed for example by Bergenholtz and Bergenholtz (2011; Bergenholtz &Bothma, 2011, pp. 54-57; Bergenholtz, 2011, p. 53), since one aspect of clarity is that the presentation should not be overloaded, but also that it should be possible to see a variety of data at a glance: - I like to see everything at once, but I like it separated into categories. - It has everything clearly presented. I dont have to keep clicking on more options to find out more info. It’s all right there. Also, it appears in the context of a user-adaptive interface that any kind of profilechoosing is regarded as particularly problematic. As an example: please do not make the user have to select a whole bunch of things before getting to the dictionary entry. This would be a fatal choice and make the diction ary annoying and difficult to use. People would choose to use a dictionary, which is qualitativ worse but easier to use over the one where you have to fill in a whole bunch of baloney before you use it! People want answers fast! And then they want to play around with them. We are not all scientists who search for in formation systematically. This is also a counterpoint argument against the theoretically convincing idea of a decision tree which provides only the information someone needs in a particular usage Situation (Bothma et al., 2011, pp. 308-309). All these ideas reward the user at the end with a (in the best case) perfectly matching dictionary entry, but it is a long way to go. One has to wonder whether users are willing to jump this hurdle, though a necessary login keeps some users from using a dictionary (cf. Bank, 2012, pp. 356 57).
5 Conclusion The empirical data on questions of design presented here provide projects that use the above or similar forms of presentation for their lexicographic data with valuable information about how potential dictionary users assess and evaluate them. In addi tion, the answers to the open-ended question show, detached from concrete design models, which criteria potential users particularly value in a good online represen tation. Clarity and an uncluttered look seem to dominate in many answers as well as
Questions of design —
203
the possibility of customization, if the latter is not connected with a too complex usability model. One important, recurring issue is the intuitive usability of an online dictionary. This also applies to other areas, as an interview with Rüdiger Grube, CEO of Deutsche Bahn AG, shows. When asked about predictions for the future of travei behaviour, he answers: ‘If there is something about the mobility behaviour of the Germans that will certainly not change, then it is the fact that everything has to be as easy and com fortable as possible. Traveloffers that only a scholar can understand do not have a future.’ 16
As one participant in our survey puts it: ‘If I need an introduction, then the layout is a flop.’17
Bibliography Bank, C. (2010). Die Usability von Online-Wörterbüchern und elektronischen Sprachportalen. Uni versität Hildesheim, Hildesheim. Bank, C. (2012). Die Usability von Online-Wörterbüchern und elektronischen Sprachportalen, 63(6), 345-360. Bergenholtz, H. (2011). Access to and Presentation of Needs-Adapted Data in Monofunctional Inter net Dictionaries. In H. Bergenholtz & Fuertes-Olivera (Eds.), (pp. 30-53). London/New York: Continuum. Bergenholtz, H., & Bergenholtz, I. (2011). A Dictionary Is a Tool, a Good Dictionary Is a Monofunctional Tool. In H. Bergenholtz & P. A. Fuertes-Olivera (Eds.), e-Lexicography. The In ternet, Digital Initiatives and Lexicography(pp. 187-207). London/New York: Continuum. Bergenholtz, H., 8i Bothma, T. J. D. (2011). Needs-adapted data presentation in e-information tools, 21, 53-77. Bothma, T. J. D., Faaß, G., Heid, U., 8i Prinsloo, D. J. (2011). Interactive, dynamic electronic dictionar ies fortext production. In I. Kosem 8i K. Kosem (Eds.), Electronic lexicography in the 21st Centu ry: New Applications for New Users. Proceedings ofeLex20U, Bled, Slowenien, 10 - 12 Novem ber 2011 (pp. 215-220). Ljubljana: Trojina, Institute for Applied Slovene Studies. Retrieved from http://www.trojina.si/elex2011/Vsebine/proceedings/eLex2011-29.pdf (last accessed 13 july 2013) Bowker, L. (2012). Meeting the needs of translators in the age of e-lexicography: Exploringthe possibilities. In S. Granger8iM. Paquot (Eds.), Electronic lexicography (pp. 379-397). Oxford: Oxford University Press. Diekmann, A. (2002). Empirische Sozialforschung: Grundlagen, Methoden, Anwendungen (8th ed.). Reinbek: Rowohlt Taschenbuch Verlag.
16 “Was sich am Mobilitätsverhalten der Deutschen mit Sicherheit nicht ändern wird, ist, dass alles einfach sein muss und m öglichst bequem. M obilitätsangebote, für die man ein Gelehrter sein muss, um sie zu verstehen, haben keine Zukunft.” (Interview mit Peter Ramsauer und Rüdiger Grube, DB mobil 9/2012: 45)
17 “W enn ich eine Einführung brauche, hat das Layout versagt.”
204 —
Alexander Koplenig, Carolin Müller-Spitzer
Diekmann, A. (2010). Empirische Sozialforschung. Grundlagen, Methoden, Anwendungen (4th ed.). Hamburg: Rowohlt. Dziemanko, A. (2012). On the use(fulness) of paper and electronic dictionaries. In Electronic lexicog raphy (pp. 320-341). Oxford: Oxford University Press. Lew, R. (2010). Users Take Shortcuts: Navigating Dictionary Entries. In A. Dykstra & T. Schoonheim (Eds.), Proceedings of the XIV Euralex International Congress (pp. 1121-1132). Ljouwert: Afuk. Lew, R. (2012). How can we make electronic dictionaries more effective? In S. Granger & M. Paquot (Eds.), Electronic lexicography (pp. 343-361). Oxford: Oxford University Press. Lew, R., &Tokarek, P. (2010). Entry menus in bilingual electronic dictionaries. eLexicography in the 21st Century: New challenges, new applications. Louvain-la-Neuve: Cahiers du CENTAL, 145 146. Mayring, P. (2011). Qualitative Inhaltsanalyse. Grundlagen und Techniken (8th ed.). Weinheim: Beltz. Nesi, H., 8i Tan, K. H. (2011). The Effect Of Menus And Sign posting On The Speed And Accuracy Of Sense Selection. International Journal of Lexicography, 24(1), 79. Tarp, S. (2011). Lexicographical and Other e-Tools for Consultation Purposes: Towards the Individualization of Needs Satisfaction. In H. Bergenholtz 8i P. A. Fuertes-Olivera (Eds.), eLexicography. The Internet, Digital Initiatives and Lexicography (pp. 54-70). London/New York: Continuum. Tono, Y. (2000). On the Effects of Different Types of Electronic Dictionary Interfaces on L 2 Learners’ Reference Behaviour in Productive/Receptive Tasks. In U. Heid, S. Evert, E. Lehmann, 8i C. Rohrer (Eds.), Proceedings ofthe Ninth EURALEX International Congress, Stuttgart, Germany, Au gust 8th-12th (pp. 855-861). Stuttgart: Universität Stuttgart, Institut für Maschinelle Sprachverarbeitung. Tono, Y. (2011). Application of Eye-Tracking in EFL Learners. Dictionary Look-up Process Research. International Journal of Lexicography, 23. Trap-Jensen, L., 8i Lorentzen, H. (2011). There And Back Again - from Dictionary to Wordnet to The saurus and Vice Versa: Howto Use and Reuse Dictionary Data in a Conceptual Dictionary. In I. Kosem 8i K. Kosem (Eds.), In: Electronic lexicography in the 21st Century: New Applications for New Users. Proceedings ofeLex2011, Bled, Slowenien, 10 -1 2 November2011 (pp. 175-179). Presented at the eLex 2011, Ljubljana.