Queueing Network-based Optimisation Techniques for Workload Allocation in Clusters of Computers*
Ligang He, Stephen A. Jarvis, David Bacigalupo, Daniel P. Spooner, Xinuo Chen and Graham R. Nudd Department of Computer Science, University of Warwick Coventry, CV4 7AL, United Kingdom
[email protected]
Abstract This paper addresses workload allocation techniques for clusters of computers. The workload in question is homogenous or heterogeneous. Homogeneous workload contains only QoS-demanding jobs (QDJ) or non-QoS jobs (NQJ) while heterogeneous workload is a mix of QDJs and NQJs. The processing platform used is a single cluster or multiple clusters of computers. Two workload allocation strategies (called ORT and OMR) are developed for homogeneous workloads by establishing and numerically solving optimisation equation sets. The ORT strategy achieves the Optimised mean Response Time for homogeneous NQJ workload; while the OMR strategy achieves the Optimised mean Miss Rate for homogeneous QDJ workload. Based on ORT and OMR, a heterogeneous workload allocation strategy is developed to dynamically partition the clusters into two parts. Each part is managed by ORT or OMR to exclusively process NQJs or QDJs. The judicial partitioning achieves an optimised comprehensive performance, which combines the mean response time and the mean miss rate. The effectiveness of these workload allocation techniques is demonstrated through queueing-theoretical analysis as well as through experimental studies. These techniques can be applied to e-business workload management to improve the distribution of different types of requests in clusters of servers.
1. Introduction Clusters are now popular computing platforms for business and scientific applications [9]. Multicluster processing platforms are also gaining in popularity. The
* This work is sponsored in part by grants from the NASA AMES Research Center (administrated by USARDSG, contract no. N68171-01-C9012), the EPSRC (contract no. GR/R47424/01) and the EPSRC eScience Core Programme (contract no. GR/S03058/01).
reason for this is two-fold: firstly, there is an everincreasing need for collaboration in and between enterprises, which has lead to the integration of separate clusters with different performance and architectures. A number of commercial multicluster products are also available, such as Platform LSF MultiCluster [20]. Secondly, in some scenarios a cluster needs to be partitioned into two or more subclusters to support resource maintenance or data integrity [5]. In this case, the subclusters have identical configuration and deployed applications, so the incoming workload (e.g. HTTP requests) can be forwarded to any subcluster. The workload allocation strategy, which determines the proportion of workload directed to each resource (a machine or a cluster of machines), is a key factor in achieving desirable performance in multiclusters. The metric for evaluating performance varies according to the job type. When the jobs have QoS demands (termed QoSdemanding jobs or QDJs for short), the performance metric is usually used to measure the extent of QoS compliance. Slack is a common QoS metric [16]. The QoS of a job is satisfied if the job' waiting time in the system is less than its slack [13]; otherwise, the QoS is missed. Miss rate is a performance metric to measure the proportion of jobs whose QoS demands are missed. When jobs have no QoS demands (called non-QoS jobs or NQJs for short), a common performance goal is to reduce their mean response time [19]. It is common in e-business environments that a system receives different types of jobs (requests). Homogeneous workloads contain only one type of job, while heterogeneous workloads are mixed in their job composition [17]. In this paper, optimisation techniques are addressed for both QDJ and NQJ allocation in multiclusters (where a single cluster is a special case of a multicluster). The QoS demand of a QDJ is based on its slack. Two workload allocation strategies, Optimised mean Response Time (ORT) and Optimised mean Miss Rate (OMR), are developed. The aim of ORT is to achieve the optimised mean re-
sponse time for homogeneous NQJ workload in multiclusters and the aim of OMR is to achieve an optimised mean miss rate for a homogeneous QDJ workload. The ORT and OMR strategies are mathematically modelled combining queueing network theory to establish sets of optimisation equations. Numerical solutions are developed to solve the optimisation equation sets and determine the proportion of the workload for each cluster (or each computer in the case of a single cluster). Based on ORT and OMR, a workload allocation strategy, Optimised Comprehensive Performance (OCP), is developed to deal with heterogeneous workload, which consists of both NQJs and QDJs. The OCP strategy dynamically partitions the multicluster into two parts according to the proportion of NQJs and QDJs in the incoming workload. One part is managed by the ORT strategy to exclusively process NQJs and the other is managed by OMR to process the QDJs. The judicial partitioning achieves an optimised comprehensive performance, which combines the mean response time of NQJs and the mean miss rate of QDJs with predetermined weights. The workload allocation techniques presented in this paper can be applied to e-business workload management, where the workload comprises the requests and the workload allocation corresponds to the request distribution. The requests may or may not have QoS demands. These workload allocation techniques can improve the distribution of the different types of requests across clusters of servers. It is non-trivial to optimise workload allocation in heterogeneous systems. Relevant research has been documented in a number of papers [3][15][19][12]. It is shown in [15] that allocating workload proportional to computing capability does not achieve the best response performance unless the system workload is very high. However, [15] does not quantitatively develop a scheme to optimise the performance. A similar problem is addressed in [3] and an optimisation function is established. However, the solution to the objective function is not given and the optimisation function is limited to a single cluster. A static workload allocation technique is addressed in [19] aiming to optimise mean response times of HTTP requests in a heterogeneous cluster. Both an optimisation function and its solution are given. However, the technique is static and their solution is in fact a special case of this work, where each cluster in the multicluster architecture has only one machine. In this paper, a non-linear optimisation function is established for multiclusters. Although the symbolic solution to the function is unobtainable, a numerical solution is developed by revealing a property of the objective function. Furthermore, all workload allocation techniques discussed in the related research are intended for processing NQJs. This paper addresses optimisation techniques for the allocation of both NQJs and QDJs.
Using clusters to process QDJs is also investigated in [1][10][12][13]. The performance of QDJ scheduling is evaluated in [13] in terms of the miss rate. However, this work is confined to a single homogeneous cluster and it does not consider the optimisation of the mean miss rate through judicial workload allocation. A methodology for maximizing profits in e-commerce environments is presented in [16]. The corresponding QoS criteria are based on multiclass Service-Level-Agreements between service providers and their clients. However, the work is also limited to a single cluster. Our work will deal with the workload allocation in more general processing platforms (i.e. multiclusters). Weighted Random (Rand) or Weighted Round-Robin (RR) policies are two job dispatching strategies often used in commercial systems [17]. In this paper, the proposed ORT and OMR workload allocation strategies are combined with these two job dispatching strategies to generate job scheduling algorithms: ORT-RR, ORT-Rand, OMR-RR and OMR-Rand. Extensive experimental studies are conducted and the results verify that these algorithms significantly outperform scheduling algorithms without these optimisation techniques. The rest of the paper is organized as follows. The system model in this paper is discussed in Section 2. Two optimised workload allocation strategies for homogeneous workloads are presented in Section 3 and the allocation technique for heterogeneous workloads is proposed in Section 4. The performance of these strategies is evaluated in Section 5. Section 6 concludes the paper.
2. System model λ
Global Scheduler
α1λ
αnλ
α2λ …
Waiting queues Local Schedulers
…
…
…
Processing computers
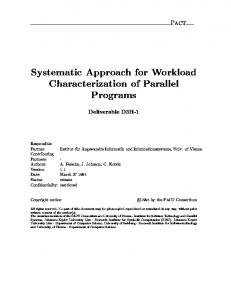
Figure 1. The Multicluster architecture The multicluster system assumed in this paper consists of n clusters where each cluster comprises a set of homogeneous computers, shown in Fig.1. The computers in different clusters may have different performance. Cluster i (1≤i≤n) is modelled using an M/M/mi queue, where mi (mi≥1) is the number of computers in cluster i. When mi is 1, the multicluster is degraded to a single cluster. The multicluster has two levels of scheduler, a global scheduler and multiple local schedulers. The global scheduler has no waiting queue and therefore incoming jobs are immediately forwarded to individual clusters. The local
scheduler at each cluster adopts a centralized queueing architecture. A waiting queue is used by each local scheduler to accommodate the jobs received from the global scheduler. There are no waiting queues at each of the processing computers. Each local scheduler schedules the jobs using a First-Come-First-Served policy and sends the jobs to free processing computers for execution. It is assumed that the time is negligible for transferring the jobs from the global scheduler to the local schedulers as well as from the local scheduler to the processing computers. For the QDJ workload, each job has a slack following a uniform distribution in [sl, su].
Wi =
W 0i 1 − ρi
The formula for W0i is given by Eq.4 [6], where Pmi is the probability that the system has no less than mi jobs. Pmi (4) W 0i = miui
Supposing the fraction of the workload allocated to cluster i is αi, then, αiλ (5) ρi = mi u i Pmi in Eq.4 is given by Eq.6 [6][14]. (6) ( m iρ i ) m P mi =
3. Allocation of homogeneous workloads When a job stream (workload) of an average arrival rate λ is presented to the global scheduler, as shown in Fig.1, it is decomposed by applying a workload allocation strategy and as a result a fraction αi of all jobs are allocated to cluster i. The objective of workload allocation is to determine {α1, α2…,αn}.
3.1 Optimised mean response time (ORT) For the NQJ stream, the workload allocation strategy aims to optimise the mean response time of the job stream in the multicluster. The response time of a job is defined as the time from when the job arrives at the system until it is completed. The traditional workload allocation strategy takes into account the heterogeneity of the clusters performance, so that the workload fraction αi allocated to cluster i (1≤i≤n) is proportional to its processing capability, miui. Hence, αi is computed as miui (1) αi =
∑
n i =1
miui
This strategy is called weighted workload allocation. A detailed analysis is given below in order to develop a workload allocation scheme for optimising the mean response time. The response time of a job is its waiting time in the queue plus its execution time. Hence, the mean response time of the jobs in cluster i, denoted as Ri, can be computed by Eq.2, where Wi is the mean waiting time of the jobs in cluster i and ui is the mean service rate of each computer in cluster i. 1 (2) Ri = Wi + ui
Cluster i of mi computers is modelled using an M/M/mi queue (1≤i≤n). According to queueing theory [14], the mean waiting time of jobs, Wi , is computed by Eq.3, where ρi is the utilization of cluster i and W0i is the mean remaining execution time of the job in service when a new job arrives.
(3)
i
⎡ ( m iρ i ) ( m iρ i ) k ⎤ + (1 − ρ i ) m i! ⎢ ∑ ⎥ k! (1 − ρ i ) m ! ⎦ ⎣ k =0 m i −1
k
With Eq.2-Eq.6, we get the formula for Ri in terms of the variable αi, shown in Eq.7. miui ( αuiλi ) mi (7) 1 + Ri = α α iλ mi iλ k ui ⎡ mi −1 ( ui ) ( ) ⎤ + ui αiλ ⎥ (miui − αiλ ) 2 ⎢mi! ∑ (1 − miui ) ⎦⎥ ⎣⎢ k =0 k! Thus, the mean response time of the incoming job stream over these n clusters, denoted by R, can be computed by Eq.8. n (8) R = ∑i =1 Riαi Hence, in order to achieve the optimal mean response time of the job stream in the multicluster, the objective is to find a workload allocation {α1, α2…,αn} that minimizes Eq.8 subject to
n
∑ α = 1 and 0≤αi< mλu
i i
i
(the con-
i =1
straint αi< miui is used to ensure that cluster i is not satuλ
rated). This is a constrained-minimum problem and according to the Lagrange multiplier theorem, solving this problem is equivalent to solving the following equation set. miui ⎧ n αi = 1, 0 ≤ αi ≤ (a) ⎪⎪∑i=1 λ ⎨ ⎪ ∂ (∑n Riαi) − v ∂ (∑n αi −1) = 0 1 ≤ k ≤ n (b) ∂αk i=1 ⎩⎪∂αk i=1
(9)
Eq.9 can be reduced to Eq.10 by solving the partial differential equations in Eq.9.b. miui ⎧ n ⎪⎪∑i =1αi = 1, 0 ≤ α i ≤ λ ⎨ ⎪ ∂ (Rkαk ) = v 1 ≤ k ≤ n ⎩⎪∂αk
(a)
(10)
(b)
It is impossible to find the general symbolic solution {α1, α2…,αn} from Eq.10 due to the complicated expression of Ri. However, a property of Eq.10.b is revealed (below) that enables us to develop a numerical solution for Eq.10. The right side of Eq.10.b can be transformed into Eq.11.
∂Rk ∂ (Rkαk ) = αk + Rk ∂αk ∂αk
(11)
As in queueing theory [6][14], both the mean response time of jobs (Rk) and its slope ( ∂Rk ) monotonically in∂αk
crease as αk increases. ∂ (Rkαk) is then a monotonically ∂αk increasing function of αk. With this property, we develop a numerical solution to solve Eq.10 and therefore derive the optimised workload allocation {α1, α2…,αn} shown in Algorithm 1. Algorithm 1. Computation of workload allocation among clusters for optimised mean response time 1. Let lower and upper limits of the mean response time be v_lower and v_upper; 2. while (v_lower≤v_upper) 3. v_mid=( v_lower+ v_upper)/2; 4. for each cluster i (1≤i≤n) do 5. if (v_mid< ∂ (Riαi) | ) ∂αi
6. 7. 8. 9. 10. 11. 12.
α i =0
αi=0; else if (v_mid> miui ) λ v_upper=v_mid; continue; while (α_lower≤α_upper) α_mid=(α_lower+α_upper)/2; v_cur= ∂ (Riαi) | ; α =α _ mid ∂αi if (the difference between v_cur and v_mid is less than v_valve) αi=α_mid; if (v_cur is less than v_mid) α_lower=α_mid; else α_upper=a_mid; end for α_sum= n α ; i
13. 14. 15. 16. 17. 18. 19. 20.
∑ i =1
21. 22. 23. 24. 25. 26. 27.
i
if (the difference between α_sum and 1 is less than α_valve) the current set of αi (1≤i≤n) is the correct workload allocation; else if (α_sum is less than1) v_lower= v_mid; else v_upper= v_mid; end while
Since the binary search technique is used to search for v and αi in their respective search spaces [v_lower, v_upper] and [α_lower, α_upper], the time complexity of Algorithm 1 is O(n logkv logkα ) , where n is the number of clusters in the multicluster system, kα and kv are the num-
ber of elements in the search spaces of v and αi, which equal v _ upper − v _ lower and α _ upper − α _ lower , reϕ γ spectively (ϕ and γ are the precision in the calculation). Since ϕ and γ are predefined constants, the time complexity is linear with the number of the clusters, n. The feasibility and effectiveness of Algorithm 1 are shown in Theorem 1. Its proof is omitted in this paper. Theorem 1. The workload allocation strategy {α1, α2…,αn} computed by Algorithm 1 minimizes the mean response time of the incoming job stream in a multicluster of n clusters.
3.2 Optimised mean miss rate (OMR) A QDJ is considered as missing its QoS demand if its waiting time in the waiting queue is greater than its slack. The performance criterion for evaluating QDJ scheduling differs from that for NQJ scheduling in that it typically aims to minimize the fraction of jobs that miss their QoS requirements, termed the miss rate. In this subsection, a workload allocation technique, called OMR, is developed to optimise the mean miss rate of the incoming QDJ stream in a multicluster. Every QDJ has some slack, following a uniform distribution. Its probability density function S(x) is given in Eq.12, where su and sl are the upper and lower limits of the slack, respectively. 1 (12) S ( x) = su − sl
We continue to model cluster i (of mi computers) as an M/M/mi queue (1≤i≤n). As in queueing theory [14], in an M/M/mi queue, the probability distribution function of the job waiting time, Pw(x) (which represents that the probability that the job waiting time is less than x), is given by Eq.13 [14], where ρi and Pmi are the same variables as those in Eq.3 and Eq.4. (13) Pw( x) = 1 − Pmie − miui (1− ρi ) x With the probability density function of slacks, S(x), the miss rate of the QDJs allocated to cluster i, denoted by MRi, can be computed by Eq.14. su MRi= S ( x)(1 − Pw( x))dx (14)
∫
sl
Applying Eq.12 and Eq.13 and solving the integral, Eq.14 becomes Eq.15, where the workload fraction αi for cluster i is the only unknown variable. (15) αiλ m −( m u −α λ ) s −( m u −α λ ) s MRi =
miui (
ui
) i [e
i i
i
l
−e
i i
i
u
]
αiλ k αiλ ⎤ ⎡ ( )k ⎥ ⎢ mi −1 ( ui ) + ui (miui − αiλ ) 2 (su − sl ) ⎢mi! ∑ αiλ ⎥⎥ ⎢ k =0 k! (1 − ) miui ⎦⎥ ⎣⎢
The mean miss rate of the incoming QDJ stream over these n clusters, denoted by MR, can be computed by Eq.16.
MR = ∑i =1 MRi × αi n
(16)
Similarly to the case of minimizing the mean response time, this is a constrained-minimum problem. We need to find a workload allocation that minimizes MR subject to ∑ n αi = 1 and 0≤αi≤ miui , which is equivalent to solvi =1 λ ing the following equation set. miui ⎧ n (a) ⎪⎪∑i =1αi = 1, 0 ≤ α i ≤ λ ⎨ ⎪ ∂ ( MRk × αk ) = v 1 ≤ k ≤ n (b) ⎪⎩ ∂αk
(17)
Theorem 2 is introduced to identify that ∂ ( MRk × αk ) ∂αk in Eq.17 also monotonically increases over αk. The proof of the theorem is omitted for brevity. With this property, a numerical solution is also developed to solve Eq.17. The solving algorithm is similar to Algorithm 1 and the proof of the algorithm is similar to Theorem 1. Theorem 2 ∂ ( MRk × αk ) monotonically increases over αk. ∂αk
∑m u i
i
) is the least among all possible sets of clusters
whose total computing power is greater than λ1 (the condition of greater than λ1 is to guarantee the set of clusters is not saturated). Csoft is denoted as a set of clusters, whose computing power is the least among all possible sets of clusters whose computing power is greater than λ2. Rmax is denoted as the mean response time of NQJs processed by the clusters in Cnon. MRmax is denoted as the mean miss rate of QDJs, processed by the clusters in Csoft. Suppose the clusters in the multicluster are partitioned into two sets, SN and SS (SN ∩SS=∅). R is the mean response time of NQJs processed by the clusters in SN and MR is the mean miss rate of QDJs, processed by the clusters in SS. R and MR can be computed using the ORT and OMR strategy. Two normalized functions for the mean response time and the mean miss rate are combined with weights to represent the comprehensive performance of the scheduling [11]. This is shown in Eq.18, where wN and wS are the weights of NQJs and QDJs. R − Rmin MR − MRmin (18) CP = w +w N
4. Allocation of heterogeneous workloads Based on the ORT and OMR strategy, a workload allocation technique, called OCP (Optimised Comprehensive Performance), is developed to deal with heterogeneous workloads consisting of both NQJs and QDJs. The comprehensive performance is defined as the weighted sum of the normalized functions for the mean response time and the mean miss rate [11]. The OCP strategy partitions the multicluster into two parts according to the proportions of NQJs and QDJs in the heterogeneous workload, as well as the performance requirements for the mean response time and the mean miss rate. Each part is managed by the ORT or OMR strategy to exclusively process NQJs or QDJs. A characteristic of the OCP strategy is that it adjusts the partition of the multicluster dynamically based on the current partition, rather than completely re-calculating the partition. The strategy can achieve the sub-optimal partition of the multicluster at low cost.
4.1 Comprehensive performance metric Suppose in a heterogeneous job stream the average arrival rate of NQJs and QDJs are λ1 and λ2, respectively. Some additional notation is introduced for brevity. Rmin is denoted as the mean response time of NQJs processed by all the clusters in the multicluster. MRmin is denoted as the mean miss rate of QDJs processed by all clusters in the multicluster. Cnon is denoted as a set of component clusters in the multicluster, whose total computing power (measured by
Rmax − Rmin
S
MRmax − MRmin
In this paper, it is assumed that these two metrics, the mean response time and the mean miss rate, are of the same importance. Hence wN and wS are assigned to be the proportions of NQJs and QDJs in the heterogeneous job stream, which are shown in Eq.19 and Eq.20. If the system has different requirements for these two metrics, the weights can be determined accordingly. λ1 (19) wN = λ1 + λ2 λ2 (20) wS = λ1 + λ2
4.2 Partition of the multicluster The lower the value of CP, the better the comprehensive performance. The objective of the Optimised Comprehensive performance (OCP) strategy is to dynamically adjust the multicluster partition according to the changes of λ1 and λ2 so as to gain high performance in terms of CP. Suppose that the sets of the clusters for processing NQJs and QDJs are denoted by SN and SS, respectively. When λ1 and λ2 change, we attempt to adjust the allocation of computing power for processing NQJs and QDJs based on the current partition of the multicluster. The process consists of two steps: 1) Determine the shifting direction of computing power, i.e., determine if shifting computing power from SN to SS or from SS to SN; 2) Determine the quantity of computing power shifted from one set to the other.
There exist 9 relations in terms of the change of λ1 and λ2, which are listed in Table 1. For relation 2, 7 and 8, the computing power should be shifted from SN to SS; while the shifting direction of computing power should be the opposite for relation 3, 4 and 6. For relation 1, the allocation of computing power should remain unchanged. If both λ1 and λ2 decrease or increase (this is the case for relation 5 or 9), the shifting direction of computing power is determined by Algorithm 2. Table 1. The changes of λ1 and λ2 (↓ stands for decrease, ↑ for increase and - for unchanged) 1 2 3 4 5 6 7 8 9 λ1 ↓ ↑ ↓ ↑ ↓ ↑ λ2 ↓ ↓ ↓ ↑ ↑ ↑ Algorithm 2. Determine the shifting direction when both λ1 and λ2 decrease or increase 1. if moving the cluster with the least computing power in SN to SS results in better CP performance 2. The shifting direction is from SN to SS; 3. else if moving the cluster with the least computing power in SS to SN leads to better CP performance 4. The shifting direction is from SS to SN; 5. else 6. The current partition remains unchanged;
6. if moving these clusters {nN, nN-1,…, nN-i, j} to SS leads to better CP performance, 7. Move these clusters to SS and then the new multicluster partition is determined; 8. else 9. Some subset of the clusters in SN needs to be moved to SS, which is an element in such a sequence of clusters with the following form, 1, 2,…, nN, {nN, 1}, {nN, 2},…, {nN, nN-1}, {nN, nN-1, 1}, {nN,nN-1, 2},…, {nN, nN-1,…, nN-i, j} where the sum of the computing power of clusters in each element are in increasing order; 10. Use a binary searching technique to search for such an element, ei, in the sequence that moving the clusters in ei to SS results in a better CP performance while moving the clusters in ei+1 to SS leads to poorer performance; 11. Move the clusters in ei to SS to get the new partition for the multicluster; In the worst case, the time complexity of Steps 2-4 is O(n), so as is Step 5. In the worst case, the number of the elements in the constructed sequence is (n + 1)n and the 2
time complexity of Step 10 is therefore O(log( (n + 1)n )) . 2
Without loss of generality, suppose the direction is from SS to SN. The number of computers in the sets SN and SS are assumed to be nN and nS (nN+nS=n), respectively. The process of determining the quantity of computing power shifted from SS to SN is outlined in Algorithm 3. Algorithm 3 proceeds in two major steps. First, it shifts computing power from SS to SN (Steps 2-4) until the operation does not improve the CP performance; and then, it searches SN for the clusters to move back to SS. By doing so, a proper multicluster partition is maintained to achieve a high performance in terms of CP. Algorithm 3 Determine the quantity of computing power shifted from SS to SN 1. Order the clusters in SN (SS) in increasing computing power, respectively, and label the i-th cluster in SN (SS) as i; 2. do 3. Move the cluster Ci of the least computing power in SS to SN; 4. while the resulting multicluster partition results in the better CP performance than that of the previous partition; 5. Get such clusters in SN where the sum of their computing power is less than that of Ci (calculated by Steps 24), and where replacing any of them with a cluster of the greater computing power will cause the sum to be greater than that of Ci; Suppose these clusters are nN, nN-1,…, nN-i and j;
Hence, the time complexity of Algorithm 3 is (n + 1)n O (log( ) + 2n) in the worst case. It can be seen that 2
the worst-case time complexity of Algorithm 2 is O(1). Hence, the time complexity of the OCP strategy for adjusting a multicluster partition is O(log( (n + 1)n ) + 2n) . 2
A case study is given to illustrate Algorithm 3. Suppose the current partition is as follows, where a number in brackets stands for the computing power of a cluster. The shifting direction is from SS to SN. SN={1, 2, 3, 4}, SS={5, 6, 7, 8} Suppose moving the first cluster in SS, whose computing power is 5, to SN leads to a better CP performance and that moving the second cluster, whose computing power is 6, results in a worse performance. The current multicluster partition becomes SN={1, 2, 3, 4, 5, 6}, SS={7, 8} The clusters calculated by Step 5 in Algorithm 3 are {4, 1}. Replacing any of these two clusters with one that has the greater computing power will cause the sum to be greater than that of Ci (Step 5). A sequence of clusters is constructed as follows: 1, 2, 3, 4, {4, 1} Finally, the binary search is employed to get such an element ei in the above sequence so as to satisfy the condition in Step 10. The corresponding computing power is moved back to SS.
Workload allocation schemes
ORT OMR Weighted ORT- OMRJob dis- Random W-Rand Rand Rand patching strategies Round- ORT- OMRW-RR Robin RR RR Three workload allocation strategies (ORT, OMR and weighted allocation (see Eq.1)) are tested for homogeneous workloads in the experiments to demonstrate the advantage of ORT and OMR over the weighted allocation. These workload allocation schemes are combined with two job dispatching strategies (weighted Random and weighted Round-Robin). Six scheduling algorithms are evaluated, each of which is the combination of a workload allocation scheme and a job dispatching strategy. These six algorithms (ORT-Rand, ORT-RR, OMR-Rand, OMR-RR, W-Rand and W-RR) are listed in Table 2. In the weighed Random dispatching, the cluster is randomly selected while in the weighted Round-Robin, the cluster is selected in a round-robin manner by the global scheduler. Both strategies ensure that the probability that a job
5.1 Effect of workload Table 3 System setting in Figure 2 Cluster 1 3 20
mi ui Mean response time
An experimental simulator is developed to evaluate the performance of the proposed workload allocation techniques under a wide range of system settings and workload levels. The simulator consists of a collection of clusters. In every cluster a central computer acts as the local scheduler and the local schedulers in all clusters are connected to a central computer in the multicluster. The central computer acts as the global scheduler, which receives all incoming jobs and schedules them onto the clusters. Two types of homogeneous workloads (NQJs and QDJs) are generated using the same parameters except that every QDJ has one additional metric, the slack, following a uniform distribution. Heterogeneous workloads are generated by merging two homogeneous NQJ and QDJ workloads with the respective mean arrival rate. The proportion of NQJs (or QDJs) is computed by the total mean arrival rate divided by the arrival rate of NQJs (or QDJs). Each type of workload includes 500,000 jobs. The run of the first 100,000 jobs is considered as the initiation period, allowing the system to achieve a steady state, and the run of the last 100,000 jobs is considered as the ending period. Statistical data are collected from the middle 300,000 jobs. The job arrival follows a Poisson process and the job size follows an exponential distribution. The mean job size is set to be the inverse of the average of the speeds of all processing computers, multiplied by the average number of computers in each cluster. Based on the mean job size, the job arrival rate at which the system becomes saturated can be computed. The workload is measured by the percentage of the saturated arrival rate. Table 2 Combinations of the workload allocation and job dispatching strategies
is sent to cluster i is αi. The OCP strategy is compared with the enumeration approach to verify its effectiveness in the dynamic partitioning of the multicluster. The performance metrics evaluated in the experiments are the mean response time, the mean miss rate and the comprehensive performance, CP. In order to gain an insight into the difference in the allocation behaviours between the OMR and the ORT strategies, ORT is also used to allocate the QDJ stream.
Cluster 2 5 16
Cluster 3 7 12
Cluster 4 9 8
ORT-RR ORT-Rand OMR-RR OMR-Rand W-RR W-Rand
160 150 140 130 120 110 100 90 80 70 60 50 0.1
0.2
0.3
0.4
0.5 0.6
0.7 0.8 0.9 workload
(a) Mean miss rate
5. Experimental Studies
100 90 80 70 60 50 40 30 20 10 0
ORT-RR ORT-Rand OMR-RR OMR-Rand W-RR W-Rand
0.1 0.2 0.3 0.4 0.5 0.6 0.7 0.8 0.9 workload
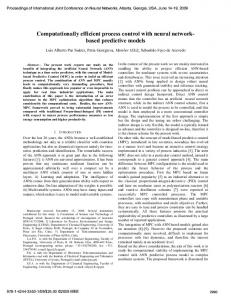
(b) Figure 2. Impact of workload on a) mean response time and b) mean miss rate Fig.2.a and Fig.2.b show the impact of the workload level on the mean response time and the mean miss rate of the incoming homogeneous workloads under these six scheduling algorithms. The multicluster in this experiment consists of 4 clusters whose settings are listed in Table 3. The job slacks for the QDJ stream follow a uniform distribution in the range [0, 30]. It is observed from Fig.2.a that the ORT-RR algorithm performs significantly better than W-RR and OMR-RR,
5.2 Effect of computer speed Fig.3 demonstrates the impact of the difference of computer speed on the performance of homogeneous job streams. Here the multicluster system consists of 4 clusters and the number of computers in each cluster is set to be 4. The speed of the computers in cluster 1 varies from 21 to 6 with a decrement of 3, while the speed of all the computers in the other three clusters increases from 1 to 6 with an increment of 1. Thus, the multicluster system ranges from a highly heterogeneous system to a homogeneous system, while the average speed of all computers remains constant (i.e., 6). The slack of the QDJs follows a uniform distribution in [0, 10]. Fig.3.a shows the impact of the difference of the computer speeds on the mean response time. It can be observed from Fig.3.a that as the speed difference increases, the mean response time decreases significantly under the ORT allocation strategy (the maximum decline is 68%); while it remains approximately the same under the weighted allocation strategy. This is because as the speed difference increases, a higher proportion of the workload is sent to cluster 1 under the ORT strategy (higher than n m1u1 / ∑ miui ), while the weighted allocation strategy i =1
does not make full use of the computing power of cluster 1. This suggests that under the ORT strategy, the speed
Mean response time
difference among the clusters is a critical factor for the mean response time. 200 180 160 140 120 100 80 60 40 20 0
ORT-RR ORT-Rand OMR-RR OMR-Rand W-RR W-Rand
[21, 1] [18, 2] [15, 3] [12, 4] [9, 5] [6, 6] speed difference
(a) Mean miss rate
while ORT-Rand outperforms W-Rand and OMR-Rand. This suggests that ORT performs much better than other strategies in terms of the mean response time. Furthermore, the performance difference increases as the workload decreases. For example, ORT-RR outperforms WRR by 47.4% when the workload is 0.1, while the difference is 13.3% when the workload is 0.9. This trend can be explained as follows: The weighted allocation strategy allocates the same fraction of workload to a cluster even if the workload varies. However, the waiting time accounts for a lower proportion of the response time as the workload decreases. Hence, in order to reduce the response time, a higher proportion of the incoming workload should be allocated to the cluster with the greater ui. ORT is able to satisfy this allocation requirement. Fig.2.b shows the impact of the incoming workload on the mean miss rate. It can be observed that the OMR-RR and OMR-Rand strategies outperform other scheduling algorithms under all workload levels. This suggests that the OMR strategy performs better than the weighted allocation strategy in terms of the mean miss rate. It can be observed from both figures that under the same workload allocation strategies, the algorithms employing weighted Round-Robin dispatching outperform those using Weighted Random. This is because RoundRobin dispatching can reduce the burstiness of the job arrivals in a cluster compared with random dispatching.
28 24 20 16
ORT -RR ORT -Rand OMR-RR OMR-Rand W-RR W-Rand
12 8 4 0 [21, 1] [18, 2] [15, 3] [12, 4] [9, 5] [6, 6] speed difference
(b) Figure 3. The impact of speed difference on a) the mean response time and b) the mean miss rate; the arrival rate is 50% The first observation from Fig.3.b is that OMR performs better than the other strategies in all speed combinations. A further observation is that under the OMR, the mean miss rate remains approximately the same as the speed difference varies. The results for the other levels of workload show similar patterns. This suggests that under OMR, the speed difference among the clusters is not an important parameter for the mean miss rate. This differs from the characteristic of ORT for the mean response time. This divergence may originate from the difference between the expressions of the response time and the miss rate (see Eq.7 and Eq.15) where we see 1/ui in Eq.7 but not in Eq.15. Another interesting result from Fig.3.b is that under the ORT strategy, the mean miss rate increases as the speed difference decreases from [21, 1] to [15, 3] and then decreases as the speed difference continues decreasing. The reason for this is that as the speed difference varies from [21, 1] to [15, 3], the deviation between the allocation proportions under the OMR and the ORT increases, and in so doing causes the mean miss rate to increase. However, the deviation decreases as the speed difference continues to decrease from [15, 3] to [6, 6].
5.3 Effect of cluster size ORT-RR ORT-Rand OMR-RR OMR-Rand W-RR W-Rand
180 160 140 120 100
[21, 1] [18, 2] [15, 3] [12, 4] [9, 5] [6, 6] difference in cluster size
5.4 The partition of the multicluster
Mean miss rate
(a) 40 36 32 28 24 20 16 12 8 4 0
ORT-RR ORT-Rand OMR-RR OMR-Rand W-RR W-Rand
[21, 1] [18, 2] [15, 3] [12, 4] [9, 5] [6, 6] difference in cluster size
Table 4 System setting in Fig.5 Cluster 1 2 3 4 (mi, ui) (3, 20) (5, 16) (7, 12) (9, 8) Cluster 5 6 7 8 (mi, ui) (12, 9) (10, 10) (8, 12) (14, 6)
CP
Mean response time
200
cline in the mean response time is as much as 68% when the system varies from the speed difference of [21, 1] to a homogeneous system. It suggests that the difference in the computer speed has a more significant impact on the mean response time than the difference in the cluster size. As can be observed from Fig.4.b, the OMR strategy outperforms the other strategies in terms of the mean miss rate. Furthermore, the mean miss rate is improved as the difference in the number of computers decreases. This result differs from the experimental results in Fig.3.b, where the speed difference has no significant impact. This is because the miss rate depends on the probability distribution of the waiting time of jobs, on which the number of computers imposes a greater influence than computer speed.
(NQJ=50%, QDJ=50%) (NQJ=30%, QDJ=70%) (NQJ=70%, QDJ=30%)
0.8 0.7 0.6 0.5 0.4 0.3 0.2 0.1 0
OP
0
(b) Figure 4. The impact of the difference in number of computers in each cluster on a) the mean response time and b) the mean miss rate Fig.4.a and Fig.4.b show the impact of the difference of the cluster size on the mean response time and the mean miss rate. The number of computers in cluster 1 decreases from 21 to 6 with a decrement of 3, while the number of computers in clusters 2-4 increase from 1 to 6 with an increment of 1. The total number of computers in the multicluster system remains constant, i.e., 24. The speed of all computers is set to be 10 and the incoming workload is 50% of the saturated workload. It can be observed from Fig.4.a that the ORT strategy performs better than other workload allocation strategies in terms of the mean response time. A further observation is that the mean response time decreases as the difference in number of computers increases. It suggests once more that the ORT strategy is able to make full use of the clusters with more computing power as the heterogeneity of the multicluster system increases. When the system heterogeneity changes from [6, 6] (homogeneous system) to [21, 1], the mean response time decreases by 24%. According to the experimental results from Fig.3.a, the de-
OP(OP′ )
OP′OP
1
2
3
The ratio of the computing power for processing NQJs to that for QDJs
4
Figure 5. The impact of multicluster partitioning on the comprehensive performance CP; the optimal partition (by enumeration) in each job stream is labeled by OP; the total workload is 80%, the partition by OCP is labeled by OP' Fig.5 compares the partition of the multicluster using the enumeration approach and the OCP strategy. The multicluster consists of 8 clusters, the configuration of which is listed in Table 4. Heterogeneous job streams with different proportions of NQJs and QDJs are investigated. Only the experimental results for three job streams are shown in Fig.5, since the results for job streams of other proportions demonstrate similar results. The multicluster is partitioned into two parts. One part is used for processing NQJs while the other for processing QDJs. There are (28=256) possible partitions for the multicluster. The x-axis in Fig.5 is the ratio of the total computing power of clusters ( ∑ mi u i ) for processing NQJs to that for QDJs. The data depicted in Fig.5 comes from the par-
titions in which neither part of the multicluster is saturated. Table 5 The multicluster partition under three job streams by enumeration and the OCP strategy Partition Scheme Enumeration OCP
NQJ=30%, QDJ=70%
NQJ=50%, QDJ=50%
NQJ
1, 2, 3
1, 2, 3, 7
QDJ
4, 5, 6, 7, 8
4, 5, 6, 8
NQJ
1, 2, 3
2, 3, 4, 8
QDJ
4, 5, 6, 7, 8
1, 5, 6, 7
NQJ=70%, QDJ=30% 1, 2, 3, 4, 7, 8 5, 6 1, 2, 3, 4, 7, 8 5, 6
It can be observed from Fig.5 that for all three heterogeneous job streams, the comprehensive performance metric CP varies as the multicluster partition changes; when too much computing power is devoted to processing NQJs or QDJs the value of CP will increase. This suggests that judicial multicluster partitioning is necessary to achieve a high comprehensive performance. The optimal multicluster partition for each job stream is obtained by enumeration, which is labelled OP in Fig.5. This partition achieves the lowest CP. When the proportion of NQJs increases, the OCP strategy adjusts the multicluster partition on-line. The corresponding partition is labelled OP'. As can be seen from the figure, the CP performance obtained by OCP is very close to the result obtained by the enumeration approach. The detailed partition of the multicluster is listed in Table 5. This suggests that OCP can partition the multicluster at low lost to achieve high comprehensive performance.
6. Conclusion This paper addresses workload allocation techniques in multiclusters. An ORT strategy is developed to optimize the mean response time of homogeneous NQJ workloads, while an OMR strategy is presented to optimize the mean miss rate of homogeneous QDJ workloads. These optimization strategies are derived from queueing network theory. Based on ORT and OMR, an allocation strategy is proposed to dynamically adjust the partition of the multicluster system to achieve optimized comprehensive performance for heterogeneous workloads, which contains both NQJs and QDJs. The proposed workload allocation techniques are evaluated through extensive experimental analysis. The results shows that the ORT- and OMRbased strategies perform significantly better than the traditional workload allocation policies. These workload allocation techniques can be applied in e-business workload management scenarios to improve the request distribution across clusters of servers.
References
[1] B. Adelberg, H. Garcia-Molina and B. Kao, “Emulating soft real-time scheduling using traditional operating system schedulers,” Proc of IEEE 1994 Real-time Systems Symposium. [2] O. Aumage, “Heterogeneous multi-cluster networking with the Madeleine III,” International Parallel and Distributed Processing Symposium (IPDPS 2002), 2002. [3] S. A. Banawan and N. M. Zeidat. “A comparative study of load sharing in heterogeneous multicomputer systems.” Proc. of the 25th Annual Simulation Symposium, 1992, pp. 22–31. [4] S. Banen, A. Bucur, and D. Epema, “A Measurement-based simulation study of processor co-allocation in multicluster systems,” 9th Workshop on Job Scheduling Strategies for Parallel Processing. [5] M. Barreto, R. Avila, and P. Navaux, “The MultiCluster model to the integrated use of multiple workstation clusters,” 3rd Workshop on Personal Computerbased Networks of Workstations, 2000. [6] G. Bolch, Performance Modeling of Computer Systems, 2002. [7] A. Bucur and D. Epema, “The maximal utilization of processor co-allocation in multicluster Systems,” Int'l Parallel and Distributed Processing Symp. (IPDPS 2003), 2003. [8] A. Bucur and D. Epema, “Trace-Based Simulations of Processor Co-Allocation Policies in Multiclusters,” 12th IEEE Int'l Symp on High Performance Distributed Computing, 2003. [9] R. Buyya and M. Baker, “Emerging Technologies for Multicluster/Grid Computing,” Proceedings of the 2001 IEEE International Conference on Cluster Computing, 2001. [10] K. Chen and L. Decreusefond, “Just how bad is the FIFO discipline for handling randomly arriving time-critical messages, ”, IEEE Intl Workshop on Factory Communication Systems, 1995. [11] A. Dogan, F. ÖzgünerI, “On QoS-Based Scheduling of a Meta-Task with Multiple QoS Demands in Heterogeneous Computing,” International Parallel and Distributed Processing Symposium, 2002. [12] L. He, S A. Jarvis, D P. Spooner, G R. Nudd, "Optimising static workload allocation in multiclusters", Proceedings of 18th IEEE International Parallel and Distributed Processing Symposium (IPDPS'04), April 26-30, 2004, Santa Fe, New Mexico. [13] B. Kao and H. Garcia-Molina, “Scheduling soft real-time jobs over dual non-real-time servers,” IEEE Trans. on Parallel and Distributed Systems, 7(1): 56-68, 1996. [14] L. Kleinrock, Queueing system, John Wiley & Sons, 1975. [15] R. Leslie and S. McKenzie. “Evaluation of loadsharing algorithms for heterogeneous distributed systems,” Computer Communications, 22(4): 376–389, 1999. [16] Z. Liu, M S. Squillante and J L.Wolf, “On Maximizing Service-Level-Agreement Profits”, Proceedings of the 3rd ACM conference on Electronic Commerce, 2001. [17] E. Rahm and R. Marek, “Analysis of dynamic load balancing strategies for parallel shared nothing database systems, ” 19th int. Conf. on Very Large Database Systems, 1993. [18] N. G. Shivaratri, P. Krueger, and M. Singhal. “Load distribution for locally distributed systems,” IEEE Computer, 8(12):33–44, 1992. [19] X. Tang, S. Chanson, “Optimizing static job scheduling in a network of heterogeneous computers,” the 29th International Conference on Parallel Processing, 2000. [20] http://www.platform.com/products/LSF/addons.asp