QUIM: A Framework for Quantifying Usability Metrics in Software Quality Models A. Seffah Dept. of Computer Science Concordia University
[email protected]
N. Kececi Dept. of Computer Science University of Quebec at Montreal
[email protected]
Abstract This paper examines current approaches to usability metrics and proposes a new approach for quantifying software quality in use, based on modeling the dynamic relationships of the attributes that affect software usability. The Quality in Use Integrated Map (QUIM) is proposed for specifying and identifying quality in use components, which brings together different factors, criteria, metrics and data defined in different Human Computer Interface and Software Engineering models. The Graphical Dynamic Quality Assessment (GDQA) model is used to analyse interaction of these components into a systematic structure. The paper first introduces a new classification scheme into graphical logic based framework using QUIM components (factors, criteria metrics and data) to assess quality in use of interactive systems. Then, we illustrate how QUIM and GDQA may be used to assess software usability using subjective measures of quality characteristics as defined in ISO/IEC 9126. Keywords: usability, quality in use, usability metrics, ISO-9126, software quality model, interactive systems
1. Introduction Although quality in use – commonly usability or user perspective of software quality - has received widespread attention within both the software engineering and human computer interaction (HCI) communities, there are few integrated software quality models for specifying and measuring our current meaning of usability (McCall, 1977; Boehm, 1978). The HCI community has developed different models for specifying or measuring usability. One of their weaknesses is that they are not well integrated within the software engineering models. A good quality in use model should define all the characteristics that are required for a product to meet predefined usability goals in a specified context of use.
M. Donyaee Dept. of Computer Science Concordia University
[email protected]
Furthermore, the list of characteristics should include efficiency, learnability human satisfaction and safety as well as the measurable attributes (metrics). In addition, a good quality in use model should explicitly define the relationships that can exist between the characteristics and the measurable attributes. Ot her requirements of a good model are: • Decomposability – Stakeholders often express their needs in qualitative characteristics such as use satisfaction and efficiency. These characteristics are easy to understand but most of the time difficult to measure. A model for usability should decompose consumer-oriented characteristics into measurable oriented attributes. • Functionality – An efficient quality in use model should be flexible in such a way it can be used at various steps of the software development lifecycle. • Usability – The model should be itself easy to use and learn by all the person involved in the software development lifecycle including novice software quality engineers, usability engineers as well as user interface developers who are not necessary familiar with usability. • Automated support – A quality model should be supported by tool that can facilitate the process of gathering usability requirements as well as testing/predicting usability. The tool should also mediate the communication between usability engineers and software engineers. This is one of the major weaknesses of the current usability models that software engineering approaches can improve. As a model for quality in use, our QUIM (Quality in Use Integrated Map) addressed these requirements. QUIM can be seen as a framework for: (1) reconciling the existing software engineering and human computer interaction quality models in particular those that address the usability, (2) facilitating the specification and measurement of quality in use in conjunction with the two other dimensions of software quality – developer and manager perspectives -, (3) making usability more approachable by
software engineers. QUIM is a framework for studying, defining and validating a specific model for quality in use for specific kind of application. Many inconsistencies are identified in the existing quality in use and usability models as well as the relationships (factors/criteria/metrics) that have not been clearly defined. Logic-based Dynamic Quality Analyses (DQA) method is used to remove inconsistencies as well as to clear definition of the relationships. While QUIM defines the components of quality system, DQA analyzes the relationships between these components. It helps quality engineers to clarify relationships from factor to data or vice-versa.
2. Usability in Existing Software Quality Models – A brief Overview In this section, the similarities and differences of different standards and models for defying usability, specifying, measuring or predicting quality in use are reviewed.
2.1 Usability in Human Computer Interaction In human computer interaction community, many definitions of usability and frameworks for its specification and measurement exist, making sometimes usability a confusing concept. Many standards that address explicitly usability are also available (Bevan95). Among them, we list the following: • ISO 9241-11 standard defines usability as a highlevel quality objective: “The extent to which, a product can be used by specified users to achieve specified goals with effectiveness, efficiency and satisfaction in a specified context of use”. This model suggests different metrics. The major limitation of this standard as quality model is that it is so abstract, and the relationships between metrics and usability objectives are not explicitly defined. • The ISO/IEC 14598-1 suggests a model for studying and measuring quality in use from the internal software attributes in a particular context of use. Software quality attributes are the cause - quality in use, the effect. Quality in use is (or at least should be) the objective; software product quality is the means of achieving it. The user’s needs in terms of usability goals are expressed as a set of requirements for the behavior of the product in use (for a software product, the behavior of the software when it is executed.) These requirements will depend on the characteristics of each part of the overall system including hardware, software and users. The requirements should be expressed as metrics that can be measured when the system is used in its intended context, for instance by measures of effectiveness, efficiency and satisfaction. Even if this model is incomplete in the sense that it addressed only the software quality attributes and their
impact on usability, this model can be used as the basic foundation of an integrated model that combines usability and software engineering models.
2.2 Usability in Software Engineering In the software engineering community there are few agreed metrics that capture our intuitive meaning of usability. The following are the most important models that introduce usability as one of the software quality factors: • Boehm model – This model is one of the first quality models for software quality (Boehm, 1978). He proposed a multilevel hierarchy or a tree of software criteria. He suggested that a software product is usable if it is portable, maintainable and in turn at the next level he decomposed those criteria to the others, for example, he decomposed maintainability into testability, understandability, and modifiability. • McCall model - This model, is also called GE model (Fenton, 1997) or FCM (Factor, Criteria and Metric was proposed by McCall in 1977). It is based on three uses of a software product, i.e. product revision, product operations and product transition. For every one of those uses, this model defines different factors that describe the external view of the system, as it is perceived by end-users. Each factor is decomposed into criteria that describe the internal view of the product as perceived by software developer. Criteria could be common between different factors. • IEEE 1061 (1998) Standard on Software Quality Metrics Methodology. This standard provides a methodology for establishing quality requirements as well as identifying, implementing, analyzing and validating process and product software quality metrics. This methodology applies to all software at all phases of any software life cycle. This standard does not prescribe any specific metric. The model suggests a hierarchy including different levels for quality factors, quality sub factors and metrics as well. • The ISO/IEC 9126 – This standard breaks software quality down into six broad categories of characteristics of the software: functionality, reliability, usability, efficiency, maintainability and portability. These can be further broken down into sub characteristics that have measurable attributes.
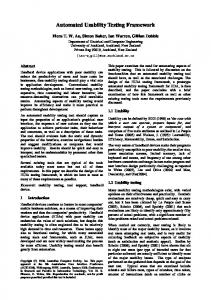
3. QUIM: Quality in Use Integrated Map QUIM is a hierarchical model like the software engineering models discussed in the previous section. The difference is that, it distinguishes four levels called factors, criteria, metrics and data (Figure 1). The relationship between these layers is an N-M relationship.
including those who require assistance technologies like screen magnifiers or voice recognition.
3.3 Criteria
Figure 1: QUIM Structure and Usages
3.1 Quality in Use In QUIM, we define quality in use as the end user perspective of software quality. The definition of quality in ISO 8402 reflects the user view. User is mainly interested in using the software, its performance and the effects of using it. Then the user is not concerned with the internal aspects of the product. The user just sees observable external attributes of the software. Or one may say user is interested in final product quality. QUIM is also an open model in the sense that the cause/effect relationship between the user and developer perspectives of quality is explicitly considered. As an example, user and developer both are interested in performance of the software, but user could see this attribute as response time to the event entered by him, and developer thinks of it as data structure depth or path length.
3.2 Factors The following are factors that are included in QUIM (Donyaee and Seffah, 2001): 1. Effectiveness: The degree of accuracy and completeness with which the user achieves a specified task in a certain context. 2. Efficiency: The amount of resources expended in relation to the accuracy and completeness with which the user achieves a goal. 3. Satisfaction: Freedom from discomfort and positive attitude towards the use of the software product. 4. Productivity 5. Safety 6. Internationability: The degree to which software can be used for the global marketplace, taking into account variations in regions, population stereotypes, languages, and cultures. 7. Accessibility: The degree to which software can be used comfortably by a wide variety of people,
Like many others model, criteria are sub-factors. The difference is that they are measurable through a set of metrics. The following are examples of criteria. 3. Attractiveness: Indicator expressing the extent of which user likes the software during the operation. 4. Consistency (Lin, 1997): Attributes that bear on the uniformity of user interface. 5. Minimal Action (Lin, 1997): The extent to which user needs to take minimal effort to achieve a specific task. 6. Minimal Memory load (Lin, 1997): The extent to which user needs to keep minimal amount of information in mind to achieve a specified task. 7. Completeness: The extent to which the user can complete a specified task.
3.4 Metrics The IEEE metrics standard defines a software metric as “a function whose inputs are software data and whose output is a single numerical value that can be interpreted as the degree to which the software possesses a given attribute that affects its quality “. In the context of QUIM, the output of a metric function is a numeric value that summarizes the status of specific criteria. We have identified about 100 usability metrics, some of them are functions and some are just simple countable data. As examples of metrics, we are going to introduce some that are defined previously and have been validated, and also are general enough, so they could be applied to most software and context of use. To have detailed explanation and examples of calculation one may refer to the mentioned reference in every case. • Task Concordance (Constantine, 1999): This is an index of how well the expected frequencies of tasks match their difficulty, good design will generally make the more frequent tasks easier (less steps or less efforts). To calculate this first we have to list all tasks ranked in order of descending expected frequency, along with their number of user steps in use case. This metric, in brief TC, is determined by the following function: TC = 100 × D / (N × (N – 1) / 2) Where N is the number of tasks being ranked, and D, i.e. Discordance Score, is the number of pairs of tasks whose difficulties are in right order minus those pairs whose difficulties are not in right order. • Visual Coherence (VC) (Constantine, 1999): Shows how well a user interface keeps related components together and unrelated components apart. VC is determined using the following function: VC=100 × G / (N × (N - 1) / 2)
Where G is the number of related visual component pairs in the group, and N is the number of visual components in the group.
3.5 Data The basic of QUIM is the data that is required to estimate metrics. Data can be qualitative or quantitative. There are different methods to estimate a metric from data: • Countable: Sometimes data is a countable entity, and in that case it could be considered as a metric and directly related to a criterion. The example is Number of individual items on the screen, or Time to complete a specific task. The data gathered from questioners are falling also in this category, and they feed input of statistical function metrics. • Calculable: Some data are determined by calculation. For example, percent of task completed. This data is used in metric Task Effectiveness (TE): TE = Quantity x Quality / 100 Where Quantity is the percent of task completed and Quality is the percent of goal achieved (Bevan, 1995). Data are gathered from different sources including: (1) users and usability engineers, (2) questionnaires, (3) final user documentation (4) system (5) design artifacts such as object-oriented models (6) task analysis and others requirements artifacts (7) user interfaces high and lowfidelity prototypes such as storyboard, paper, video and software prototypes (8) process improvement data including specification, design, implementation reviews
3.6 The relationship between QUIM layers As mentioned before, QUIM is not exactly a tree. A specific metric could affect more than one criterion and then it is connected to more than one criterion. This is also the case at every level. Figure 2 is an example that shows those relationships. As we can see in the example, the data “Number of visual components” is an input to two different metrics “Visual Coherence” and “Layout Uniformity” (Constantine, 1999). Those metrics measure the criteria “Minimal Memory Load” which affect “Efficiency” and “Satisfaction”. What ever is coming in the example map is just to show that the relationship between components of QUIM can be very complex. On the other hand, consider that you would like to predict how the different values for data that are used for determining a metric or different combination of metrics could affect your system’s quality in use. Consider the metric Task Concordance (Constantine, 1999) affects the criteria Completeness and the latter in order affects the factor Effectiveness. Then if we increase Task Concordance value, the effectiveness of user interface is increased. Again, consider the metric Interface Shallowness (Yamada, 1995) who affects the criteria Minimal Memory Load that has an impact on efficiency and effectiveness. It means if we reduce the shallowness of
interface and so the user memory load, then we have increased both Efficiency and Effectiveness. Now let’s use this information gathered from the model. If Efficiency and Effectiveness of the user interface are desired at the same degree, then we have to put more effort on reducing the Interface Shallowness, during the design phase. It is important to recall that all above relationships came just as example to see how one may use QUIM. As we will see in the next section, those relationships need to be defined
Figure 2. The example of QUIM components relationships
4. GDQA Graphical Dynamic Quality Analysis The Graphical Dynamic Quality Analysis (GDQA) method has been developed for building high quality requirement specifications (Keceli, 2001). The GDQA offers a graphical presentation of quality requirements based on logic-based framework. It assumes that each quality requirement can be expressed as multi-variable functions, which are independent from each other in terms of their objective; however, each quality factor may have other dependencies, such as sharing primitive measures or indirect measures. Constructing a function with GDQA is relatively easy for software developer. The logic-based graphical method provides a conceptual framework for analyzing and understanding the relationships between the components of any complex system. Procedure for constructing functional requirements with GDQA have been summarized into following three-steps. • Decompose each quality factors (requirement) into hierarchical level until reach their metrics. • Decompose each metric into hierarchical level until reach data, which are necessary for calculating these values. • Identify the relationships between data/metrics/criteria/ factors. Relationships between factors and data can be an entity, a simple calculation
decomposed into vertical direction with its related factors and criteria until reach to their metrics. Many variables could be necessary to calculate one metric. To specify these variables, different quality model is integrated into QUIM such as ISO/IEC 9216, ISO/IEC 9241, ISO/IEC 14595-1, Boehm, McCall and others.
(division, multiplication etc.) or a complex formula (prediction model) that helps to calculate related values of factors. Figure 3 illustrates GDQA framework in a conceptual form. While F1 represents a quality factor, F1-1 and F1-2 represent its relevant criteria. High-level goal is
Quality Prediction Calculate Read
F F1
F22
Predict F F11- 2
F 1--1
F F22- 1
F F22- 2
M M1
F 1 = Quality Factor M 1--1
F2= Quality Factor M 1= Model
M 1--2
M2 = Model
M M 1 -3
M 3= M e a s u r e M 11--1= Measure
M 1--3 --11
M 11--2= Measure
M 1--3 -2
M 1 - 3= M o d e l M 1 - 3 -1 = Measure
M 22
M 1 - 3 -2 = Measure M 33
Figure 3. Graphical Dynamic Quality Analysis
4.1 Analyzing the components framework using GDQA
of
QUIM
More than 100 measures for quality in use are identified and integrated into QUIM framework. GDQA Model helps to identify data as well as their relationships with metrics, criteria and factors. In addition, it helps to identify data that are used for computing more than one metrics and it gives clear picture for the relationships between factors-
criteria as well as the relationships between factors- data. Figure 4 illustrates a sample implementation of QUIM components given in Figure 2. It shows clearly the relationships between factors and the direct metrics and data. A criterion can support different factors or one data can be used to compute different metrics. Moreover, when user defined quality factor GDQA will bring automatically all the data that are required for quantifying the factor.
Objective
Factors
Criteria
Metrics
Visual Coherence
Satisfaction
Quality in Use
Efficiency
Minimal Memory Load
Layout Uniformity
Effectiven ess Effectiveness
Completeness
Interface Shallowness
Task Concordance
Data #of related visual component pairs #of visual components #of different height #of different width #of nodes Sum of interface distances for the shortest path from root to node i #of task Discordance score
Figure 4. GDQA framework using QUIM measures
example. The data (variables), which are listed in Table 2, are taken from ISO 9126. The measures, which are used more than once, are detected with the GDQA method. Criteria and metrics, which are listed in Table 1, are used in the GQAM model as components of usability objectives/goal.
5.Case Study: Using QUIM and GDQA for Defying the ISO/IEC 9216 Model for Usability Usability is proposed as a quality factor in the ISO/IEC 9216. Internal usability characteristics have been studied in this research. The result is illustrated in Figure 5 as an
Usability
FACTORS
Understandability
CRITERIA
IUX1
METRICS
IUX2
IUX3
Operability
Learn-ability
ILT
ILX1
ILX2
IOX1
IOT1
IOX2
Attractiveness
IOX3
IOX4
IAX1
IAX2
IUA1
DATA IUB2
IUB1 IUA2 IUA3 IUB3 L avgT ILA1
ILB2
ILB1 ILA2 IOA1
IOB3
IOB1 IOT2 IOT3 IOA2 IOB2 IOA3 IOA4 IOB4 IAA1 IAB1 IAA2 IAT1
Figure 5. GDQA Model with ISO/IEC 9216 Table 1. Usability in ISO 9256 Criteria Metrics Description Understandability
Learnability
Operability
Attractiveness
Completeness of function understood Evident Functions Function Understandability Easy of Learning Easy of use help system Effectiveness of help system Self Explanatory error message Error Correction Input undo-ability Error undo-ability Customizability Interface appearance customizability User Operational frequency
Metrics (Xn=An/Bn) IUX1= IUA1/IUB1 IUX2=IUA2/IUB2 IUX3= IUA3/IUB3 ILT-TIME ILX1=ILA1/ILB1 ILX2=ILA2/ILB2 IOX1=IOA1/IOB1 IOT1=IOT2-IOT3 IOX2=IOA2/IOB2 IOX3=IOA3/IOB3 IOX4=IOA4/IOB4 IAX1=IAA1/IAB1 IAX2=IAA2/IAT1
Table 1 Usability model proposed in ISO/IEC 9126
Number of Data 2 2 2 1 2 2 2 2 2 2 2 2 2
Data IUA1 IUB1 IUA2 IUB2 IUA3 IUB3 ILA1 ILB1 ILA2 ILB2 ILA3 ILB3 ILT IOA1 IOB1 IOT2 IOT3 IOA2 IOB2 IOA3 IOB3 IOB4 IAA1 IAB1 IAA2 IAT1 Table 2
Description Number of functions understood Total number of functions Number of functions identified by the user Total number of actual functions Number of interface functions whose purpose is correctly described by the user Number of functions available from the interface Number of tasks for which correct online help Number of tasks tested Number of tasks successfully completed after accessing online help Number of tasks tested Number of functions that can be used Total Number of functions provided Mean time taken to learn to use a function correctly Number of error conditions for which the user propose the correct recovery action Number of error conditions tested Time completing correct specified type errors of performing Time starting correct specified type errors of performing task Number of input errors which the user successfully corrects Number of attempts to correct input errors Number of functions successfully customised Number of error conditions tested Number of attempts to customise Number of turns which user failed to select input/output expression Number of turns which user tried to select input/output expression Number of turns which user use the specific software functions Operation time Data that are necessary for assessing internal usability factors in ISO/IEC- 9126.
6. Conclusion and Further Research In this paper, we discussed the similarities, differences, and limitations of various models for studying, specifying and measuring usability, contrasting the software engineering quality models with the human computer interaction standards for usability. Then we suggested an integrated framework (QUIM) for measuring and specifying quality in use models. Our work to date has addressed one of the major issues towards the integrated framework namely, i.e. what factors, criteria and metrics should be developed, and what data should be gathered to calculate these metrics. Our analysis of the existing models conducted us to the definition and validation of 7 factors, 12 attributes and more than 100 metrics that are integrated into QUIM. We have also shown how GDQA tool can use to study the relationships between QUIM components. QUIM and GDQA are being used to develop different quality in use model. We would like to highlight that one goal of developing QUIM, is keeping it as simple, easy and understandable as possible, in such a way it can reduce software development risks in a less expensive approach. To achieve this important goal, we are developing a tool, QUIM editor. This editor is a four -pane window where the hierarchy of factors, criteria, metrics and data can be viewed. Like Class Explorer used in many GUI builders, the QUIM editor can be used for many tasks such as getting the definition of a factor, attribute or metrics, understanding the relationship between them, or adding or modifying these relationships (Figure 6).
Figure 6. The main interface of QUM Toolset
7. References [1]
Bevan, N., (1995), Usability is Quality of Use, Anzai & Ogawa (eds) Proceeding of the 6 th International Conference on Human Computer Interaction, July 1995, Elsevier. [2] Bevan, N., (1995), Measuring Usability as Quality of Use, Software Quality Journal, Vol. 4, pp. 115-130. [3] Constantine, Lockwood, (1999), Software for Use, Addison-Wesley, pp. 427. [4] Fenton, N., Pfleeger, S.L., (1997), Software Metrics A rigorous and Practical Approach, International Thompson Publishing Company. [5] Han X Lin, Yee-Yin Choong, Gavriel Salvendy (1997), A Proposed Index of Usability: A Method for Comparing the Relative Usability of Different Software Systems Usability Evaluation Methods, Behavior and Information Technology, Vol. 16, no 4-5, pp. 267-278. [6] IEEE Std. 1061 (1998), IEEE Std. 1061 (1998), Software Quality Metrics Methodology. [7] ISO 9126(1991): Software Product Evaluation – Quality Characteristics and Guidelines for Their Use. [8] ISO/DIS 9241-11(1996): Guidance on Usability. Ergonomic Requirements for Office Work with Visual Display Terminals (VDT). [9] Shoji Yamada, Jung-kook Hong, Shigehar Sugita, (1995), Development and Evaluation of Hypermedia for Museum Education: Validation of Metrics, ACM Transactions of Computer Human Interface, Vol. 2, no 4. [10] Kececi, N., Abran, A., Analyzing, Measuring and Assessing Software Quality in a Logic Based Graphical Model, 4 th International Conference on Quality and Dependability-QUALITA 2001, 22-23 March 2001, Annecy, France.
[11] Donyaee, M., Seffah, A., QUIM: An Integrated Model for Specifying and Measuring Quality in Use, Eighth IFIP Conference on Human Computer Interaction, July 9-13, 2001, Tokyo, Japan.