Feb 18, 2016 - circuit elements ([2], [3]) has demonstrated the potential of performing inference .... TrueNorth is a neuromorphic processor composed of digital.
A Nonparametric Framework for Quantifying Generative Inference on Neuromorphic Systems Ojash Neopane∗†‡1 , Srinjoy Das∗†‡1 , Ery Arias-Castro∗ , Ken Kreutz-Delgado†‡ Email: {oneopane, s2das, eariasca, kreutz, }@ucsd.edu
arXiv:1602.05996v1 [cs.NE] 18 Feb 2016
†
ECE, ∗ Dept. of Mathematics & ‡ Calit2/QI Pattern Recognition Laboratory, UC San Diego, La Jolla, CA 92093 1 Ojash Neopane and Srinjoy Das have contributed equally to this work.
Abstract—Restricted Boltzmann Machines and Deep Belief Networks have been successfully used in probabilistic generative model applications such as image occlusion removal, pattern completion and motion synthesis. Generative inference in such algorithms can be performed very efficiently on hardware using a Markov Chain Monte Carlo procedure called Gibbs sampling, where stochastic samples are drawn from noisy integrate and fire neurons implemented on neuromorphic substrates. Currently, no satisfactory metrics exist for evaluating the generative performance of such algorithms implemented on high-dimensional data for neuromorphic platforms. This paper demonstrates the application of nonparametric goodness-of-fit testing to both quantify the generative performance as well as provide decisiondirected criteria for choosing the parameters of the neuromorphic Gibbs sampler and optimizing usage of hardware resources used during sampling.
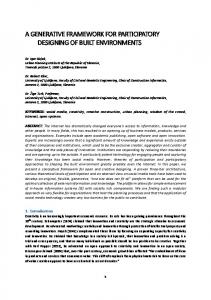
I. I NTRODUCTION Restricted Boltzmann Machines (RBMs) and Deep Belief Networks (DBNs) (Fig. 1) are stochastic graphical models that are commonly used in both discriminative and generative applications such as image classification, sequence completion, and speech recognition. An RBM is a symmetrically connected, bipartite Markov Random Field (MRF) which is composed of neuron-like units– these partitions are called the visible layer v and the hidden layer h. In an RBM, both inference and learning use a Markov Chain Monte Carlo (MCMC) procedure called Gibbs sampling [1]. To implement Gibbs sampling using binary RBMs each neuron is sampled based on a sigmoidal activation function which is a function of the total input from other connected neurons. A DBN can be thought of as multiple RBMs ‘stacked’ onto each other, forming an N -partitioned Markov Random Field with one visible layer v, and multiple hidden layers hi with i ∈ 1, . . . , N − 1. RBMs and DBNs are commonly implemented on highperformance platforms such as CPUs and GPUs deployed on cloud computing infrastructures. However recent progress in the field of neuromorphic VLSI using both digital and analog circuit elements ([2], [3]) has demonstrated the potential of performing inference on RBMs/DBNs implemented on such substrates for ultra low-power, realtime applications. In such implementations, which consist of massively parallel arrays of spiking neurons, classification accuracy is an experimentally quantifiable metric for discriminative RBMs/DBNs as one can experimentally compute classification precision and accuracy
(a) (b) Fig. 1: a) Restricted Boltzmann Machine with 4 visible and 3 hidden units. b) Deep Belief Network with 3 hidden layers
using standard labeled datasets such as MNIST. On the other hand, implementing metrics for generative applications on such hardware remains a difficult task because of the highdimensional nature of real-world data.1 In this paper, we demonstrate the applicability of using a highly scaleable nonparametric framework to quantify the performance of RBMs and DBNs for generative tasks on real-world high-dimensional data sets based on goodness-of-fit testing. II. G ENERATIVE I NFERENCE AND P ERFORMANCE M ETRICS An RBM represents the probabilistic model of a data set using the Boltzmann distribution shown below: exp(−E(v, h)) 0 0 v 0 ,h0 exp(−E(v , h ))
p(v, h) = P
>
where E(v, h) = −v W h −
b> vv
−
(1)
b> hh
E is often called the energy function and depends on the state of both the visible and hidden units of the RBM. W is a matrix of weights between v and h, and bv , bh are the biases of the visible units v and hidden units h respectively. For binary RBMs, the Gibbs sampling procedure guarantees that a stationary Boltzmann distribution is achieved if the state of each RBM neuron is sampled according to the sigmoidal probability rule given below [1]: 1 P P (xi = 1|xj , j 6= i) = (2) 1 + exp(− j wij xj + bi ) Here wij , the i, j-th element of the matrix W , is the weight between neurons xi and xj , and bi denotes the bias of neuron xi . We would like to compare the Boltzmann distribution generated by the (neuromorphic hardware) Gibbs sampler 1 Essentially one is attempting to verify the correctness of an RBM-based probability distribution model for describing a high-dimensional data vector.
implemented on the neuromorphic substrate with that of the distribution generated by the benchmark ideal Gibbs sampler (in our case, implemented in software). This calls for a measure of dissimilarity between two distributions together with a way to estimate this dissimilarity based on samples from these distributions. The Kullback-Leibler (KL) divergence [4] is a common choice. However it is difficult to compute because doing so for RBMs requires the computation of the normalizing constant in the denominator of (1), known as the partition function, whose explicit calculation is prohibitive for high dimensional real world data. Annealed Importance sampling (AIS) [5] is another algorithm that has been used to quantify performance of RBMs/DBNs during generative tasks. Unlike KL-divergence, AIS does not suffer from computational complexity limitations. However, AIS only takes into consideration the parameters of the RBM in (1) trained with software and not the parameters of the hardware Gibbs sampler per se. A practical framework is to perform offline training of the RBM/DBN and then perform inference using Gibbs sampling by utilizing the dynamics of the underlying hardware sampler implemented on the substrate. In this paper, we propose using goodness-of-fit testing to compare the probability distributions generated by the hardware and benchmark software Gibbs samplers. To illustrate the methodology, we picked the Crossmatch test [6] among the class of graph-based tests nicely reviewed in [7]. III. T HE C ROSSMATCH TEST The Crossmatch test [6] is an example of nonparametric goodness-of-fit test in arbitrary dimensions based on a graph construction. Given two set of samples, X1 , . . . , Xn and Y1 , . . . , Yn , respectively from two probability distributions P and Q on some space Z equipped with a dissimilarity measure d : Z × Z 7→ R+ . (The test below generalizes to the case of samples of different sizes.) Let Zi = Xi if i ≤ m and = Yi−n if i > n. The Crossmatch procedure starts by computing a optimal non-bipartite matching of the Z’s, meaning, it finds a permutation σ ˆ of {1, . . . , 2n} that minimizes def
Match(σ) =
2n X
d(Zi , Zσ(i) ).
i=1
We note that other matchings (such as greedy matching) can be used [8]. The procedure then computes the crossmatch statistic, denoted A which is defined as the number of matched pairs including an X and a Y . The test rejects for small values of A. The null distribution of A is known in closed form [6]: 2a n! def f (a) = P (A = a) = 2n� 2 n [(n − a)/2)!] a! for a = 0, . . . , n. Having computed A = aobs , the resulting p-value is therefore equal to F (aobs ), where def
F (a) = P (A ≤ a) =
a X a0 =0
f (a0 ).
In our case we are dealing with distributions on {0, 1}r , where r is the dimension of the visible layer. The most common measure of dissimilarity is the Hamming distance, meaning d(z, z 0 ) =
r X
I{zj 6= zj0 }
j=1
z = (z1 , . . . , zr ) and z 0 = (z10 , . . . , zr0 ) in {0, 1}r . This is the dissimilarity measure that we use. Our process for comparing the output from two Gibbs samplers is as follows. We generate n samples from each Gibbs sampler and compute the p-value from the Crossmatch test based on the Hamming distance. We repeat the process many times, resulting in that many p-values. If the Gibbs samplers were to generate the same distribution, then the pvalues would be approximately uniform in [0, 1]. We can then look at statistics of these p-values. We chose to look at the mean p-value, which we use below as a similarity measure between two Gibbs sampler distributions. • A p-value near 0 indicates that the distributions are far enough for the Crossmatch test to notice with confidence that samples generated by the two distributions do not come from the same distribution. • A p-value near 0.5 indicates that the distributions are close enough that the Crossmatch test would not notice a (statistically) significant difference between how the two samples are distributed. IV. D IGITAL S AMPLER PARAMETER S ELECTION TrueNorth is a neuromorphic processor composed of digital integrate-and-fire (I&F) neurons with the capability to implement both stochastic and deterministic leak and threshold values [3]. The following algorithm for realizing the sigmoidal sampling rule (2) using these dynamical properties to perform MCMC sampling in RBMs was proposed in [9] and is as follows: Parameters: Tw , Vt , TP M , leak Input: vi = scale ∗ ( j wij xj + bi ), V = Vinitial = vi repeat V = V + leak ∗ (B(0.5)), where B is Bernoulli Vt rand = Vt + bU (0, 2TM − 1)c, where U is Uniform spiked(V ≥ Vt rand ) = 1 until Tw steps; The membrane potential of an I&F neuron which implements an RBM neuron is denoted by V . sampling in this algorithm is dependent on four parameters: Tw , the number of time steps used for sampling; Vt , the deterministic threshold; TM , the number of bits allocated for the stochastic threshold variation; and the value of the leak. In order to obtain a useful dynamic range, a multiplicative scale factor is applied to the weights and biases obtained from the offline RBM training [9]. After integration, the sampled value of an RBM neuron
Index G1 G2 G3 G4 G5 G6 G7
(Tw, Vt, TM, leak) (1, -130, 8, 0) (1, -80, 8, 102) (2, 0, 8, 100) (8, 79, 9, 49) (16, 50, 9, 15) (16, 100, 10, 30) (16, 633, 8, 90)
scale 50 50 50 50 30 50 100
TABLE I: Digital neuron parameters
is set to 1 if the corresponding I&F neuron spikes in any of the allowed number of sampling intervals Tw .
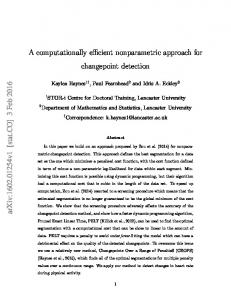
Fig. 3: The distribution of Crossmatch p-values for each of digital samplers in Table I. A higher mean p-value indicates a stronger statistical closeness to the ideal software Gibbs sampler
In this paper we select 7 different sets of parameters for the digital sampler as shown in Table I. The procedure for testing the 7 samplers was as follows. First, we trained an RBM in software with 784 visible units and 500 hidden units on the MNIST dataset consisting of 28 × 28 grayscale images of 5000 handwritten digits (the training data) to generate the weight matrix as well as the bias values. Following this, we initialized the visible units of the RBM with an initial set of values x ∈ {0, 1}784 each of which corresponded to one of the 1000 MNIST digits in the set of test data. We generated samples using the benchmark ideal Gibbs sampler in software which we refer to as the ideal data (see Fig. 2a). Following this, we then use the dynamics of the 7 digital samplers to perform MCMC sampling and thereby create seven sets of samples. Figure 2 illustrates the MNIST digits obtained by sampling with the ideal Gibbs sampler as well as with 2 hardware samplers from Table I (G2 and G5).
Fig. 4: Histogram of p-values generated from the Crossmatch test, comparing the Ideal Sampler with the G2 and G5 samplers. The p-value distribution of the G2 sampler more closely approximates a Uniform[0,1] distribution then the G5 sampler, and is thus has the better performance of the two samplers.
Fig. 5: A plot showing the estimated Energy Performance Efficiency of each of the 7 samplers
V. N ETWORK R ESOURCE O PTIMIZATION
(a)
(b)
(c)
Fig. 2: Images generated by (a) the benchmark ideal Gibbs sampler (b) the G2 hardware sampler (c) the G5 hardware sampler. It is difficult to visually distinguish which hardware sampler has the best performance.
..
..
..
..
For comparing each digital sampler against the ideal benchmark, 5,000 trials of Crossmatch were run, resulting in 5,000 p-values (for each digital sampler). The distribution of the pvalues from the simulations are shown in Figure 3. From this figure and the description of each digital sampler in Table I, it can be seen that the sampler latency Tw and scale are both critical to the generative performance of the RBM. Figure 4 shows a histogram of the distribution of p-values for digital samplers G2 and G5 (see Table I). To choose the appropriate sampler out of the samplers from Table I, we took the ratio between the mean p-value for each sampler, and its estimated energy consumption. The ratio of p-value to energy, the Energy Performance Efficiency (EPEff), is shown in Figure 5. The figure clearly indicates that out of all samplers from Table I sampler G2 has the highest EPEff and is thus the appropriate sampler to choose.
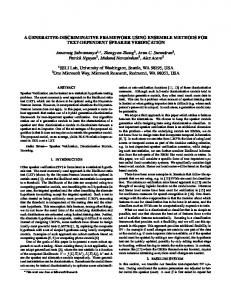
In order to implement the sampling algorithm described in Section IV, with arbitrary leak values, each RBM neuron, which has accumulated its input from other connected neurons, utilizes two TrueNorth neurons. Specifically, one I&F neuron with a stochastic threshold receiving inputs (data neuron) and a second neuron to produce the stochastic leak of 0 or 1 which is multiplied by the weight factor on the connected axon as per the leak value used in the algorithm (leak neuron). Figure 6 shows this implementation where the green neurons are the data neurons and the red neurons are the leak neurons. Since a single TrueNorth core has only 256 neurons, a direct implementation of this mapping scheme will result in only 50 percent of the neurons on a crossbar utilized for sampling which can result in a large number of cores for RBM/DBN implementations.
(a) (b) (c) Fig. 6: (a) The TrueNorth neuromorphic processor. (b) A diagram of a TrueNorth RBM sampling network with a leak density of one. Green neurons represent data neurons while red neurons represent leak neurons. (c) A diagram of a TrueNorth RBM sampling network with a leak density of 255.
One way to improve core utilization efficiency is to limit the number of leak neurons by relaying a single leak value to multiple data neurons. Such a modification would however reduce the quality of the generated samples since the original algorithm proposed in [9] requires the leak used for data neurons to be identically and independently distributed (i.i.d.). In such a scenario, Crossmatch can be used to study the loss of generative performance and determine an optimal density of data neurons to leak neurons which is henceforth referred to as the leak density (ld ). We chose sampler G2 to test the loss of performance and the optimal value of ld . Using this sampler, and 7 different values of leak density ld = 2, 5, 10, 50, 100, 200, 255, we studied the variation of generative performance during sampling from the MNIST RBM implemented on TrueNorth. The results of the experiment are shown in Figure 7 below.
using their own neuron dynamics [10]. The behavior of such neurons are governed by the following equation: d ui = −gL ui + Ii (t) + σξ(t) ui (t) ∈ (Vreset , θ) (3) dt where C is the membrane capacitance, Vreset is the reset potential, ui is the neuron’s membrane potential, gL is the leak conductance, Ii (t) is the neuron’s synaptic current, θ is the neuron’s threshold, and σξ(t) is a noise term in which σ is the noise variance. Similar to the discussion in Section IV, Crossmatch can be used to determine optimal design parameters for the Gibbs sampler on the analog neuromorphic substrate. Additionally in such a system each neuron has its own i.i.d. noise term σξ(t) as shown in (3). Such continuoustime noise injection utilizes significant system bandwidth hence it is highly desirable to reduce this by connecting the same noise source to multiple neurons. Therefore, by applying the decision-directed strategy presented in Sections V and VI, the same noise source could be re-utilized among multiple neurons, improving system throughput, latency, power and hardware usage. C
VIII. C ONCLUSIONS Fig. 7: Mean p-values for the G2 sampler with different leak density values. A higher mean p-value indicates a stronger statistical closeness to the G2 sampler with ld = 1.
VI. E NERGY- PERFORMANCE TRADEOFF FOR N ETWORK R ESOURCE O PTIMIZATION We studied the variation of the EPEff (defined in Section IV) with respect to ld for the generative RBM model of MNIST implemented on TrueNorth. Here the energy estimated value consumed by TrueNorth during sampling. The results are shown in Figure 8. For low ld values, lower EPEff values were produced on account of the large number of cores required for sampling. For large ld values, low EPEff values were observed on account of the significant loss in accuracy as reflected by the Crossmatch p-values. It is clear from Figure 8 that ld = 10 maximizes the EPEff, and is thus the optimal choice for implementing sampling from the MNIST RBM on TrueNorth.
Fig. 8: Estimated Energy Performance Efficiency for various leak densities. A leak density of 20 maximizes the performance of the sampler with respect to energy usage.
VII. A PPLICABILITY TO DESIGN IN ANALOG NEUROMORPHIC SYSTEMS
Leaky integrate-and-fire neurons which can be implemented in analog neuromorphic systems also have the capability to perform Gibbs sampling from the generative model of an RBM
We have demonstrated how a nonparametric goodness-offit test like the Crossmatch can be used to evaluate the performance of a generative RBM model implemented on neuromorphic VLSI substrates. Such a test, and the p-values it provides when applied to many realized samples, can provide a useful tool for quantifying the accuracy of a Gibbs sampler, whether digital or analog. In particular, for the problem at hand, such a tool can facilitate the choice of hardware parameters and optimization of network resources. IX. ACKNOWLEDGMENTS The authors would like to thank the team members of the Brain-Inspired Computing group at IBM Almaden for supporting this project. The authors would also like to thank the Calit2/QI Pattern Recognition Laboratory at UCSD for providing funding support for attending the conference as well as Bruno Pedroni at UCSD. R EFERENCES [1] S. Haykin, Neural Networks and Learning Machines (3rd Edition). Prentice Hall, 2008. [2] G. Indiveri, B. Linares-Barranco, T. J. Hamilton, A. Van Schaik, R. Etienne-Cummings, T. Delbruck, S.-C. Liu, P. Dudek, P. H¨afliger, S. Renaud et al., “Neuromorphic silicon neuron circuits,” Frontiers in neuroscience, vol. 5, 2011. [3] P. A. Merolla, J. V. Arthur, R. Alvarez-Icaza, A. S. Cassidy, J. Sawada, F. Akopyan, B. L. Jackson, N. Imam, C. Guo, Y. Nakamura et al., “A million spiking-neuron integrated circuit with a scalable communication network and interface,” Science, vol. 345, no. 6197, pp. 668–673, 2014. [4] T. M. Cover and J. A. Thomas, Elements of information theory. John Wiley & Sons, 2012. [5] R. Salakhutdinov and I. Murray, “On the quantitative analysis of deep belief networks,” in Proceedings of the 25th international conference on Machine learning. ACM, 2008, pp. 872–879. [6] P. R. Rosenbaum, “An exact distribution-free test comparing two multivariate distributions based on adjacency,” Journal of the Royal Statistical Society: Series B (Statistical Methodology), vol. 67, no. 4, pp. 515–530, 2005.
[7] B. B. Bhattacharya, “Power of graph-based two-sample tests,” arXiv preprint arXiv:1508.07530, 2015. [8] E. Arias-Castro and B. Pelletier, “On the consistency of the crossmatch test,” arXiv preprint arXiv:1509.05790, 2015. [9] S. Das, B. Pedroni, P. Merolla, J. Arthur, A. Cassidy, D. Modha, G. Cauwenberghs, and K. Kreutz-Delgado, ““Gibbs Sampling with LowPower Spiking Digital Neurons”,” in IEEE Int. Symp. Circuits and Systems, 2015. [10] E. Neftci, S. Das, B. Pedroni, K. Kreutz-Delgado, and G. Cauwenberghs, “Event-driven contrastive divergence for spiking neuromorphic systems,” Frontiers in Neuroscience, vol. 7, p. 272, 2013.