Rainfall Forecasting Using Soft Computing Models and Multivariate Adaptive Regression Splines Ajith Abraham, Dan Steinberg† and Ninan Sajeeth Philip*
School of Computing and Information Technology Monash University (Gippsland Campus), Churchill, VIC 3842, Australia Email:
[email protected]
Salford Systems Inc† 8880 Rio San Diego, CA 92108, USA Email:
[email protected]
Department of Physics* Cochin University of Science and Technology, Kerala 682022, India Email:
[email protected]
Abstract Long-term rainfall prediction is a challenging task especially in the modern world where we are facing the major environmental problem of global warming. In general, climate and rainfall are highly non-linear phenomena in nature exhibiting what is known as the "butterfly effect". While some regions of the world are noticing a systematic decrease in annual rainfall, others notice increases in flooding and severe storms. The global nature of this phenomenon is very complicated and requires sophisticated computer modelling and simulation to predict accurately. The past few years have witnessed a growing recognition of Soft Computing (SC) technologies [17] that underlie the conception, design and utilization of intelligent systems . In this paper, the SC methods considered are i) Evolving Fuzzy Neural Network (EFuNN) ii) Artificial Neural Network using Scaled Conjugate Gradient Algorithm (ANNSCGA) iii) Adaptive Basis Function Neural Network (ABFNN) and iv) General Regression Neural Network (GRNN). Multivariate Adaptive Regression Splines (MARS) is a regression technique that uses a specific class of basis functions as predictors in place of the original data. In this paper, we report a performance analysis for MARS [1] [16] and the SC models considered. To evaluate the prediction efficiency, we made use of 87 years of rainfall data in Kerala state, the southern part of the Indian peninsula situated at o
o
latitude-longitude pairs (8 29' N - 76 57' E). The SC and MARS models were trained with 40 years of rainfall data. For performance evaluation, network predicted outputs were compared with the actual rainfall data for the remaining 47 years. Simulation results reveal that MARS is a good forecasting tool and performed better than the considered SC models.
Keywords: Soft computing, multivariate adaptive regression splines, neuro-fuzzy, neural networks, rainfall forecasting
1. Introduction The parameters that are required to predict rainfall are enormously complex and subtle even for a short time period. The period over which a prediction may be made is generally termed the event horizon and in best results, this is not more than a
week's time. It has been noted that the fluttering wings of a butterfly at one corner of the globe may ultimately cause a tornado at another geographically far away place. Edward Lorenz (a meteorologist at MIT) discovered this phenomenon in 1961, which is popularly known as the butterfly effect [8]. In our research, we aim to find out how well SC models and MARS are able to capture the periodicity in these patterns so that long-term predictions can be made [6] [10] [16]. This would help one to anticipate the general pattern of rainfall in the coming years with some degree of confidence. We used artificial neural networks, neuro-fuzzy systems and multi variate adaptive regression splines for predicting the rainfall time series. All the models were trained on the rainfall data corresponding to a certain period in the past and predictions were made over some other period. In Section 2, we present some theoretical background on MARS followed by a discussion of artificial neural networks and neuro-fuzzy systems in Section3. In section 4, the experimental set up is explained followed by discussions and simulation results. Conclusions are provided at the end of the paper.
2. Multivariate Adaptive Regression Splines (MARS) Splines can be considered an innovative mathematical process for complicated curve drawings and function approximation. Splines find ever-increasing application in the numerical methods, computer-aided design, and computer graphics areas. M athematical formulae for circles, parabolas, or sine waves are easy to construct, but how does one develop a formula to trace the shape of share value fluctuations or any time series prediction problems? The answer is to break the complex shape into simpler pieces, and then use a stock formula for each piece [3]. To develop a spline the X-axis is broken into a convenient number of regions. The boundary between regions is known as a knot. With a sufficiently large number of knots virtually any shape can be well approximated. While it is easy to draw a spline in two dimensions by keying on knot locations (approximating using linear, quadratic or cubic polynomial regression etc.), manipulating the mathematics in higher dimensions is best-accomplished using basis functions. The MARS model is a spline regression model that uses a specific class of basis functions as predictors in place of the original data [1]. The MARS basis function transform makes it possible to selectively blank out certain regions of a variable by making them zero, allowing MARS to focus on specific sub-regions of the data. MARS excels at finding optimal variable transformations and interactions, as well as the complex data structure that often hides in high-dimensional data [2]. Given the number of predictors in most data mining applications, it is infeasible to approximate a function y=f(x) in a generalization of splines by summarizing y in each distinct region of x. Even if we could assume that each predictor x had 35
only two distinct regions, a database with just 35 predictors would contain 2 or more than 34 billion regions. This is known as the curse of dimensionality. For some variables, two regions may not be enough to track the specifics of the function. If
the relationship of y to some x's is different in three or four regions, for example, with only 35 variables the number of regions requiring examination would be even larger than 34 billion. Given that neither the number of regions nor the knot locations can be specified a priori, a procedure is needed that accomplishes the following: •
judicious selection of which regions to look at and their boundaries, and
•
judicious determination of how many intervals are needed for each variable.
A successful method of region selection will need to be adaptive to the characteristics of the data. Such a solution will probably reject quite a few variables (accomplishing variable selection) and will take into account only a few variables at a time (also reducing the number of regions). Even if the method selects 30 variables for the model, it will not look at all 30 simultaneously. Similar simplification is accomplished by a decision tree (e.g., at a single node, only ancestor splits are being considered; thus, at a depth of six levels in the tree, only six variables are being used to define the node).
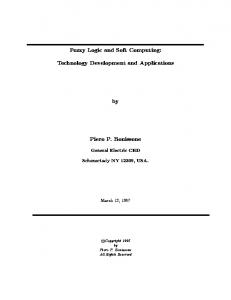
knots
Figure 1. MARS data estimation using spines and knots (actual data on the right) MARS Smoothing, Splines, Knots Selection and Basis Functions A key concept underlying the spline is the knot, which marks the end of one region of data and the beginning of another. Thus, the knot is where the behaviour of the function changes. Between knots, the model could be global (e.g., linear regression). In a classical spline, the knots are predetermined and evenly spaced, whereas in MARS, the knots are determined by a search procedure. Only as many knots as needed are included in a MARS model. If a straight line is a good fit, there will be no interior knots. In MARS, however, there is always at least one "pseudo" knot that corresponds to the smallest observed value of the predictor. Figure 1 depicts a MARS spline with three knots.
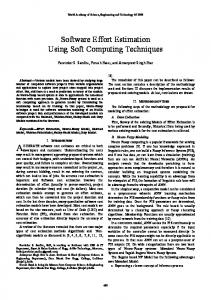
Figure 2. Variations of basis functions for c = 10 to 80
Finding the one best knot in a simple regression is a straightforward search problem: simply examine a large number of 2
potential knots and choose the one with the best R . However, finding the best pair of knots requires far more computation, and finding the best set of knots when the actual number needed is unknown is an even more challenging task. MARS finds the location and number of needed knots in a forward/backward stepwise fashion. First a model, which is clearly overfit with too many knots, is generated, then, those knots that contribute least to the overall fit are removed. Thus, the forward knot selection will include many incorrect knot locations, but these erroneous knots should eventually, be deleted from the model in the backwards pruning step (although this is not guaranteed). Thinking in terms of knot selection works very well to illustrate splines in one dimension; however, this context is unwieldy for working with a large number of variables simultaneously. Both concise notation and easy to manipulate programming expressions are required. It is also not clear how to construct or represent interactions using knot locations. In MARS, Basis Functions (BFs) are the machinery used for generalizing the search for knots. BFs are a set of functions used to represent the information contained in one or more variables. Much like principal components, BFs essentially re -express the relationship of the predictor variables with the target variable. The hockey stick BF, the core building block of the MARS model is often applied to a single variable multiple times. The hockey stick function maps variable X to new variable X*: max (0, X -c), or max (0, c - X). In the first form, X* is set to 0 for all values of X up to some threshold value c and X* is equal to X for all values of X greater than c. (Actually X* is equal to the amount by which X exceeds threshold c.) The second form generates a mirror image of the first. Figure 2 illustrates the variation in BFs for changes of c values (in steps of 10) for predictor variable X, ranging from 0 to 100. MARS generates basis functions by searching in a stepwise manner. It starts with a constant in the model and then begins the search for a variable-knot combination that improves the model the most (or, alternatively, worsens the model the least). The improvement is measured in part by the change in Mean Squared Error (MSE). Adding a basis function always reduces the MSE. MARS searches for a pair of hockey stick basis functions, the primary and mirror image, even though only one might be linearly independent of the other terms. This search is then repeated, with MARS searching for the best variable to add given the basis functions already in the model. The brute search process theoretically continues until every possible basis function has been added to the model.
In practice, the user specifies an upper limit for the number of knots to be generated in the forward stage. The limit should be large enough to ensure that the true model can be captured. A good rule of thumb for determining the minimum number is three to four times the number of basis functions in the optimal model. This limit may have to be set by trial and error.
3. Soft Computing Models Soft computing was first proposed by Zadeh [17] to construct new generation computationally intelligent hybrid systems consisting of neural networks, fuzzy inference system, approximate reasoning and derivative free optimisation techniques. It is well known that the intelligent systems, which can provide human like expertise such as domain knowledge, uncertain reasoning, and adaptation to a noisy and time varying environment, are important in tackling practical computing problems. In contrast with conventional artificial intelligence techniques which only deal with precision, certainty and rigor the guiding principle of hybrid systems is to exploit the tolerance for imprecision, uncertainty, low solution cost, robustness, partial truth to achieve tractability, and better rapport with reality. •
Artificial Neural Networks (ANNs)
ANNs were designed to mimic the characteristics of the biological neurons in the human brain and nervous system [14]. The network “learns” by adjusting the interconnections (called weights) between layers. When the network is adequately trained, it is able to generalize relevant output for a set of input data. A valuable property of neural networks is that of generalisation, whereby a trained neural network is able to p rovide a correct matching in the form of output data for a set of previously unseen input data [4]. Learning typically occurs by example through training, where the training algorithm iteratively adjusts the connection weights (synapses). •
Scaled Conjugate Gradient Algorithm (SCGA)
In the Conjugate Gradient Algorithm (CGA) a search is performed along conjugate directions, which produces generally faster convergence than steepest descent directions [5]. A search is made along the conjugate gradient direction to determine the step size, which will minimize the performance function along that line. A line search is performed to determine the optimal distance to move along the current search direction. Then the next search direction is determined so that it is conjugate to previous search direction. The general procedure for determining the new search direction is to combine the new steepest descent direction with the previous search direction. An important feature of the CGA is that the minimization performed in one step is not partially undone by the next, as it is the case with gradient descent methods. The key steps of the CGA is summarized as follows: •
Choose an initial weight vector wi.
•
Evaluate the gradient vector g1,and set the initial search direction d1=-g1
•
At step j, minimize E(w j + adj) with respect to a to give wj+1 = wj + amindj
•
Test to see if the stopping criterion is satisfied.
•
Evaluate the new gradient vector gj+1
•
Evaluate the new search direction using dj+1= -gj+1 + ßj dj. The various versions of conjugate gradient are distinguished by the manner in which the constant ßj is computed.
An important drawback of CGA is the requirement of a line search, which is computationally expensive. The Scaled Conjugate Gradient Algorithm (SCGA) is basically designed to avoid the time-consuming line search at each iteration. SCGA combine the modeltrust region approach, which is used in the Levenberg-Marquardt algorithm with the CGA. Detailed step-by-step descriptions of the algorithm can be found in Moller [7]. •
Adaptive Basis Function Neural Network (ABFNN)
ABFNN performs better than the standard backpropagation networks in complex problems [18]. The ABFNN works on the principle that the neural network always attempt to map the target space in terms of its basis functions or node functions. In standard BP networks, this function is a fixed sigmoid function that can map between zero and plus one (or between minus one and plus one) the input applied to it from minus infinity to plus infinity. It has many attractive properties that made the BP an efficient tool in a wide verity of applications. However some studies conducted on the BP algorithm have shown that in spite of its wide spread acceptance, they systematically outperform other classification procedures only when the targeted space has a sigmoidal shape. This implies that one should choose a basis function such that the network may represent the target space as a nested sum of products of the input parameters in terms of the basis function. The ABFNN thus starts with the standard sigmoid basis function and alters its non-linearity by an algorithm similar to the weight update algorithm used in BP. Instead of the standard sigmoid function, ABFNN uses a variable sigmoid function defined as:
Of =
a + tanh(x) 1+ a
where a is the control parameter that is initially set to unity and is modified along with the connection weights along the negative gradient of the error function. Such a modification could improve the speed of convergence and accuracy with which the network could approximate the target space. •
General Regression Neural Network (GRNN)
GRNN is often used for function approximation [20]. GRNN can be considered as a normalized Radial Basis Function (RBF) network [19] which has a radial basis layer and a special linear layer. These RBF units are called kernels and are usually probability density functions such as the Gaussian. The hidden -to-output weights are just the target v alues, so the output is simply a weighted average of the target values of training cases close to the given input case. The first layer is just like of
a RBF network with as many neurons as there are input/target vectors. Choosing the spread parameter of the radial basis layer determines the width of an area in the input space, to which each neuron responds. Spread should be large enough that neurons respond strongly to overlapping regions of the input space. If the spread is small the RBF is very steep so that the neuron with the weight vector closest to the input will have a much larger output than other neurons. The network will tend to respond with the target vector associated with the nearest design input vector. As the spread gets larger the RBF slope gets smoother and several neurons may respond to an input vector. The network then acts like it is taking a weighted average between target vectors whose design input vectors are closest to the new input vector. •
Neuro-Fuzzy Systems
We define a neuro-fuzzy system [11] as a combination of ANN and Fuzzy Inference System (FIS) in such a way that neural network learning algorithms are used to determine the parameters of FIS [13]. An even more important aspect is that the system should always be interpretable in terms of fuzzy if-then rules, because it is based on the fuzzy system reflecting vague knowledge. We used Evolving Fuzzy Neural Network [15] implementing a Mamdani type FIS [12] and all nodes are created during learning. EFuNN have a five-layer structure as shown in Figure 3. The input layer represents input variables. The second layer of nodes represents fuzzy quantification of each input variable space. Each input variable is represented here by a group of spatially arranged neurons to represent a fuzzy quantization of this variable. Different membership functions can be attached to these neurons (triangular, Gaussian, etc.). The nodes representing membership functions can be modified during learning. New neurons can evolve in this layer if, for a given input vector, the corresponding variable value does not belong to any of the existing MF to a degree greater than a membership threshold.
Figure 3. Architecture of EFuNN The third layer contains rule nodes that evolve through hybrid supervised/unsupervised learning. The rule nodes represent prototypes of input-output data associations, graphically represented as an association of hyper-spheres from the fuzzy input and fuzzy output spaces. Each rule node r is defined by two vectors of connection weights – W1 (r) and W2 (r), the latter being adjusted through
supervised learning based on the output error, and the former being adjusted through unsupervised learning based on similarity measure within a local area of the input problem space. The fourth layer of neurons represents fuzzy quantification for the output variables. The fifth layer represents the real values for the output variables. EFuNN evolving algorithm used in our experimentation was adapted from [15].
4. Experimentation Set-up – Training and Performance Evaluation The 87 years (1893-1980) rainfall data was standardized and the first 40 years (1893-1932) was used for training the prediction models and the remaining (1933-1980) for testing purposes. While the proposed neuro-fuzzy system and MARS models are capable of adapting the architecture according to the problem we had to perform some initial experiments to decide the architecture of the artificial neural network. Since rainfall has a yearly periodicity, we started with a network having 12 input nodes. Further experimentation showed that it was not necessary to include information corresponding to the whole year, but 3-month information centred over the predicted month of the fifth year in each of the 4 previous years would give good generalization properties. Thus, based on the information from the previous four years, the network would predict the amount of rain to be expected in each month of the fifth year. Experiments were carried out on a Pentium II 450MHz machine and the codes were executed using MATLAB and C++. Test data was presented to the network and the output fro m the network was compared with the actual rainfall data in the time series. EFuNN Training We used 5 membership functions for each input variable and the following evolving parameters: sensitivity threshold Sthr=0.999, error threshold Errthr=0.0001. EFuNN uses a one pass training approach and we obtained an RMSE of 0.0006. Adaptive Basis Function Neural Network Training We used 12 input nodes, 7 hidden nodes and one output node. The training was terminated after 1000 epochs and the RMSE was stabilized around 0.085. ANN – SCG Algorithm We used a feedforward neural network with 12 input nodes and two hidden layers consisting of 12 neurons each. We used log-sigmoidal activation function for the hidden neurons. The training was terminated after 600 epochs. General Regression Neural Network Training We created a GRNN network specifying the training RMSE to be 0.001 and choosen a spread value of 1. The created GRNN was then simulated with the test data.
MARS We allowed interaction between all the 12 input variables and we increased the number of basis functions in steps of five to depict the performance. To obtain the best possible prediction results (lowest RMSE), we sacrificed speed (minimum completion time). Figure 4 shows the change in RMSE values for change in number of basis functions.
Figure 4. MARS: Test set RMSE convergence
Figure 5. Test results showing monthly prediction of rainfall for 10 years using MARS and SC models.
•
Performance and Results Achieved
Table 1 summarizes the comparative performance of SC and MARS technique. Figure 5 depicts the predicted rainfall values (test results) for 10 years by the different models considered. Table 1. Training and testing performance comparison
MARS
EFuNN
ANN-SCGA
ABFNN
GRNN
Learning epochs Training error (RMSE)
1 0.0990
1 0.0006
600 0.0780
1000 0.0800
1 0.0010
Testing error (RMSE)
0.0780
0.0901
0.0923
0.0930
0.1040
Training time (seconds)
5
27
90
75
6
5. Conclusion In this paper, we attempted to forecast monthly rainfall using M ARS and SC models. As the RMSE values on test data are comparatively less, the prediction models are reliable. As evident from the entire test results (for 47 years), there have been few deviations of the predicted rainfall value from the actual. In some cases it is due to delay in the actual commencement of monsoon, EI-Nino Southern Oscillations (ENSO) resulting from the pressure oscillations between the tropical Indian Ocean and the tropical Pacific Ocean and their quasi periodic oscillations [9]. Prediction results reveal that MARS is capable of outperforming other SC models, which we considered in terms of performance time and lowest RMSE. Among SC models, EFuNN (neuro-fuzzy system) performed better than the neural networks in terms of low test set RMSE and performance time. Performance of EFuNN can be further enhanced (at a higher computational cost) by suitable selection of evolving parameters such as sensitivity threshold, error threshold, and number of membership functions assigned. EFuNN uses a one-pass train training approach, which will be ideal for online learning. Both ABFANN and ANNSCGA performed well with an RMSE error of 0.0930 and 0.0923 respectively. An important feature of the ABFANN is its small architecture (7 hidden neurons) while compared to the 24 hidden neurons used by ANNSCGA. GRNN gave a poor prediction as shown in Figure 5, with the highest RMSE of 0.1040. Compared to neural networks, an important advantage of the neuro-fuzzy model is its reasoning ability (if-then rules) of any particular state. In our experiments, we used only 40 years training data to evaluate the learning capability of the models (generalization capability from less training data). Performance of SC models and MARS could have been further improved by providing more training data.
References [1] Friedman J H, Multivariate Adaptive Regression Splines, Annals of Statistics, Vol 19, 1-141, 1991. [2] Steinberg D and Colla P L, MARS User Guide, San Diego, CA: Salford Systems, 1999. [3] Shikin E V and Plis A I, Handbook on Splines for the User, CRC Press, 1995.
th
[4] Abraham A and Nath B, Optimal Design of Neural Nets Using Hybrid Algorithms, In proceedings of 6 Pacific Rim International Conference on Artificial Intelligence (PRICAI 2000), pp. 510-520, 2000. [5] Hagan M T, Demuth H B and Beale M H, Neural Network Design, Boston, MA: PWS Publishing, 1996. [6] Abraham A, Philip N S and Joseph K B, Will we have a Wet Summer? Soft Computing Models for Long-term Rainfall th Forecasting, In Proceedings of 15 European Simulation Conference ESM 2001, Prague, June 2001. (Submitted) [7] Moller A F, A Scaled Conjugate Gradient Algorithm for Fast Supervised Learning, Neural Networks, Volume (6), pp. 525-533, 1993. [8] Butterfly Effect information center: http://www.staff.uiuc.edu/~gisabell/buttrfly.html [9] Chowdhury A and Mhasawade S V, Variations in Meteorological Floods during Summer Monsoon Over India, Mausam, 42, 2, 167-170,1991. [10] Philip N S and Joseph K B, On the Predictability of Rainfall in Kerala: An Application of ABF Neural Network, In Proceedings of Workshop on Intelligent Systems Design and Applications (ISDA 2001), In Conjunction with International Conference on Computational Sciences, ICCS 2001, San Francisco, May 2001 [11] Abraham A and Nath B, Designing Optimal Neuro -Fuzzy Systems for Intelligent Control, The Sixth International Conference on Control, Automation, Robotics and Vision, (ICARCV 2000), December 2000. [12] Mamdani E H and Assilian S, An experiment in Linguistic Synthesis with a Fuzzy Logic Controller, International Journal of Man-Machine Studies, Vol. 7, No.1, pp. 1-13, 1975. [13] Cherkassky V, Fuzzy Inference Systems: A Critical Review, Computational Intelligence: Soft Computing and FuzzyNeuro Integration with Applications, Kayak O, Zadeh LA et al (Eds.), Springer, pp.177-197, 1998. [14] Zurada J M, Introduction to Artificial Neural Systems , PWS Pub Co, 1992. [15] Kasabov N, Evolving Fuzzy Neural Networks - Algorithms, Applications and Biological Motivation, in Yamakawa T and Matsumoto G (Eds), Methodologies for the Conception, Design and Application of Soft Computing, World Scientific, pp. 271-274, 1998. [16] Abraham A and Steinberg D, Is Neural Network a Reliable Forecaster on Earth? A MARS Query!, In Proceedings of Sixth International Work Conference on Artificial and Neural Networks, Grenada, Spain, June 2001 (Submitted). [17] Zadeh LA, Roles of Soft Computing and Fuzzy Logic in the Conception, Design and Deployment of Information/Intelligent Systems, Computational Intelligence: Soft Computing and Fuzzy-Neuro Integration with Applications, O Kaynak, LA Zadeh, B Turksen, IJ Rudas (Eds.), pp1-9, 1998. [18] N. S. Philip and K. B. Joseph, Adaptive Basis Function for Artificial Neural Networks, Neurocomputing Journal, 2001. (Accepted for publication). [19] Orr J L M, Introduction to Radial Basis Function Networks, Technical Report, Centre for Cognitive Science, University of Edinburgh, Scotland, 1996. [20] Specht, D.F, "A Generalized Regression Neural Network", IEEE Transactions on Neural Networks, 2, Nov. 1991, 568576, 1991.