JURNAL KEJURUTERAAN AWAM (JOURNAL OF CIVIL ENGINEERING) Vol. 15 No. ... This study deals with Layang River rainfall runoff estimation using.
JURNAL KEJURUTERAAN AWAM (JOURNAL OF CIVIL ENGINEERING) Vol. 15 No. 2, 2002
RAINFALL RUNOFF SIMULATION USING MIKE11 NAM
Supiah Shamsudin, M.Sc Normala Hashim, M.Sc. Faculty of Civil Engineering Universiti Teknologi Malaysia 81300 UTM-Skudai, Johor ABSTRACT Rainfall runoff estimation from a watershed is of vital importance as these values are required in most hydrologic analysis for the purpose of water resources planning. This study deals with Layang River rainfall runoff estimation using MIKE 11 NAM model. The calibration and validation procedures were carried out to provide a satisfactory estimation. The runoff discharges were simulated for a 12-year period (1988-2000). The simulated peak flow occurred in 1992 and 1995 with approximate values of 20.94 m3/s and 18.93 m3/s respectively. The optimum values of the model parameters obtained during the calibration procedure were presented. The reliability of MIKE11 NAM was evaluated based on the Efficiency Index (EI) and Root Mean Square Error (RMSE). The EI and RMSE obtained during this study are 0.75 and 0.08 respectively.
INTRODUCTION Rainfall runoff estimation from a watershed is of vital importance as these values are required in most hydrologic analysis for the purpose of water resources planning, flood forecasting, pollution control and many other applications. Modeling the rainfall-runoff process is a complex activity as it is influenced by a number of implicit and explicit factors such as precipitation distribution, evaporation, transpiration, abstraction, watershed topography, and soil types. The runoff discharges and flow rates at a river sites varies greatly throughout the course of a year, depending on seasonal rainfall, watershed characteristics and many other parameters. These variables greatly increase the modeling effort and time and in turn provides ample opportunities for research endeavors. 0128-0147/98 ©Faculty of Civil Engineering,UTM.
JURNAL KEJURUTERAAN AWAM (JOURNAL OF CIVIL ENGINEERING) Vol. 15 No. 2 2002
Various model have been developed to solve the rainfall runoff relationship in engineering research and practices. The widely known rainfall runoff models identified are the Rational Method (McPherson, 1969), Soil Conservation Service-Curve Number Method (Maidment, 1993), and Green and Ampt Method (Green, 1911). The more complex models which should provide better runoff estimation are continuously being researched and developed. Some of the complex models identified are Genetic Danish MIKE11 NAM (1972). The choice and validity of the model depends on the type of problem, the data availability and the decision to be made. The objective of this study is to estimate the rainfall runoff discharges of Sungai Layang watershed using MIKE11 NAM model. The long term simulation (19882000) was carried out based on the available rainfall and evaporation data. The calibration and validation procedures of the model were carried out to provide a satisfactory estimation. This rainfall runoff study is vital for the purpose of Layang reservoir water quality amelioration.
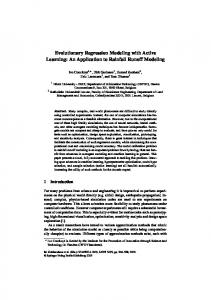
MATERIALS AND METHODS Site Descriptions There are two reservoirs within the Layang catchment area; Upper Layang reservoir and Lower Layang reservoir. Upper Layang resevoir is in Masai, 40km north east of Johor Bahru City. The reservoir is situated in the undulating area and surrounded by hills. The maximum altitude is 160m and minimum altitude is 30m above mean sea level. The Upper Layang catchment is located approximately within the coordinates of 1o30’N and 1o36’N latitudes and 103o50’E and 104o00’E longitudes with an average catchment slope of 1.6%. It constitutes the south-western part of the State of Johor. Upper Layang catchment is one of the major hydrological sources that produce runoff for the reservoir. Sungai Layang is the main river that drains into the reservoir. Lower Layang Reservoir is on the eastern part of the Upper Layang Reservoir. The drainage basin for Hilir Layang Reservoir is 20.5 km2. The total drainage basins for both reservoirs is 50.0 km2. Water outflow from both catchment is about 40 MFD. At the present time, the outflow rate of water from the intake tower to the water treatment plant is 28.5 MGD. These areas are shown in Figure 1. The surrounding tributaries and their activities around the catchment area are summarized in Table 1. 2
JURNAL KEJURUTERAAN AWAM (JOURNAL OF CIVIL ENGINEERING) Vol. 15 No. 2 2002
Table 1 : Summary of Activities Within Sungai Layang Watershed Reservoir
Upper Layang Reservoir
Lower Layang Reservoir
Tributary Kampong Penorogo Felcra Ban Foo
Activities Around The Tributary 50 houses, human waste and chicken breeding Agriculture, chicken and pig breeding
Ladang Plentong Es
Fish farming, illegal houses
Ladang Keck Seng
Commercialized palm tree plantation
Ladang Bukit Layang
Palm tree estate, domestic waste
Ladang Sungai Tiram
Palm tree estate, domestic waste
Figure 1 : Map showing location of Layang River and Reservoirs 3
JURNAL KEJURUTERAAN AWAM (JOURNAL OF CIVIL ENGINEERING) Vol. 15 No. 2 2002
Mike11 NAM MIKE11 NAM model was applied primarily because of its ability to simulate the watershade physical processes in more detail. MIKE11 NAM model is a watershed lumped-parameter model which are highly relevant with this particular watershed under study and the long term flow simulation desired. In addition, it is a complete and effective modeling software with the adds-on module which allows flexibility for future investigation. The MIKE11 was applied because of its availability in the Hydraulic and Hydrology Department, Universiti Teknologi Malaysia. MIKE11 NAM is a professional engineering software package developed by Danish Hydraulic Institute, Denmark. This one-dimensional modeling tool developed since 1972 has been accepted worldwide especially for water resources, water quality planning and management applications (DHI). Specifically the MIKE 11 software is meant for simulation of flows, water quality and sediment transport in estuaries, rivers, irrigation systems, channels and other water bodies. The MIKE11 NAM, the watershed lumped and conceptual rainfall-runoff model regarded watershed as one unit and the conceptual model are based on considerations of the physical processes (Mike 11 User Manual). Data Requirements for the MIKE11 NAM model consist of i) ii) iii) iv)
Setup parameters – catchment area, topography and soil properties. Model parameters – time constants and threshold values for routing of overland flow, interflow and baseflow. Meterological data – precipitation and potential evaporation. Streamflow data fpr the model calibration.
The reliability of the MIKE11 NAM was evaluated based on the Efficiency Index (EI) as described by Nash and Sutcliffe (1970). There were several related studies available for model performance evaluation such as by Aitken (1973) and Fleming (1975). The procedure by Nash and Sutcliffe (1970) had been widely used for the detection of systematic errors with respect to long term simulation. The EI was developed to evaluate the percentage of accuracy or goodness of the simulated values with respect to their observed values. The EI as described by Nash and Sutcliffe (1970) are as follows :
4
JURNAL KEJURUTERAAN AWAM (JOURNAL OF CIVIL ENGINEERING) Vol. 15 No. 2 2002
The Efficiency Index (EI) equal to 1 indicates the best (perfect) performance of the model. Root Mean Square Error (RMSE) method used by Fleming (1975) was another method applied to evaluate the reliability of MIKE11 during this study. This method can be regarded as a measure of absolute error between the computed and observed flows. RMSE values tend to be zero for perfect agreement between observed and simulated values. RMSE is defined as follows :-
5
JURNAL KEJURUTERAAN AWAM (JOURNAL OF CIVIL ENGINEERING) Vol. 15 No. 2 2002
Input Data The rainfall and evaporation data were monitored and gathered by the relevant authorities in Malaysia. The rainfall data applied for MIKE11 was obtained from Drainage and Irrigation Department (DID) Ampang, Kuala Lumpur, while the evaporation data was obtained from the Malaysia Meterological Service (MMS), Petaling Jaya, Selangor. Daily rainfall data for 12-year period 1988 – 2000 for Layang Watershed obtained from DID Station No. 1539301 was applied. There were some missing rainfall and evaporation data observed during this study. The missing data values was treated by applying the Arithmetic Mean Method (Maidment, 1993). The rainfall data from Lim Lim Station, Plentong Station and Tiram Stations were utilized for the missing value estimation using the method above. The related rainfall station used for the study are shown in Table 2 : Table 2 : List of the Station Number Location Plentong Estate, Johor Bahru Tiram Estate, Johor Bahru Lim Lim Estate, Johor Bahru Layang River Water Treatment Plant
Station No. 1538117 1539134 1539136 1539001
Latitude 01o 32’ 05” 01o 35’ 15” 01o 31’ 15” 01o 33’ 25”
Longitude 103o 50’ 40” 103o 55’ 05” 103o 59’ 30” 103o 55’ 30”
The reliability of the rainfall data was tested by double mass curve method (Gupta, 1989) as shown in Figure 2. The straight line graph obtained indicated that the data is consistent. Non straight line graph would appear if the data have been subjected to various changes such as changes in recoding station or shift in observation practices.
6
JURNAL KEJURUTERAAN AWAM (JOURNAL OF CIVIL ENGINEERING) Vol. 15 No. 2 2002
Figure 2 : Rainfall Data Reliability Testing by Double Mass Curve The areal precipitation or the representative precipitation over a defined area was required for the MIKE11 NAM computation. The areal precipitation was computed from point precipitation by Thiessen polygon method (Gupta, 1989). The point precipitation was obtained from the record of a group of rainfall gauges within the area. The percentage weight to denote the degree of influenced of the individual rainfall station over the watershed rainfall was calculated. The percentage weights were obtained by considering the proportion of its representative area. The area obtained for the total Layang watershed area was 33.89 km2. the Layang River sub-watershed area was 4.036 km2. The areal precipitation was computed by multiplying the precipitation at each station and their calculated percentage weight. The percentage weights were used for the Mean Areal Rainfall (MAR) input, in the MIKE11 model. The percentage weights input into the MIKE11 model are shown in Table 3.
Table 3. Weight for MEAN AREAL RAINFALL computation in MIKE 11 Total Area = 33.89 km2 Station A B C
Rainfall Station Layang Water Treatment Plant Plentong Estate Ulu Tiram Estate
Theissen Area (km2) 16.99
Percentage Weight (5) 50
Weight
13.56 3.89
40 10
0.4 0.1
0.5
A weir with a 90o V-notch was constructed for flow measurement for the purpose of model calibration. The weir was constructed according to the British Standard BS 3680: Part 4A: 1981. (Methods of measurement of Liquid Flow – Part 4A. Thin-plate weirs). The site selected for the weir installation (as stated in the BS 3680: Part 4A: 1981) must have a uniform and steady approach channel. The weir was constructed with the crest level height of 0.35m above datum. The weir was constructed from a 10 mm Perspex sheet, put in position with a 7.5 mm diameter, PVC pipe filled with cement. An asphalt sheen was screwed to the bottom part of the weir and laid down in the upstream direction of the river to ensure a acomplete volume of discharges flowing through the weir. The weir was calibrated at the Hydraulics and Hydrology Laboratory to determine the coefficient of discharge (Cd) value which was 0.61. The twelve (12) months (October 1999 – September 2000), flow data observed from the constructed weir was used for the calibration procedure in the MIKE11 NAM model. The daily water level was monitored using the water level recorder SPOHR QP1 of 7
JURNAL KEJURUTERAAN AWAM (JOURNAL OF CIVIL ENGINEERING) Vol. 15 No. 2 2002
Mestechnik, Germany. The water level recorder was established at the stream site, which enables continuous observation of water level. The stage height was set up for the purpose of recording the height of the water surface in a stream above a fix datum. The fornightly check-up is required for the water level recorder.
RESULTS AND DISCUSSIONS The application of MIKE 11 model for rainfall runoff estimation can be divided into two (2) stages. The first stage is the calibration process to determine an optimum values of the model parameters. The second stage is the streamflow simulation using the estimated model parameter during the calibration process. In the calibration procedure, several model parameters have to be adjusted using trial and error to obtain optimum values. These optimum values are considered as the representative coefficient to determine the runoff within the catchment area. Table 4 illustrates the final values of parameters that has been adjusted in the calibration process. Some parameters were highly sensitive to changes as shown in Table 5. The calibration had been carried out using records of daily rainfall and runoff from October 1999 to September 2000. Figure 3 represents the results of simulated and observed flow in the MIKE11 model calibration. Obviously, it can be seen that the MIKE 11 model cannot easily incorporate the peak discharges in the model optimization. The factors that contribute to the calibration inaccuracy are problems in data acquisitions, the nature of rainfall pattern and flood problem. The on site data acquisition problems are the accessibility for regular maintenance and disturbance due to animals in the forest. The nature of rainfall pattern is spatial resulting in an uneven rainfall distribution within the catchment area. This factor directly affect the rainfall-runoff model calibration. The unexpected flood surrounding the gauging site would certainly damage the data acquisition system and reduce the accessibility for observation and maintenance. Flood during March 2000 that occurred within the study site add more missing data and create problem to the calibration process. The problem of missing data was handled by the application of adjustment. The adjustment procedure employ the interpolation and method of proportion in the rainfall-runoff relationship. The flow series are simulated based on the daily rainfall for the 12-year period, 1988 to 2000. Figure 4 demonstrates the simulated daily flow for the Layang Reservoir (1988 – 2000). The simulated peak flow occur in 1992 and 1994 with approximate values are 20.94 m3/s and 18.93 m3/s respectively. The streamflow validation curve from June 1998 to July 1998 is shown in Figure 5. 8
JURNAL KEJURUTERAAN AWAM (JOURNAL OF CIVIL ENGINEERING) Vol. 15 No. 2 2002
Zamri Mohd (2000) obtained maximum simulated runoff values of 30.05 m3/s and 25.5 m3/s in 1992 and 1994 respectively. These values were different from the values obtained during this study probably because their weir was constructed further downstream and affected the watershed size used in MIKE 11 computation. Secondly their weir was located at the flood zone which was experiencing the abrupt change of water level. Table 4 : NAM Parameters for Subcatchment of Layang River NAM Parameter Description Area of catchment Maximum water content in surface storage Maximum water content in root zone storage Overland flow runoff coefficient Time constant for interflow Root zone threshold value for overland flow Root zone threshold value for interflow Degree day coefficient Time constant for routing inter and overland flow GROUNDWATER: Ratio of groundwater catchment area to topographical catchment Root zone threshold value for groundwater recharge Specific yield of groundwater reservoir Time constant for routing baseflow Minimum groundwater depth Maximum groundwater depth causing baseflow Seasonal variation of this depth (Y/N) Groundwater depth for unit capillary flux Change groundwater abstraction data (Y/N)
Parameter Value 4.0 24.0 80.0 0.62 1000 0.1 0.1 0.0 20
1.0 0.1 0.1 1000 0.0 12.0 N 0.0 N
9
JURNAL KEJURUTERAAN AWAM (JOURNAL OF CIVIL ENGINEERING) Vol. 15 No. 2 2002
Figure 3 : Daily Streamflow Calibration Curve (October 1999 – September 2000)
Figure 4 : Daily Streamflow Simulaion Curve (1988 – 2000)
Figure 5 : Streamflow Validation Curve (Jun 1998 – July 1998) 10
JURNAL KEJURUTERAAN AWAM (JOURNAL OF CIVIL ENGINEERING) Vol. 15 No. 2 2002
Table 5 : Effects of Changing Differenct NAM Parameters On Runoff
Lmax
Parameters
Change Increase
Effects Peak runoff decreased Runoff volume reduced
Umax
Increase
Peak runoff decreased Runoff volume reduced
CQOF
Increase
Peak runoff decreased Runoff volume increased
TOF
Increase
Peak runoff decreased Runoff volume reduced
CK1 & CK2
Increase
Peak runoff decreased The triangular shape expand horizontally
CKBF
Increase
Base flow decreased
Maximum groundwater depth causing base flow
Increase
Peak runoff decreased Runoff volume reduced
The reliability of the MIKE11-NAM was evaluated based on the Efficiency Index (EI) as described by Nash and Sutcliffe (1970). The EI was developed to evaluate the percentage of accuracy or goodness of the simulated values with respect to their observed values. An EI equal to 1 indicates the best (perfect) performance of the model. The EI obtained during this study was 0.75. The Root Mean Square Error (RMSE) method used by Fleming (1975) was another method applied to evaluate the reliability of MIKE 11 during this study. This method can be regarded as a measure of absolute error between the computed and observed flows. The RMSE values tend to be zero (O) for perfect agreement between observed and simulated values. The RMSE value obtained during this study was 0.08. More automatic rainfall stations should be made available within the Layang watershen to give a better representation of the mean areal rainfall and so as to achieve better results. At the moment there is only one rainfall station being established at the Layang watershed. The computation for the mean areal rainfall carried out during this study was based on the Tiram and Plentong rainfall 11
JURNAL KEJURUTERAAN AWAM (JOURNAL OF CIVIL ENGINEERING) Vol. 15 No. 2 2002
stations, the closest rainfall stations which are located outside the Layang watershed. More rainfall stations will reflect more accurately the effects of locality differences in the rainfall pattern. The Layang watershed normally experienced an amount of the rainfall which differs with different locality within the same period of time (Tarmizi et.al, 1997).
CONCLUSIONS The rainfall runoff discharges estimation is hoped to contribute in hydrologic and water quality analysis in the future. The rainfall discharges was successfully modeled using MIKE11-NAM during this study. The simulated peak flow discharges occurred in 1992 and 1995 with approximated values of 20.94 m3/s and 18.93 m3/s respectively. A satisfactory and reliable results were obtained with their Efficiency Index and Root Mean Square Error of 0.75 and 0.08 respectively. Better runoff discharges estimation should be obtained if more automatic rainfall stations are made available within the Layang Watershed.
ACKNOWLEDGEMENTS The authors appreciates all the helps obtained from everyone involved, especially for the technicians of UTM-FKA Hydrology Laboratory, Encik Rahim hashim and Encik Ismail Husin for working hard at the site. The authors are also thankful to the Research Management Center (RMC) – Universiti Teknologi Malaysia for the financial support under Vote 71327.
REFERENCES Aitken, A.P. (1973). “Assessing Systematic Errors In Rainfall-runoff Models.” Journal of Hydrology, 20, p 121-136. Fleming, G. (1975). “Computer Simulation Techniques In Hydrology”. Elsevier: New York. Pp 18-53, 239-252. Green, W.H., and G.A. Ampt (1911), “Studies On Soil Physics. 1. The Flow of Air and Water Through Soils.” Journal of Agriculture Science, Vol 4, pp. 1-24. Gupta, Ram. S. (1989). “Hydrology and Hydraulic Systems.” Englewood Cliffs, New Jersey: Prentice Hall. 1st Edition. P 65, 228.
12
JURNAL KEJURUTERAAN AWAM (JOURNAL OF CIVIL ENGINEERING) Vol. 15 No. 2 2002
Liden and Harlin (2000), “Analysis of Conceptual Rainfall-Runoff Modeling Performance In Different Climates.” Journal of Hydrology 238 (2000) pp 231-248. Liong, Shie-Yui (2002), “Genetic Programming: A New Paradigm In Rainfall Runoff Modeling.” Journal of The American Water Resources Association, v38, n3m 2002, p 705-718. Maidment D.R. (1993). “Handbook of Hydrology.” 1st Edition. McGraw Hill, Inc. p3.19.
NewYork.
McPherson, M.B. (1969), “Some notes on the Rational Method of Storm Drain Design”, Tech. Memo. No.6. ASCE, Water Resources Research Program, Harvard University, Cambridge, MA. Nash, J.E. and Sutcliffe, J.V. (1970). River Flow Forecasting Through Conseptual Models, Part 1: A Discussion on Principals. Journal of Hydrology, V10, p 282-290. Tarmizi Ismail, Amir Hashim and Abdullah Al Mamun (1997). “Simulation of Runoff for Ungauged Catchment in Peninsular Malaysia.” Proceeding of Symposium at UNMER Malang, Indonesia. Zamri Mohd (2000). “Rainfall-runoff Model Calibration and Daily Streamflow Simulation For An Ungauged Catchment”. Universiti Teknologi Malasyia. Master Thesis.
13