11510 American Holly Drive, Laurel MD 20708, USA .... ideas using a waterfowl band-recovery data set in which year speci®c survival and recovery ..... Let k t be the reporting probability in year t (i.e. the proportion of dead birds that ..... problems, due to its model-free interpretation (and its convenience is hard to argue).
Journal of Applied Statistics, Vol. 29, N os. 1- 4, 2002, 329- 351
Random eþ ects and shrinkage estim ation in capture- recapture m odels
1
2
1
J. A ND R EW ROYLE & W ILLIA M A. LINK , US Fish and W ildlife Ser vice, 2 Division of M igrator y B ird M anagement and US Geological Sur vey, Patuxent W ildlife Research C enter
abstract
We discuss the analysis of random eþ ects in capture- recapture models, and outline B ayesian and frequentists approaches to their analysis. Under a nor mal model, random eþ ects estimators derived from B ayesian or frequentist considerations have a common for m as shrinkage estimators. We discuss some of the diý culties of analysing random eþ ects using traditional methods, and argue that a B ayesian for mulation provides a rigorou s framework for dealing with these diý culties. In capture- recapture models, random eþ ects may provide a parsimonious compromise between constant and completely time-dependent models for the parameters (e.g. sur vival probability). We consider application of random eþ ects to band-recover y models, although the principles apply to more general situations, such as Cormack- Jolly- Seber models. We illustrate these ideas using a commonly analysed band recover y data set. 1 Introduction Capture- recapture m ethods are widely used in ecology to estim ate im portant attributes of anim al populations including survival, recruitm ent and m ortality rates. M aximum likelihood estim ation of param eters in a conventional `® xed eþ ects’ fram ework, in w hich param eters are regarded as being unknown constants to be estim ated, is standard practice for m ost capture- recapture problem s. T here are m any instances in which one would like to consider using random eþ ects in capture- recapture m odels. First, random eþ ects represent a parsim onious com prom ise between overly sim plistic and more realistic com plex m odels, but which may be diý cult to ® t adequately. For exam ple, ecologists often consider the extrem es of constant survival and year-speci® c survival models. Random eþ ects lead to a ¯ exible class of intermediate m odels. Correspondence: J. A. Royle, US Fish and W ildlife Service, Division of Migratory Bird Managem ent, 11510 American Holly Drive, Laurel M D 20708 , U SA ISSN 0266-476 3 print; 1360-053 2 online/02/010329-2 3 DOI: 10.1080 /02664760 12010874 6
© 200 2 Taylor & Francis Ltd
330
J. A . Royle & W. A . Link
Second, shrinkage estim ation is a natural consequence of a random eþ ects assum ption on a set of param eters. Shrinkage can lead to im proved estim ation (in a m ean-squared error sense) of a collection of param eters, particularly when there is a large num ber of param eters in the m odel; we believe that shrinkage estim ation has great potential for many problem s, especially those involving sm all sam ple sizes and /or highly param eterized m odels. T hird, ecologists are often interested in m odelling `pattern am ong param eters’ , for exam ple, m odelling trend or weather eþ ects in survival rates. T he dependence of parameters on covariates is com m only described using ultra-structural m odels, w hich specify determ inistic relations am ong collections of related parameters. T hus, for instance, a collection of tem porally var ying param eters m ay be reduced to a pair of param eters, a slope and an intercept. This approach, w hile possibly reproducing the correct m arginal m ean structure, often fails adequately to capture variation in the data, leading to overdispersion relative to the m ultinom ial assumption (e.g. Burnham & Anderson, 1998, p. 52). Random eþ ects enable a generalization of ultra-structural m odels that accounts for this departure. Finally, there are m any problem s in which param eters are m ore naturally though t of as being generated from some probability distribution. T hese include m odels w ith spatially or tem porally indexed param eters and m odels for individual heterogeneity. T hese are typical longitudinal data problems of the type that random eþ ects m ethodology was developed to address. As their use for m odelling longitudinal data suggests, random eþ ects m odels are well suited for param eterizing correlation am ong observations. W hile som e eþ ort has gone into the developm ent of likelihood-based random eþ ects m odels for capture- recapture data (e.g. Burnham , 2000), the current treatm ent of this problem is inform al and we feel that a m ore rigorous, m odelbased fram ework is needed. In particular, two im portant issues that arise in random eþ ects models are accounting for uncertainty in estim ation of the param eters of the random eþ ect distribution, and analysis of non-norm al random eþ ects m odels such as the multinom ial model used in capture- recapture settings. T hese are both diý cult problem s w ithin a conventional likelihood-based fram ework. On the other hand, a Bayesian framework naturally deals with these issues in a concise and uni® ed fram ework. T he Bayesian analysis of data on m arked anim als has started to receive considerable attention in the literature with the advent of practical computing m ethods. Two recent examples are Brooks et al. (2000a, b).
1.1 Of eggs and om elettes The distinction between Bayesian and frequentist approaches to dealing with random eþ ects m ay be sum marized with respect to the two de® ning characteristics of the Bayesian paradigm : (1) the treatm ent of param eters as random ; and (2) inference based on the posterior distribution. In this regard, there is an old m etaphor attributed by M orris (1983, rejoinder) to Savage (1961) which refers to considering param eters to be random as `breaking the Bayesian egg’ and posterior inference as `enjoying the om elette’ that results from breaking that egg. M orris sum m arized major statistical theories in term s of the egg m etaphor as follows:
Breaks egg D oes not break egg
Enjoys om elette
D oes not enjoy om elette
Bayesian Fiducialist
Em pirical Bayesian Frequentist
Random eþ ects and shrinkage estimation
331
In practical term s, and in the present context, `enjoying the om elette’ m eans exploiting the Bayesian fram ework to aid in dealing formally with uncertainty in prior param eters and the analysis of non-norm al m odels with random param eters. That is, since all unknowns are treated as random , the m achinery of probability calculus provides a consistent and rigorous fram ework within which to convert likelihoods and priors, to posteriors. In contrast, we w ill see that a frequentist (at least partially) breaks the egg, but because som e param eters rem ain ® xed, and because frequentists do not adopt posterior inference, these two problem s are diý cult. O f the two rem aining cells in this table, ® ducial inference is not relevant to our discussion. On the other hand empirical Bayes (see C arlin & Louis, 1996, ch. 3) has considerable relevance as classical frequentist m ethods for analysing random eþ ects m ay be viewed as such (Laird & Ware, 1982), due to the m anner in which the ® xed param eters are estim ated. We discuss this in Section 3.2. 1.2 Over view In this paper, we provide a general discussion of random eþ ects and associated technical issues within both Bayesian and classical fram eworks. T he ® rst half of this paper is essentially background m aterial, describing various strategies for analysing random eþ ects. Several of these approaches are Frequentist (i.e. treat som e or all of the unobservable quantities as `® xed but unknown’ quantities, and base inference on the distribution of the data given the param eters). We also describe the Bayesian approach, in w hich all unobservable quantities are treated as random variables, and inference is based on the posterior distributions of the param eters given the data. Shrinkage estim ators arise naturally as estim ators of random eþ ects under either paradigm . In the second half of the paper, we address random eþ ects m odels in the context of capture- recapture problem s. In Section 5, we speci® cally deal with random eþ ects in band recovery (or ring recovery) m odels, which are a special case of a m ore general class of capture- recapture m odels. H owever, the essence of the random eþ ects m odelÐ a probability distribution on a collection of param eters such as yearly survival probabilitiesÐ is generally applicable. We illustrate these ideas using a waterfowl band-recovery data set in which year speci® c survival and recover y probabilities are param eterized as normal random eþ ects, on the logit scale. Discussion and conclusions are given in Section 8. 2 Random eþ ects in B ayesian analysis Random eþ ects are standard operating procedure in a Bayesian analysis since typically all param eters are regarded as random variables. T he other im portant characteristic of Bayesian analysis is that inference is based on the conditional distribution of the parameters given the data, a quantity known as the posterior distribution. We will not go into m uch detail on Bayesian analysis here, instead relying on the sim ple norm al- norm al m odel to m ake som e salient points. In particular, random eþ ects provide a bridge between frequentist and Bayesian m ethods, in so far as they produce the sam e estim ators when the param eters of the random eþ ects distribution are known. T hus, we will see that interesting posterior quantities discussed here also arise from frequentist considerations in Section 3. T he im portant point of this section is that, by assum ing that all unknown quantities in a m odel are random , Bayesian analysis is able to exploit sim ple rules
332
J. A . Royle & W. A . Link
of probability calculus in order to provide a uni® ed treatm ent not only of random eþ ects estim ation, but also of prior param eter estim ation and accounting for uncertainty in those estim ates. We require som e term inology and notation. We will use the notation [´] to refer to the `distribution of ´’ , and indicate conditioning with ` ½ ’ ; i.e. the conditional distribution of x given y is [x ½ y]. The nom inal Bayesian model in which we are interested consists of a data m odel (i.e. the likelihood) [ y ½ a , c ], a prior distribution for the param eters a , [ a ½ c ], and perhaps a further prior distribution for the rem aining param eters c , [ c ]. For the purposes of this paper, we suppose that prim ary interest lies in estim ating a (these w ill be the `random eþ ects’ param eters in our m odel). In our developm ent, c will consist of both param eters in the random eþ ects distribution, and additional param eters in the likelihood of y, which are not explicitly accounted for by a . T he posterior distribution of the unknown parameters is then, by Bayes rule, equal to: [y ½ a , c ] [ a ½ c ] [ c ]
[ a c ½ y] 5
(1)
[ y]
where [y] is the m arginal distribution of the data. The nature of the likelihood and prior distributions is obviously problem-speci® c, but the probability m achinery required to com pute the posterior is identical no m atter the precise speci® cation of the likelihood and prior(s) (a subtle but im portant point).
2.1 The normal- normal model Consider the sim ple m odel y t ½ a t ~ N (a t , r 2e ): t 5 , 2, . . . , n with random eþ ects a t assum ed to be N ( l , r 2a ), T hus, c 5 (r 2e , l , r 2a ), and we will assum e that c is known for the tim e being. The derived precision param eters, s a 5 1/r 2a and s e 5 1/r 2e will be convenient in som e expressions. We m ight think of this m odel as applying to data collected over tim e, and thus a t are `year eþ ects’ , y t are yearly sam ple m eans, and our interest is an estimation of the collection of random eþ ects { a t }. T he posterior distribution of a t is proportional to the product of the likelihood and prior, which is easily shown to be: [a t ½ y t ] 5
( (
N l
+
r
r a
2
2
a
+r e
2
)
( yt 2
l ),
2
r
r a a
2
2
r
+r
e e
2
)
(2)
The m ean of this posterior distribution is taken as an estim ator of a t and the posterior variance is then used to assess uncertainty about a t . In general, the posterior is conditional on all data, so we m ight m ore form ally express the posterior as [ a t ½ y 1 , . . . , y n ]. H owever, w ith ® xed c , the posterior of a t depends only on y t . T he posterior m ean is often referred to as a shrinkage estimator, in the sense that the usual estim ator of a t , nam ely y t (i.e. the yearly sam ple mean), is adjusted (or `shrunk’ ) back towards the prior m ean of a t ; if the sam ple m ean is larger than the prior m ean, it is adjusted downward, and if it is smaller than the prior m ean, it is adjusted upward. Clearly, the relative size of `am ong year’ versus `w ithin year’ variation controls the am ount of shrinkage being done via the shrinkage weight 2 2 2 c 5 r a /(r a + r e ). We discuss shrinkage estim ation further in Section 3.3.
Random eþ ects and shrinkage estimation
333
An im portant generalization arises by considering the m odel: y5
Xb
+ Za + e
(3)
where b and a are vectors of param eters and X and Z are known `design’ matrices. The distributional assum ption on a is typically m ade m ore general by allowing the a s to be correlated: a ~ N (0, r 2a D h ), where D h is som e correlation m atrix with param eter h . T he m odel given by (3) form s the basis of the classical linear mixed model (LMM ) (Robinson, 1991) w herein, to a frequentist, b are the `® xed’ param eters and a are the `random eþ ects’ . Typically then, the constant l from (2) would be an elem ent of b and regarded as ® xed. Although Bayesians do not generally entertain the notion of ® xed eþ ects, placing a constant (i.e. uniform ) prior on b has the eþ ect of yielding results that are often consistent with frequentist procedures. Special cases of (3) are comm on throughout statistics, and include the usual random eþ ects AN OVA, repeated m easures AN OVA, spatial m odels that form the basis of kriging (in w hich case D is a spatial variance- covariance m atrix), and m any others. U nder this slightly m ore general form ulation, the posterior distribution of interest (which we om it) is analogous to (2) (see Laird & Ware, 1982). 2.2 Unknown prior parameters Up to now, we have assum ed that c is known. Consequently, the resulting posterior distributions were im plicitly conditional on c . Such posterior distributions are usually called conditional posterior distributions. Although this m ay appear to be a gross sim pli® cation of real problem s, it turns out that conditional posterior distributions play a very im portant role in sim ulation-based analysis of the posterior using M arkov chain M onte Carlo (M CM C ) m ethods (Gilks et al., 1996a). M oreover, it is the m ean of equation (2) that is often used as the frequentist random eþ ects estim ator, although derived from diþ erent considerations as we discuss in Section 3. Frequentist applications, however, suþ er through various (often ad hoc) procedures to estim ate c and account for that uncertainty. In the Bayesian fram ework, when c is unknown, it is endowed w ith a prior distribution, and the rules of probability are applied both to estim ate it, and account for that uncertainty in a rigorous m anner, as we now discuss. If c is unknow n with prior distribution [ c ], then inference about it is based on the marginal posterior distribution [ c ½ y]. This is easily enough com puted in m ost cases using standard m ethods. O ne is often interested in estimation of a , the random eþ ects. Then, focus is on the m arginal posterior distribution, [ a ½ y], which is related to the conditional posterior distribution [ a ½ y, c ] as follows: [ a ½ y] 5
ò [a
½ y, c ] [ c
½ y] d c
(4)
In words, the conditional posterior is averaged over c , weighted according to the posterior distribution of c . This integration problem is often analytically intractable and closed form expressions do not generally exist, even under the nor mal- nor mal model with unknow n variance com ponents. N evertheless, we see from this last expression how the Bayesian approach accom m odates `estim ation uncertainty’ in prior param eters in a very formal fashion. Com putation of interesting features of this m arginal posterior distribution is easily accom plished by sim ulation-based M CM C techniques. O ne useful case is to assum e that l in equation (2) is unknown, but not the
334
J. A . Royle & W. A . Link
variance com ponents. W ith a ¯ at prior on l , the posterior m ean in (2) has yÅ in place of l . T his result also applies with b as in equation (3). Som e diý culty arises when variance com ponents are unknown. In general, a Bayesian analysis sim ply requires application of equation (4) in m ore generality, whereas frequentist approaches are less form al (as discussed in Section 3.2). 2.3 Non-no rmal models The probability calculus employed in Bayesian analysis also facilitates the analysis of random eþ ects in non-norm al m odels. O bviously, in the general relation between likelihood, priors, and posterior, as expressed by equation (1), there is nothing restricting our likelihood to be norm al, nor even our random eþ ects distribution (the prior) to be norm al. M odels involving Poisson, Binom ial, or, in the case of capture- recapture, M ultinom ial likelihoods, with (e.g. norm al) random eþ ects, are com m on in m odern statistical practice. It is alm ost universally the case that these posterior distributions cannot be analysed directly, but with the recent advances m ade in num erical and sim ulation based methods, relevant features of the posterior distribution are easily com puted. Very general M CM C algorithm s (see Gilks et al., 1996a) are easily applied to these problems. For exam ple, the software package BU G S (Spiegelhalter et al., 1996) im plem ents a wide array of M CM C algorithm s for m any com m on classes of statistical m odels. Indeed, BUG S m ay be used to analyse data from studies of m arked anim als as Brooks et al. (2000b) illustrate. 3 Frequentist random eþ ects and shrinkage There are several diþ erent approaches for analysing random eþ ects within the Frequentist paradigm . Although these m ay be perceived as being independent, the resulting random eþ ects estim ator under the normal m odel is a shrinkage estim ator similar to that based on the conditional posterior distribution (that is, w ith ® xed prior param eters). In the subsequent development, we w ill assum e that these prior param eters are ® xed, and discuss unknow n prior param eters in Section 3.2. 3.1 Estimation of random eþ ects There is a rigorous model-based fram ework for random eþ ects estim ation within the frequentist paradigm. This is known as the best unbiased prediction (BUP). T he best unbiased predictor (we will also use the acronym BUP for that, and let the context determ ine its m eaning) is de® ned as the unbiased predictor with m inim um variance (the frequentist convention is to use the term predictor for estimators of random eþ ects, while reserving estimator for ® xed eþ ects). BU P is typically appealed to in time-series and spatial analyses, in w hich inference about future obser vables is of interest; Frequentists are comfortable regarding these quantities as random . It is easy to establish the BUP directly. L et y be one or m ore realizations of a random variable (i.e. data). We w ish to predict som e quantity z based on y (z is typically an unobserved value of y, but could be a random eþ ect in that model for 2 y). T hen, if zÄ ( y) is any function of y, the minim izer of E(z 2 zÄ ( y)) (the m eansquared prediction error) is zà ( y) 5 E[z ½ y]. In addition, E[zà ( y)] 5 EE[z ½ y] 5 E[z] (unbiased). T hus, the BUP is, in general, the conditional expectation of the thing to predict given the data. To a Bayesian, E[z ½ y] is the posterior mean, but clearly it is reasonable without regard to one’ s philosophical beliefs (as the estimator which
Random eþ ects and shrinkage estimation
335
m inim izes the mean squared prediction error). It is also clear that, under the norm al- normal m odel introduced in Section (2.1), the posterior m ean given by equation (2) (with know n c ) is the conditional expectation of a t given the data, and hence the BUP. T hus, despite philosophical diþ erences, frequentist and Bayesian alike m ight agree on the utility of BU P. T he BUP is the `gold standard’ for estim ating random eþ ects in classical statistics. As stated in the Introduction, the de® ning characteristics of the Bayesian paradigm are the treatm ent of param eters as random variables, and conditioning on data (i.e. posterior inference). Clearly both are present BUP-based estim ations of random eþ ects. H owever, the frequentist adoption of BUP retains the `® xed but unknow n’ viewpoint on the prior parameters. T hus, w hile the Bayesian will integrate c from the conditional posterior as discussed in Section 2.2, the frequentist tendency is to use the estimator in its conditional (on c ) form . This leads to som e diý culty in its application, as we discuss in Section 3.2. F inally, the BUP in the norm al- norm al case is linear, and consequently is also the best linear unbiased predictor (BLU P); i.e. optim al within a slightly less restrictive class of estim ators. H owever, in general, the BUP is not linear (i.e. in m ost non-norm al m odels). Also, if we plug-in M LEs for the ® xed param eters (l or m ore generally b ), than the `BU P’ is no longer BUP, but it rem ains BLU P, since the estim ator of the m ean param eters is linear in the data. M odel-free development. Estim ation on the BU P m akes use of distributional assum ptions in so far as it is the conditional expectation under those assum ptions. Alternatively, a m odel-free developm ent proceeds by m inim izing an exp ression referred to as a penalized likelihood, or penalized least-squares criterion. Since this is the classical derivation of random eþ ects estim ators in the linear m ixed model setting (e.g. Laird & Ware, 1982), we adopt the general statem ent of the m odel given in equation (3) for this discussion. The penalized likelihood for the general m odel is: (y 2
Xb 2
Z a ) ¢ s e (y 2
Xb 2
Za )
+s aa
¢ D 2 1a
(5)
D iþ erentiating leads to the so-called mixed-model equations (e.g. see Robinson, 1991), which m ay be solved for b and a . In particular, the random eþ ects estim ator is a conditional posterior m ean, as in (2), but under the m ore general m odel form ulation given by (3). T his penalized least-squares criterion is just a variance weighted sum -of-sq uares, with the eþ ect of forcing the a s to 0 (i.e. shrinking them). T he penalty term a ¢ D 2 1 a can be thought of as a rough ness penalty, which eþ ectively constrains the random eþ ects to be `sm ooth’ . This penalized likelihood m otivation is nice because it uni® es a wide array of statistical procedures including thin-plate splines, kriging, ridge regression, m ixed m odels, and others (for som e perspective on this, see N ychka, 1998). Although the constrained optim ization device provides a nonparam etric justi® cation for m any techniques, it was originally justi® ed inform ally from norm al likelihood considerations (Henderson, 1950). D iscussion of these various derivations can be found in Robinson (1991). A sim ilar distribution-free derivation of random eþ ects estim ators proceeds by explicitly minim izing the mean squared prediction error among linear predictors. This is m ore com m on in spatial statistics, for developm ent of kriging estim ators (for an exam ple of this, see C ressie, 1991, p. 123). Burnham (2000) also presents that developm ent.
336
J. A . Royle & W. A . Link
T hus, while frequentist random eþ ects estim ation m ay be given a form al m odelbased developm ent as a conditional expectation, estim ators m ay also be derived within a `distribution-free’ fram ework (i.e. the solution to an optim ization problem ). Under the norm al m odel with known variance components, the random eþ ects estim ator has a close correspondence to the m ean of the (conditional) posterior in a Bayesian analysis. Unbiased? The random eþ ect estimator is often called the Best Linear Unbiased Predictor, but this is som ewhat m isleading. Strictly speaking, unbiased here m eans in a m arginal sense, so that E[a à t ½ l ] 5 l + cE[ y t 2 l ] 5 l + c0 5 l 5 E[a t ½ l ]. T his is not the same as E[ a Ä t ½ a t ] 5 a t, which is the usual interpretation of an unbiased estim ator. C learly, E [ a à t ½ a t ] 5 l + cE[ y t ½ a t ] ¹ a t unless c 5 1. Thus, we see that the shrinkage estim ator is, in fact, conditionally biased. This is generally the case for shrinkage estim ators. M any statistical procedures accom m odate a sm all am ount of bias, in exchange for producing better estim ators in term s of m ean-squared error. This concept of a `bias /variance trade-oþ ’ appears in sm oothing m ethods (e.g. Hastie & T ibshirani, 1990), m odel selection (e.g. Burnham & Anderson, 1998, p. 23), and elsew here. 3.2 Variance component estimation In estimation of random eþ ects, we have assum ed that variance com ponents 2 2 a , r e are known. Form ally, estim ation of variance com ponents usually proceeds by m axim izing the m arginal likelihood of y (that is, integrating the random eþ ects from the conditional likelihood). Typically then, these estim ates are used in the known-variance expressions arising from solving the m ixed m odel equations, BU P considerations, etc. T his has led to the terminology, `plug-in’ estim ator, which is also often called the estimated best linear unbiased predictor, or EBLUP. T he sam e approach also applies to estim ation of other param eters in the speci® cation of the random eþ ects distribution. For exam ple, one could assum e that the random eþ ects are correlated (the usual context in spatial statistics). T hat is, Var( a ) 5 2 r a D h where D h is a correlation m atrix with param eter h . To illustrate, consider the following norm al- norm al m odel:
r
y½ a
~
2 y
N ormal(Z a , r
I)
and
a ~ N orm al( l 1, r a
2
Dh )
where Z is a design m atrix as in (3). Then, the m arginal distribution of y is: y
~
N ormal(l 1, r
2 y
ZZ ¢
+r a
2
Dh )
The m ultivariate normal likelihood m ay be m axim ized to obtain estimates of c 5 ( l ,r 2y ,r 2a ,h ). T hese may then be used in the known- c expression for a à , obtained by minim izing the penalized least-squares criterion. This is essentially the empirical Bayes approach to estim ating prior param eters (Laird & Ware, 1982; Carlin & Louis, 1996, ch. 3). T here has been m uch discussion of this plug-in procedure (for discussion and references, see Laird & Ware, 1982; C hristensen, 1991, p. 276; Robinson, 1991; Handcock & Stein, 1993), m ost having to do with the failure of this procedure properly to account for uncertainty associated w ith the variance component estim a-
Random eþ ects and shrinkage estimation
337
tion in the variance of the prediction. T hus, the exp ected value of the estimated variance of the plug-in predictor w ill tend to be sm aller than its true variance (which m ust be greater than the variance of the BL UP, by de® nition). N evertheless, use of plug-in predictors is often justi® ed as reasonable based on results by Kackar and Harville (1981) showing the plug-in predictor to be unbiased, apparently neglecting the fact that we prim arily do statistics on the basis of our ability to quantify uncertainty. F requentists have proposed various corrections to account for estimation of the prior param eters (e.g. K ackar & H arville, 1984; Louis, 1984; Laird & Louis, 1987; Link & H ahn, 1996. However, we believe that the Bayesian paradigm provides a m uch m ore consistent approach to dealing with this issue, as was discussed in Section 2.
3.3 James- Stein shrinkage Shrinkage estim ators arise through out statistics, and we have seen that they arise as a consequence of random eþ ects estim ation (or prediction) under either Bayesian or frequentist considerations. Such estim ators have the desirable property that they perform better in a m ean squared error sense, for estim ating a collection of param eters. In fact, the frequentist random eþ ects estim ator is typically developed explicitly to minim ize the m ean squared prediction error. Consequently, shrinkage estim ators tend to be (conditionally) biased, and m ay not possess a smaller variance than traditional com ponent-wise estim ators. T here is another im portant, `true frequentist’ derivation that leads to essentially the sam e estim ator as that based on the conditional posterior m ean, or from BU P considerations. T his is known as Jam es- Stein estim ation, and is presented here for historical interest, and also because the m ain result of Stein (1955) provides the prim ary frequentist justi® cation for shrinkage (i.e. not dependent on assum ing param eters to be random ). We em phasize that the James- Stein theory does not provide a fram ework for the analysis of random eþ ects m odels (indeed, it is wholly unrelated to anything having to do with random eþ ects, hence our labelling it a `true frequentist’ approach). Instead, it m erely m otivates interest in shrinkage estim ation. As before, assum e that y t ½ a t ~ N (a t , r 2e ) for t 5 1, 2, . . ., p, with r e2 known. W ith no additional m odel structure im posed am ong the a t , Stein (1955) showed that if p > 3, then the obvious estim ator of the m ultivariate norm al m ean (i.e. the sample m eans) is inadm issable under m ean-squared-error loss. Put another way, Stein showed that there exists an estim ator that is uniform ly better than the usual sam ple m ean. W hile Stein did not provide such an estimator, this led to the well-known Jam es- Stein estim ator of a t ( Jam es & Stein, 1961):
aÃ
js t
5
(
12
(p 2
2)r R y
2 t
e
2
)
yÅ t
This estim ator looks like the posterior m ean in (2), but w ith l 5 0, and using a reasonable estim ate for the `total’ variance, r 2e + r 2a . To see this, note that r 2a /(r 2a + r 2e ) 5 1 2 r 2e /(r 2a + r 2e ), and further note that ( p 2 2) /( R y 2t ) is unbiased for 1/(r 2a + r 2e ) under a norm al m odel. T hus, James & Stein seem to have proposed shrinkage towards 0 as a generally better estim ator than the usual sam ple m ean! An obvious extension of this is to
338
J. A . Royle & W. A . Link
shrink towards som ething other than 0, such as the `overall’ m ean (Efron & M orris, 1975), i.e. the m ean of the sam ple m eans y t . Casella & Berger (1990, pp. 495 500) is a good introductory reference on `Stein’ s Paradox’ , Stein estim ation, and related issues. Carlin & Louis (1996, pp. 84 - 85) discuss Stein estim ation in the context of empirical Bayes procedures. N ote that the Jam es- Stein estim ator is `model-free’ in the sense that there are no distributional assum ptions imposed on a tÐ it is not even random ! W hat’ s m ore troubling is that there is nothing about the problem that requires that the y t even be of the same `type’ of variable. For exam ple, why not apply shrinkage to batting averages and pork belly prices (Efron & M orris, 1997)? T his is in contrast to the linear m ixed m odel developm ent, in which the a j are assum ed to be random , typically normally distributed random variables. Because they are assumed to be generated from a common distribution, this would seem to m itigate concerns about com bining batting averages and pork bellies. These ideas were concisely articulated by Robinson (1991): [T he work by Stein (1955)] . . . has led to som e theoretical work that I believe to be of little practical value. T his work is characterized by a tendency to com bine unrelated estimation problem s. BLUP helps us to know when to com bine estim ation problem s. Situations where estimation problem s ought to be com bined are when the param eters to be estimated can be regarded as coming from som e distribution. Equivalently, they are `exchangeable’ , or are `random eþ ects’ . And so, batting averages and pork bellies ought not be related to each other, and hence should not be com bined into a joint estim ation problem . T hat is, shrinkage only m akes sense given a random eþ ects model, and there is little rational basis for one applying to both pork bellies and batting averages. 4 Synthesis W hile we have given essentially a frequentist treatm ent of random eþ ects estim ation in Section 3, there are distinctly Bayesian aspects to that development. C learly, the treatm ent of param eters as being random is inherently Bayesian (`breaking the egg’ ). In addition, consideration of the BU P approach invokes an explicit conditioning on data (`eating the om elette’ ). Indeed, under a norm al- norm al m odel, either penalized likelihood or BUP considerations yield estim ators that are equivalent to that based on the conditional posterior distribution; i.e. with know n prior param eters. Thus, despite philosophical diþ erences between the Bayesian and frequentist schools of thought, there seems to be a correspondence between their respective solutions in normal random eþ ects m odels. H ow then are the Bayesian and frequentist approaches diþ erent with respect to random eþ ects? The diþ erence lies prim arily in the way that c is dealt w ith. In essence, frequentist shrinkage is Bayesian, with know n c . Frequentists m ost often use so-called `plug-in’ predictors and estim ators. Bayesian use standard probability calculus and average over the posterior distribution of c . Thus, we feel that Bayesian analysis provides a m ore rigorous fram ework for accounting for uncertainty in param eter estim ation. Aside from the more form al treatm ent of c that Bayesian analysis perm its, Bayesian analysis of random eþ ects allows one to entertain m uch m ore com plex m odels (e.g. non-norm al) while not having to worry about how to derive estim ators,
Random eþ ects and shrinkage estimation
339
since very general sim ulation-based (i.e. MC M C) algorithm s are easy to adapt to com plex problem s. The key to Bayesian analysis of random eþ ects is that one m ust only be able to com pute the posterior distribution of the quantity of interest (the particular random eþ ect), under w hatever distribution is appropriate. T his leads us to consideration of capture- recapture problem s in w hich the likelihood is m ultinom ial. 5 M odels for band-recovery data The ® eld of capture- recapture encom passes a broad class of m odels for analysing data from m arked anim als and even a brief introduction is beyond the scope of this paper. O ur prim ar y interest is in band-recovery m odels, (in w hich there are no form al recaptures) which are a special case of the m ore general Cormack- JollySeber (C JS) m odels (e.g. Lebreton et al., 1992). We will brie¯ y review the basic structure of band recovery models here (e.g. Brownie et al., 1985). Ideas pertaining to random eþ ects in band recovery m odels, w hich we w ill develop shortly, also apply to m ore general capture- recapture m odels. T he com m on thread is that all of these m odels contain a collection of sur vival and capture probability param etersÐ the presence of recaptures is generally dealt with trivially. 5.1 M odel structure Band-recover y data may be conveniently sum m arized in term s of a recover y matrix containing the num ber of band recoveries over tim e. For exam ple: Year Cohort N bands 1 2 3 ´ ´ ´ T
N1 N2 N3
1
2
3
´
´
´
´
´
T
n11
n1 2 n2 2
n 13 n2 3 n3 3
´ ´ ´ ´
´ ´ ´ ´ ´
´ ´ ´ ´ ´ ´
´ ´ ´ ´ ´ ´
´ ´ ´ ´ ´ ´
n 1T n 2T n 3T
NT
nTT
In this table, N i is the num ber of birds banded in year i (say, cohort i) and n ij is the num ber of bands recovered from cohort i in year j. In waterfowl applications (such as ours), recoveries are bands returned as a result of hunting activity in year j, although there m ay be form al recaptures (these are sim ply m oved to the next row of the table and treated as initial releases). T he usual assum ption is that the vector of recoveries from each cohort is a m ultinom ial random variable, and that the cohorts are independent of one another. For exam ple, for cohort 1 we assum e that (n 11 , n 12 , . . ., n 1T , N 1 2
R n 1j )
~
M N (p
11
,p
12
, . . ., p
1T
,1 2
R p
1j
, N1)
where p i j is the probability that a band from cohort i is recovered in year j. We will employ the conventional shorthand notation [n i ½ p i , N i ] to represent this distribution. Assum ing conditional independence am ong cohorts, the joint likelihood is m erely the product of T such m ultinom ial likelihoods: T
[n ½ p , N] 5
* i5
M N (n i ½ p i , N i ) 1
340
J. A . Royle & W. A . Link
Typically, the p i j s are not of direct interest. Instead, they are assum ed to be functions of m ore relevant param eters such as sur vival and reporting probabilities. Let k t be the reporting probability in year t (i.e. the proportion of dead birds that get reported), and u t be the sur vival probability (the probability that a bird alive at time t survives to tim e t + 1). Then, the exp ected m ultinom ial cell frequencies may be expressed as: E[n 11 ] 5
N1p
11
5
N 1 (1 2
E[n 12 ] 5
N1p
12
5
N1u
E[n 13 ] 5
N1p
13
5
u
(1 2
1
N1p
´
´
´
´
´
´
´
´
´
´
1T
u
1 2
)k
2
´
( ) T2
E [n 1T ] 5
)k
1
5
N1
1
*
t5
u
t
(1 2
u
T
)k
T
1
T hus, the m ultinom ial cell probabilities are p 11 5 (1 2 u 1 ) k 1 , etc. O ne feature of these full year-dependent m odels is that u T and k T are confounded (see Seber, 1982, p. 241), so that only their product m ay be estim ated. Consequently, the m odel contains 2T 2 1 param eters, when the num ber of recovery years is equal to the num ber of cohorts. It is a sim ple m atter to compute m axim um likelihood estim ates using standard software packages such as MARK (W hite & Burnham , 1999).
5.2 A posteriori shrinkage of estimates O ne m ight consider BL UP-like shrinkage applied to a collection of M LEs, say u à 1 , u à 2 , . . ., u à T 2 1 (recall that there are only T 2 1 estim able sur vival param eters). If we specify the data m odel as:
u à t ~ N (l h , r
2
u
)
then we are naturally led to consider the estim ator (Burnham , 2000):
uÄ t 5 là u
+ r
r u
2
2
u
+r
2
(u Ã
t
2
là u )
(6)
e
2 2 where r u 5 Var( u t ) and r e is the sam pling variance and l à u is the sample m ean of Ãu t . T his, of course, mimics the conditional posterior mean in (2), or the BLUP (using an estim ate of l u ). Recall too that one m ay justify this without invoking a norm al assum ption. Burnham (2000) also considered another form of shrinkage estim ator, where the shrinkage weight in equation (6) is replaced by its squareroot. See Burnham (2000) for m otivation of this form of shrinkage. The software package M ARK (W hite & Burnham , 1999) im plem ents this BLUP-like shrinkage based on M LEs. To estim ate variance com ponents, one m ight use a num ber of reasonable choices in a `plug-in’ type estim ator. Precisely which estim ator to use in the plug-in procedure is a com plex issue, since the obvious choice, nam ely the M LE based on
Random eþ ects and shrinkage estimation
341
the m arginal distribution of the data, is diý cult to compute (we illustrate this in Section 6.3), since the likelihood is multinom ial, leading to a com plex integration problem . Burnham (2000) suggests using mom ent estimators, or M LEs com puted by regarding the u à s as `data’ . H e also suggests accounting for sam pling covariance 2 in the u à s, replacing r e with a variance- covariance m atrix, and applying the m atrix equivalent of equation (6). In addition to some diý culty in estim ation of prior param eters under this approach, it is unclear how to accom modate uncertainty associated with that estim ation process, w hich m ay be particularly im portant in sm all sam ple problem s. T his BLU P-like shrinkage approach m ay lead to reasonable answers, particularly if sample sizes are large. H owever, it is relatively straightforward to ® t random eþ ects m odels more form ally within the m ultinom ial fram ework, thus negating issues of prior parameter estimation and uncertainty. 6 B ayesian analysis of band-recover y data Bayesian analysis of capture- recapture data, and band recovery data in particular, has been addressed by G eorge & Robert (1992), Vounatsou & Sm ith (1995), D upuis (1995) and recently by C havez-D emoulin (1999) and Brooks et al. (2000a,b). C onsequently, we do not feel it necessary to provide in-depth technical detail here. Instead, we present a brief overview, and refer the interested reader to the aforem entioned references for further inform ation, and com putational details. T he ® rst stage of the Bayesian m odel consists of the m ultinom ial m odel given in Section 5 (i.e. the likelihood). The distinction between Bayes and classical m odelling approaches is that the Bayesian m odel requires prior distributions for u and k , say [ u ½ c ] and [ k ½ c ], w hich depend on param eters c . Since survival and recovery param eters are probabilities, it is natural to m odel them on the logit scale. In the simplest random eþ ects case, we assume that: logit( u
)5 a
t
t
logit( k t ) 5 c
and
t
where a t is the sur vival `year eþ ect’ and c t is the reporting rate year eþ ect. O ne way to param eterize the random eþ ects is to assum e they are norm ally distributed:
a
t
~
N (l u
,r u
2
)
and
c
t
~
N (l k
,r k
2
)
(7)
O bviously, these m odels could be considerably m ore general, perhaps including covariates in the m ean, etc. In this regard, we believe that it is m ost natural to param eterize variation in survival and recover y rate param eters on the logit scale (as in logistic regression). N ote that if one desires estimates on the probability scale, that is u t 5 exp it(a t ) where exp it(x) 5 exp(x) (1 + exp (x)), then this can be com puted directly from the M CM C output for a t as we discuss below. Instead of the logit param eterization, a Beta distribution on u t and k t also seems reasonable. We discuss this further in Section 6.2. We now require prior distributions on the m ean and variance param eters in the prior distributions given in (7) (i.e. c in our previous notation). C om m on noninform ative priors for the mean parameters are N orm al distributions with m ean 0 and large variance (say 1000). For variance com ponents, inverse-Gam m a priors are used. Equivalently, assign Gam m a(a,b) priors to the precisions (i.e. the inverse of the variances). O ne m ay reasonably specify non-inform ative priors by ® xing a and b to be sm all, say 0.01 (using the comm on param eterization in Gelm an et al., 1995).
342
J. A . Royle & W. A . Link
To accom m odate the confounding of u T and k T in a Bayesian analysis, we could ® x one or the other, say u T 5 1, and then specify a prior distribution for the rem aining param eter (e.g. a reasonably non-inform ative prior is logit( k T ) ~ N (0,10)). T his acknowledges that it is distinct from those that are assigned the random eþ ects distribution (in essence, this Tth param eter is a pork belly, whereas the rem aining are batting averages). O ne m ight also consider placing a uniform prior on the product u T k T . We seek to describe features of the m arginal posterior distributions: [ a ½ n] µ [n ½ a , c ] [ a ½ c ] [ c ] and [ c ½ n] µ [n ½ a , c ] [ c ½ c ] [ c ] which are products of the m ultinom ial likelihood, norm al random eþ ects distribution, and various prior distributions speci® ed for c . These posterior distributions m ay be analysed using M CM C techniques, as illustrated by Vounatsou & Sm ith (1995), and Brooks et al. (2000a,b). Gilks et al. (1996a) is a good general reference. The details behind M C MC are beyond the scope of this paper, but MC M C for the analyses reported on in the following sections is ver y easy to implem ent. We give a brief sketch of the algorithm we employed. O ne form of M CM C, known as com ponent-wise M etropolis- Hastings, involves sam pling from the full-conditional distribution of each param eter using the M etropolis- H astings algorithm (G ilks et al., 1996b). For exam ple, the full conditional distribution for the ® rst survival year eþ ect, a 1 , is the product of the m ultinom ial likelihood w ith the normal prior distribution: [a
1½
´] µ [n ½ a , c ] [ a
1½
c ]
(8)
The param eter a 1 does not appear in any of the expected cell frequencies beyond those of banding cohort 1, and so this reduces to: [a
1½
´] µ [n 1 ½ a , c ] [a
1½
c ]
(9)
where n 1 is the vector of returns for the ® rst banding cohort. As it turns out, this distribution is not of a convenient form from which to sample, but use of M etropolis- H astings is relatively sim ple and straightforward. T his proceeds by drawing a candidate value from som e proposal distribution, and accepting that value with som e prescribed probability as described in G ilks et al. (1996b). T he whole set of full conditionals (one for each unknown, including the recovery rate param eters) is sampled from m any tim es. T he resulting output is then used to estim ate features of the relevant posterior distribution. For exam ple, the m ean of [ a 1 ½ n] is estim ated with the m ean of the posterior sim ulated values of a 1 generated from the M CM C algorithm . O ne nice aspect of M CM C is that posterior quantities of a function of m odel param eters m ay be estim ated by applying that function to the M CM C sam ples. For exam ple, the posterior m ean of u 1 m ay be estim ated as (m) (m) the m ean of expit(a 1 ): m 5 1, 2, . . ., M where a 1 is the mth sim ulated value of a 1 . T here are m any technical issues having to do with assessing convergence, choosing reasonable proposal distributions, starting values, etc. We are not concerned with these here, although they are im portant in any analysis. The interested reader should consult G ilks et al. (1996a) for details. Although we did our own program m ing for the analyses presented in Section 7, we were also able to duplicate our results using the software package BU G S
Random eþ ects and shrinkage estimation
343
(Spiegelhalter et al., 1996) quite easily. Although there are m any ways to im plem ent these m odels in BUG S, the m ost straightforward is to write out the expected cell frequencies directly, which can be easily m echanized for general problem s. Consequently, the reader fam iliar with standard packages (e.g. SURVIV ), which operate in this manner, should have little diý culty im plem enting them in BU GS. 6.1 M odel selection and assessment M odel selection and assessm ent are of great practical im portance in any application. Biologists often rely on AIC (Burnham & Anderson, 1998) to choose the best m odel from am ong several com peting m odels. AIC is sim ple to im plem ent and widely understood and accepted am ong biologists. O n the other hand, Bayesian ideas such as Bayes factors and Bayesian m odel-averaging are not so easily im plem ented in com plex m odels, and are unfam iliar to practitioners. Brooks et al. (2000b) discuss som e of these ideas in the context of m odelling anim al survival. O ne tool that shows promise towards sim plifying Bayesian m odel selection is the D eviance Inform ation C riterion (DIC), proposed by Spiegelhalter et al. (1998). Essentially, a Bayesian version of AIC, the D IC is easy to com pute in most problem s using standard M C MC output. T he D IC is based on the posterior distribution of m inus tw ice the log-likelihood (i.e. Bayesian deviance): D ( u ,k ) 5
2
2 log[n ½ u , k ]
D enote the posterior mean of this quantity as DÅ ( u , k ), which is easy enough to com (m) pute from the M CM C output (retaining the sim ulated values of u (m) 5 expit(a t ) t (m) (m) and k t 5 expit( k t )). In addition to this measure of m odel ® t, we require som e m easure of m odel com plexity. Spiegelhalter et al. (1998) de® ne the eþ ective num ber of param eters as pD 5
Å 2 D
D (u Å ,k Å )
(10)
where D( u Å , k Å ) is m inus twice the log-likelihood evaluated at the posterior m eans of u and k . T hey then de® ne the D IC as D IC 5
D( u Å , k Å )
+ 2p D
which may be applied in a m anner analogous to AIC (i.e. sm all values are better than large values). Spiegelhalter et al. (1998) provide the decision-theoretic justi® cation for use of the D IC. Another particularly sim ple tool for model assessm ent, is the B ayesian p-value. The basic idea is to com pare the distribution of som e ® t statistic computed from the data to that from simulated data under the model. Sim ilar distributions (a pvalue near 0.5) suggests consistency of the data w ith that model. Extreme values suggest otherw ise. W hile we provide both D IC and Bayesian p-value results in our analysis below, we refer the interested reader to Brooks et al. (2000b) for details on com putation of Bayesian p-values. We followed the approach outlined by them for our analysis. 6.2 On prior distributions The Beta model is appealing for capture- recapture problem s since the sur vival and recovery parameters are probabilities. Thus, we m ight assum e u t ~ Beta(a,b) (Burnham & O verton, 1978; G eorge & Robert, 1992). O f course, one would
344
J. A . Royle & W. A . Link
generally desire prior distributions on a and b, and it is unclear how those may be chosen in general and, in particular, in a m anner that facilitates modelling covariate eþ ects (one bene® t of the logit-norm al param eterization). O ne possibility is to param eterize covariate eþ ects in the m ean, a /(a + b), perhaps on the logit scale. A prior distribution for the variance, or surrogate (such as a + b, the precision) is also needed. We feel that there is generally less diý culty in modelling the prior param eters using the logit-norm al m odel. In particular, m odelling covariates is straightforward. For example, in addition to random year eþ ects, survival m ight be param eterized to depend on one or more environm ental covariates, x 1t , x 2t , . . ., x pt as: logit( u
t
)5 a
t
+
p
+ k5
b
k
x kt
1
T here are other considerations that m otivate consideration of the logit-norm al m odel. O ne im portant one is that it is easily generalized to m any types of problem s m aking use of a m ultivariate normal assum ption on random eþ ects. One application that we have investigated is the ® tting of m ultispecies m odels w herein u kt is the survival probability of species k in year t. Then, de® ning logit( u kt ) 5 a kt , and a t 5 (a 1t , a 2t , . . ., a Kt ), one m ay consider interspecies correlations by assum ing:
a
t
~
N (l , R )
Various param eterizations of R can be em ployed, either suggested by biology, or perhaps chosen from am ong standard param etric fam ilies. Such m odels m ay have applications in estimation of survival and other vital rates for rare species, when it is easier to m ark one or m ore abundant species that m ay be related in terms of their variation in m odel param eters. Also, this m odel m ay m ake it feasible to exploit sparse banding databases that have been largely untapped for reasons of data scarcity (e.g. the vast banding record which results from US Fish and W ildlife Service banding activity). In essence, inform ation on poorly sampled species is `borrowed’ from m ore abundance species. Sim ilar models for param eterizing dependence among k and u , and even a generalized cohort m odel, with dependence am ong sexes and age classes, m ay be employed. One other obvious extension is to accom modate autocorrelation am ong the year eþ ects, perhaps by assum ing that the a t behave according to an autoregressive process.
6.3 B est unbiased prediction using M CM C O ne could argue that the BLU P is reasonable for arbitrary (i.e. non-norm al) problem s, due to its m odel-free interpretation (and its convenience is hard to argue). N evertheless, one m ight hope to construct better estim ators in nonnorm al problem s by em ploying the appropriate distributional assum ptions (e.g. m ultinom ial), particularly in small-sam ple problems, wherein no sense of norm ality (asym ptotic, approxim ate, or otherwise) is reasonable. In particular, one m ight consider attem pting to compute the BUP and, follow ing the ideas of Section 3.2, use a `plug-in’ procedure, w hereby estim ates of prior parameters c are used in the known- c expressions. As before, let [ y ½ a , c ] be the likelihood of data, y given random eþ ects a , and param eters c ; and, let [ a ½ c ] be the random eþ ects distribution. Assum ing that c
Random eþ ects and shrinkage estimation
345
is known, the distribution of [ a ½ y, c ] (i.e. the conditional posterior distribution, to a Bayesian), is [ a ½ y, c ] 5
[y ½ a , c ] [ a ½ c ] [y ½ c ]
where [ y ½ c ] is the m arginal distribution of the data. Then, following the frequentist fram ework for estim ating random eþ ects, our estim ator of a is taken as the m ean of this distribution (i.e. the BU P) but w ith a reasonable estim ate in place of c (i.e. the Estim ated BUP, or EBU P). Unfortunately, under the m ultinom ial m odel, known- c expressions are unattainable. H owever, one m ay evaluate the plug-in BU P indirectly, using MC M C, as we now explain. To com pute the EBU P, we ® rst require an estim ator of c . T he m ost obvious estim ator of c is the M LE based on the m arginal distribution [ y ½ c ]. An adequate approxim ately to the true M LE, m ay be obtained as the m arginal posterior m odes (i.e. for each elem ent) under a Bayesian model with ¯ at priors on the elem ents of c . Thus, a is integrated out of the likelihood using M C M C. Although m arginal m odes are not precisely the M LEs, for low-dim ensional c they tend to be similar (the point of this exercise is not to com pute M LEs but to attem pt BUP, and so we will neglect this m inor detail). T hen, to com pute the EBU P, we ® x those param eters at their estim ated values and rerun the M CM C algorithm to yield estim ates of the posterior m eans say, [a 1 ½ n, c 5 c (mle)]. In essence, this is a plug-in empirical Bayes procedureÐ m axim um likelihood estim ation on prior param eters, followed by com putation of the best unbiased predictor of the random eþ ects by M CM C simulation. Consequently, this approach is entirely analogous to the usual, frequentist approach of estimating random eþ ects, which was described in Section 3, except that now we are working in the context of a non-norm al m odel, and estim ating parameters (and predicting) using MC M C. We see the diý culty in attempting to retain frequentist notions (i.e. `® xed’ prior param eters) in com plex problem s. W hile still failing to account for prior param eter uncertainty, we are faced with two computationally demanding exercisesÐ com putation of c à , and computation of the random eþ ects estim ates. O f course, a sim pler uni® ed treatm ent of the whole problem arises when a fully Bayesian fram ework is adopted. H owever, our outlining this approach is intended to demonstrate the im pact of failing to account for prior param eter uncertainty. We will com pare results com puted under this approach to m ore form ally Bayesian and frequentist procedures in Section 7.
7 Illustration: m allards from the San Luis Valley We consider random eþ ects m odels for year-speci® c sur vival and reporting rates, using band recovery data from adult m ale m allards banded in the San Luis Valley, CO (taken from Brow nie et al., 1985, Exam ple 2.2a). T here are 9 years of recoveries from 9 years of banding activity. In addition to the random eþ ects model structure, we consider several other potential m odels in order to evaluate the utility of the random eþ ects structure. In particular, we considered the sequence of m odels as follow s (in order of increasing complexity, or number of parameters): M odel 0: M odel 1: M odel 2a:
Constant u and k . Random eþ ects m odel on both logit( u t ) and logit( k t ). Random eþ ects m odel on logit( k t ), ¯ at priors on logit( u
t
).
346
J. A . Royle & W. A . Link
M odel 2b: M odel 3:
F lat priors on logit( k t ), random eþ ects on logit( u Flat priors on both logit( u t ) and logit( k t ).
t
).
For the m odels containing random eþ ects structure, the prior distributions were speci® ed according to (7). T hus, for M odel 1, our parameters of interest are the vectors k and u , which consist of eight reporting-rate and eight survival-rate param eters, respectively. D ue to the random eþ ects structure, this m odel is expected to have fewer than 17 param eters (see Section 6.1). Also recall that the m odel contains an additional param eter consisting of the product of the last reporting and sur vival rates. Although present in the m odel, we om it details concerning that param eter from the following discussion of results. In a classical setting, the full year-dependent m odel would contain 17 param eters. To evaluate m odels m ore com plex than that im plied by the random eþ ects structure, we assigned ¯ at priors to u and /or k . For exam ple, we m ight expect a ¯ at prior on u t to correspond to a m odel w ith eight survival param eters. Flat priors on both u t and k t would produce the full 17 param eter m odel. Estim ation was by M CM C as outlined in Section 6. Bayesian deviance and pvalues (see Section 6.1) were com puted from the MC M C output. These are show n in Table 1. C onvergence is always an issue in analyses based on M CM C. Based on the G elm an- Rubin (G R) convergence statistic (Brooks & G elm an, 1998), we generally observed rapid convergence except for M odel 3. For this m odel, the M arkov Chains for the reporting rate param eters were particularly ill-behaved, exhibiting very strong autocorrelation. H owever, the G R statistic did seem to indicate eventual convergence. To investigate this further, we exp lored other prior speci® cations (including highly inform ative ones), with only slight improvem ent. O ne consequence of this poor convergence for M odel 3 is that the m easure of D IC m odel com plexity, estim ated according to (10), was negative. C onsequently, in calculation of the D IC, we used an eþ ective num ber of param eters for this m odel of 17. T he results of Table 1 suggest that the three shrinkage models (1, 2a and 2b) are generally preferred, although there is certainly some am biguity in the results, particularly among those three m odels. O wing to the non-linear nature of the m odel, shrinkage on one com ponent induces som e structure (shrinkage) on the other com ponent, perhaps explaining the equivalent complexity of 1 and 2b, and the general sim ilarity among all three random eþ ects m odels. T he eþ ective num ber of param eters for M odel 0 was estim ated to be 3.51, which is considerably larger than the nom inal number of parameters expected (i.e. 2). Subsequently, we will focus on estim ates based on Model 1 to m ake a couple of salient points. Since analysis of the m odel is based on a sim ulation of all unknowns in the m odel, one could spend a fair am ount of space sum m arizing the output in various form ats, such as histor y plots and histogram s of the sim ulated values. Instead, we
Table 1 . Bayesian p-value and DIC results for m odel set Model 0 1 2a 2b 3
p-value
deviance
eþ . df
DIC
0.043 0.448 0.447 0.444 0.362
8677.44 8655.81 8656.43 8655.80 8658.32
3.51 11.10 12.64 11.00 17.00
8680.96 8666.91 8669.07 8666.80 8675.32
Random eþ ects and shrinkage estimation
347
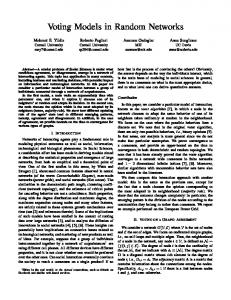
will just present posterior m eans ( point estim ates) and standard deviations of the relevant parameters. For the m allard data, the estim ated posterior m eans and standard deviations of the survival and recovery param eters are: l u 5 0.547, r u 5 0.3530, l k 5 2 1.468 and r k 5 0.322. One reviewer comm ented on the diý culty in interpreting param eter estim ates on the logit scale. N otw ithstanding the rationale for use of the logit param eterization given in Section 6, these estim ates m ay be used to generate results that are interpretable on a probability scale. For (m) exam ple, sim ulate the sequence of a (i) ~ N orm al( l (i) ) where l (m) and r (m) are u ,r u u u the mth sam ple from the posterior distribution (i.e. the output from MC M C analysis). Then, characterize the distribution of u 5 expit(a ) from the sequence {expit(a (m) ):m 5 1, . . .}. In Bayesian parlance, this would constitute an estimate of the posterior predictive distribution for the survival rate in an unsam pled year. Figure 1 shows this quantity using our MC M C output. T he m ean and standard deviation (on the probability scale) are 0.627 and 0.091. In this case, the m ass of the distribution is not too near the boundary and so sum marization by m ean and standard deviation seems reasonable (and clearly a norm al approxim ation to Fig. 1 is not unreasonable). Irrespective of the scale of prior param eter estim ates, interest does not typically focus on prior parameters. Instead, the `random eþ ects’ m odel structure is employed in the nam e of parsim ony, and /or to yield im proved estim ates of annual survival and reporting rate, w hich are m ore often the quantities of interest. U nder our logit parameterization, one directly obtains estim ates of the annual sur vival and reporting rate year eþ ects, a t , and c t . However, for practical reasons (e.g. harvest m anagement applications), one would prefer estim ates of the probabilities expit(a t ), exp it(c t ). T hus, we present the estim ates on this scale. (As pointed out in Section 6, one may summ arize functions of the M CM C output for a t and c t in order to estim ate the posterior distribution of functions of those param eters.) Although sum m ar y by m ean and standard deviation m ay not be entirely adequate for probabilities, space does not permit m ore adequate characterization of a large num ber of posterior distributions.
F ig . 1. Posterior predictive distribution of survival probability.
348 Table 2 .
J. A . Royle & W. A . Link Survival and reporting probability estim ates under Bayesian, MLE and EBU P procedures for the Mallard data Bayes
M LE
EBU P
Tim e period
m ean
std
m le
SE
m ean
std
Survival 1 2 3 4 5 6 7 8
0.654 0.605 0.679 0.684 0.654 0.582 0.606 0.584
0.066 0.050 0.042 0.042 0.042 0.045 0.044 0.058
0.579 0.611 0.669 0.785 0.638 0.536 0.590 0.559
0.114 0.078 0.081 0.098 0.074 0.059 0.071 0.136
0.650 0.606 0.677 0.675 0.655 0.589 0.604 0.589
0.054 0.042 0.038 0.036 0.039 0.039 0.042 0.051
Repor ting 1 2 3 4 5 6 7 8
0.158 0.219 0.188 0.210 0.173 0.166 0.192 0.210
0.036 0.033 0.029 0.033 0.025 0.023 0.026 0.031
0.103 0.233 0.180 0.309 0.150 0.143 0.188 0.202
0.041 0.054 0.050 0.155 0.038 0.025 0.039 0.069
0.162 0.217 0.187 0.202 0.174 0.169 0.190 0.211
0.028 0.027 0.025 0.026 0.023 0.020 0.023 0.029
T he posterior m eans and standard deviations of the year-speci® c survival rates are shown in Table 2 (colum ns 2 - 3). In addition to these Bayesian estim ates, we present results from two other analyses. T he estim ates given in columns 4 - 5 are the M LEs com puted using M ARK (W hite & Burnham, 1999). These results illustrate clearly the shrinkage eþ ect attained by treating the param eters as being random . That is, less variability than exhibited by the M LEs, and larger standard errors of the M LEs as com pared with the posterior standard deviations. Since the M LE standard errors are very sim ilar to posterior standard deviations of the estim ates under a ¯ at prior distribution, the diþ erence m ay be interpreted as that induced by the additional m odel structure (i.e. what is, in essence, an informative prior). Interestingly, the Bayes estim ate for u 1 is larger than the m ean survival, whereas the M LE is lower than the m ean sur vival. U sing the linear BLUP-based shrinkage approach, such behaviour is not possible (which is not to say that it is desirable, either). This is a consequence of random eþ ects param eterization within the non-linear m ultinom ial likelihood. T he third set of estimates (colum ns 6 - 7) is based on the EBUP procedure described in Section 6.3. W hile the actual philosophical underpinings of this procedure are som ewhat am biguous, we believe it is essentially a `frequentist-like’ solution to the problem , as it m imics the norm al random eþ ects procedures described in Section 3. N ote that while the estimates are alm ost identical to the Bayes estim ates, the im portant result is that the EBU P standard error estimates are always sm allerÐ a consequence of failure to account for uncertainty in prior param eter estim ation, and so we would tend to overstate our con® dence in the results. For com pleteness, estim ates of k t are given in Table 2, although we om it discussion of these results.
Random eþ ects and shrinkage estimation
349
8 D iscussion and conclusions M odels containing random eþ ects have proven useful in m any ecological settings and we believe they have great prom ise in modelling data from studies of m arked anim als. N otions of im proved estim ation through shrinkage, m odelling pattern in param eters, and accounting for correlation am ong m odel eþ ects are all facilitated by consideration of random eþ ects models. Inform al estim ation of random eþ ects within a capture- recapture fram ework m ay be carried out by applying BLUP-like estimators to collections of M LEs obtained using conventional m ethods. W hile this approach m ay perform well with large sam ple sizes, it has several im portant drawbacks. N otably, it fails to account for uncertainty in prior param eter estim ates, and it is not generally suited for analysis of random eþ ects in non-norm al m odels. O n the other hand, these are easily and rigorously dealt with within a Bayesian fram ework. T his is because the probability calculus required to compute the posterior distribution of interest is the sam e no m atter the context of the problem . Adopting the random view of param eters has great prom ise, not only for conventional m odelling applications, but also for the developm ent of m odels that are largely intractable using conventional techniques, such as param eterization of correlation am ong eþ ects, as m entioned in Section 6.2. We believe that an enhanced ability to ® t m odels where the secondary m odel structure is imposed on parameters is the m ost im portant bene® t of adopting a Bayesian fram ework. T he classical random eþ ects m odels are only one relatively sim ple class of such m odels. O ne ® nal advantage of Bayesian analysis that we did not discuss in detail, is that Bayesian inference is not asymptotic, as are alm ost all likelihood-based procedures. Therefore, the subjective determination of whether or not asym ptotic results apply is unnecessary, and honest accounting of uncertainty is not dependent on that determ ination. W hile we feel that Bayesian analysis has im portant advantages in capturerecapture settings, the old adage that there is no such thing as a free lunch certainly applies. Im portantly, even with recent advances m ade in Bayesian com putation, there are no general software packages available for m odelling data from m arked anim als that com pare w ith those available for applying traditional methods (e.g. M ARK ; W hite & Burnham , 1999). However, com putation in speci® c situations is easily accom plished using the popular program BUG S (Spiegelhalter et al., 1996). Brooks et al. (2000b) provide the BUG S code required to ® t certain types of bandrecover y m odels. It is likely that m any useful m odels m ay be ® t using this software. M odel assessm ent and selection are also im portant considerations in any application. Classical methods such as AIC (e.g. Burnham & Anderson, 1998) are simple to apply and widely understood am ong biologists, whereas m ost Bayesian m ethods are not (on either count). N evertheless, there are m any Bayesian m ethods that aid in such activities. Som e of these, including D IC, and Bayesian p-valu es, are relatively straightforward to im plem ent within an M CM C fram ework, and should facilitate adoption of Bayesian m ethods. Acknowledgem ents This work began as part of a short course on Bayesian m ethods presented by the authors at a USGS Cooperative Research Unit quantitative m ethods workshop in Estes Park, M ay, 2000. We thank C hris Jennelle for com puting assistance. We also thank Professor Byron M organ and two referees for m any helpful com m ents and suggestions.
350
J. A . Royle & W. A . Link
R EF ER EN C ES B rooks, S . P. & G elman, A . (1998 ) Alternative m ethods for monitoring convergence of iterative sim ulation, Journal of Comp. Graphical Statist, 7, pp. 434 - 455. B rooks, S . P., C atchpole, E . A ., M organ, B . J . T. & B arry, S . C . (2000a ) On the Bayesian analysis of ring-recovery data, B iometr ics, 56, pp. 951 - 956 . B rooks, S . P., C atchpole, E . A . & M organ, B. J . T. (2000b ) Bayesian animal survival estimation, Statistical Science, 15(4) , pp. 357 - 376 . B rownie, C ., A nderson, D . R ., B urnham, K . P. & R obson, D. S . (1985) Statistical Inference from B and Recovery Data: A Handbook, 2nd Edn (U S Fish and W ildlife Service Resource Publication 156). B urnham, K . P. (2000 ) On random eþ ects m odels for capture- recapture data, J. Agr. B iol. and Env. Stats. (to appear). B urnham, K . P. & O verton, W . S . (1978 ) Estim ation of the size of a closed population w hen capture probabilities vary among anim als, B iometrika, 65, pp. 625 - 633 . B urnham, K . P. & A nderson, D. R . (1998) M odel Selection and Inference: A Practical InformationTheoteric A pproach (N ew York, Springer-Verlag). C arlin, B . P. & L ouis, T. A . (1996) B ayes and Empirical B ayes Methods for Data Analysis (N ew York, Chapm an & H all /CRC ). C asella, G . & B erger, R . L . (1990) Statistical Inference (Paci® c G rove, CA, Brooks /Cole). C havez- D emoulin, V. (1999 ) Bayesian inference for sm all-sam ple capture- recapture data, B iometrics, 55, pp. 727 - 731. C hristensen, R . (1991) Linear Models for M ultivariate, Time Series, and Spatial Data (N ew York, Springer-Verlag). C ressie, N . A . C . (1991) Statistics for Spatial Data (N ew York, W iley). D upuis, J . A . (1995 ) Bayesian estim ation of m ovem ent and survival probabilities from capturerecapture data, B iometr ika, 82(4) , pp. 761 - 772. E fron, B . & M orris, C . (1975 ) Data analysis using Stein’ s estimator and its generalizations, J. Am er. Statist. Assoc., 70, pp. 311 - 319. E fron, B . & M orris, C . (1977 ) Stein’s paradox in statistics, Scienti® c Am erican, 236(5) , pp. 119 - 127. G elman, A ., C arlin, J . B ., S tern, H . S . & R ubin, D . B . (1995) B ayesian Data Analysis (L ondon, Chapm an & H all). G eorge, E . I. & R obert, C . P. (1992 ) Capture- recapture estim ation via Gibbs sam pling, B iometr ika, 79(4) , pp. 677 - 683 . G ilks, W. R ., R ichardson, S . & S piegelhalter, D . J . (Eds) (1996a) Markov Chain Monte Carlo in Practice (London, Chapm an & H all). G ilks, W . R ., R ichardson, S . & S piegelhalter, D . J . (1996b ) Introducing Markov chain Monte Carlo. In: W. R. G ilks, S . R ichardson & D . J . S piegelhalter (Eds) Markov Chain Monte Carlo in Practice, pp. 1 - 19 (L ondon, Chapman & Hall). H astie, T. J . & T ibshirani, R . J . (1990) Generalized Additive Models (London, Chapm an & H all). H andcock, M . S . & S tein, M . L . (1993 ) A Bayesian analysis of kriging, Technometrics 35, 403 - 410 . H enderson, C . R . (1950 ) Estim ation of genetic param eters, Ann. M ath. Statist., 21, pp. 309 - 310. J ames, W. & S tein, C . (1961 ) Estimation with quadratic loss, Proceedings of the Fourth B erkeley Symposium on Math. Statist. and Prob., 1, pp. 361 - 379 (Berkeley, CA, U niversity of California Press). K ackar, R . N . & H arville, D . A . (1981 ) U nbiasedness of two-stage estim ation and prediction procedures for m ixed linear models, Communications in StatisticsÐ Theory and Methods, A10, pp. 124 9 - 1261. K ackar, R . N . & H arville, D . A . (1984 ) Approxim ations for standard errors of estimators of ® xed and random eþ ects in m ixed linear m odels, Jour nal of the Am erican Statistical A ssociation, 79, pp. 853 - 862. L aird, N . M . & L ouis, T. A . (1987 ) Empirical Bayes con® dence intervals based on bootstrap sam ples (with discussion), Jour nal of the Am er ican Statistical Association, 82, pp. 739 - 757. L aird, N . M . & W are, J . H . (1982 ) Random -eþ ects m odels for longitudinal data, B iometrics, 38, pp. 963 - 974. L ebreton, J . D ., B urnham, K . P., C lobert, J. & A nderson, D . R . (1992 ) Modeling survival and testing biological hypotheses using m arked animals: A uni® ed approach w ith case studies, Ecological M onographs, 62(1) , pp. 67 - 118. L ink, W. A . & H ahn, C . (1996 ) Em pirical Bayes estimation of proportions with application to cowbird parasitism rates, Ecology, 77, pp. 252 8 - 2537. L ouis, T. A . (1984 ) Estim ating a population of param eter values using Bayes and empirical Bayes m ethods, Journal of the Am erican Statistical Association, 79, pp. 393 - 398 .
Random eþ ects and shrinkage estimation
351
M orris, C. N. (1983 ) Param etric empirical Bayes inference: Theory and applications, Journal of the Am erican Statistical Association, 78(381) , pp. 47 - 65. N ychka, D. (1998) Spatial Process Estimates as Smoothers. Smoothing and R eg ression. Approaches, Computation and Application, M . G. S chimek (E d) (N ew York, W iley). R obinson, G . K . (1991 ) T hat BL UP is a good thing: The estim ation of random eþ ects (with discussion), Stat. Sci., 6(1), pp. 15 - 51. S avage , L. J. (1961 ) T he foundations of statistics reconsidered. Proceedings of the Fourth B erkeley Symposium on M ath. Statist. & Prob., 1, pp. 575 - 586 (Berkeley, CA, University of California Press). S eber, G . A . F. (1982) The Estimation of Animal Abundance and Related Parameters, 2nd Edn (London, G riý n). S piegelhalter, D . J ., T homas, A . & B est, N . G . (1996 ) Computation on Bayesian graphical m odels, B ayesian Statistics 5, pp. 407 - 425. S piegelhalter, D . J ., B est, N . G . & C arlin, B . P. (1998 ) Bayesian deviance, the eþ ective num ber of param eters, and the com parison of arbitrarily com plex m odels. Research Report 98-009 , Division of Biostatistics, University of Minnesota. S tein, C . (1955 ) Inadmissability of the usual estimator for the mean of a m ultivariate normal distribution, Proceedings of the Third B erkeley Symposium on Math. Statist. & Prob., 1, pp. 197 - 206 (Berkeley, CA, U niversity of California Press). Vounatsou, P. & S mith, A . F. M . (1995 ) Bayesian analysis of ring-recovery data via Markov Chain M onte Carlo sim ulation, B iometrics, 51, pp. 687 - 708. W hite, G . C . & B urnham, K . P. (1999 ) Program MARK: Survival estim ation from populations of m arked anim als, B ird Study, 46, pp. 120 - 138 (supplement).