molecules Article
Rapid Mechanistic Evaluation and Parameter Estimation of Putative Inhibitors in a Single-Step Progress-Curve Analysis: The Case of Horse Butyrylcholinesterase Jure Stojan Institute of Biochemistry, Faculty of Medicine, University of Ljubljana, Vrazovtrg 2, 1000 Ljubljana, Slovenia;
[email protected]; Tel.: +386-1-543-7649 Received: 30 June 2017; Accepted: 21 July 2017; Published: 26 July 2017
Abstract: Highly efficient and rapid lead compound evaluation for estimation of inhibition parameters and type of inhibition is proposed. This is based on a single progress-curve measurement in the presence of each candidate compound, followed by the simultaneous analysis of all of these curves using the ENZO enzyme kinetics suite, which can be implemented as a web application. In the first step, all of the candidate ligands are tested as competitive inhibitors. Where the theoretical curves do not correspond to the experimental data, minimal additional measurements are added, with subsequent processing according to modified reaction mechanisms. Keywords: butyrylcholinestersae; inhibitors and reactivators; enzymic mechanism
1. Introduction Cholinesterases have been extensively investigated for more than 60 years [1–3]. Due to the role of the acetylcholinesterases (AChEs; EC 3.1.1.7) in the termination of transmission at cholinergic synapses, much more attention has been focused on these, rather than the butyrylcholinesterases (BChEs; EC 3.1.1.8). However, the BChEs have become increasingly important, particularly as the first-line defense against nerve agent poisons and related pesticides, and also as a target enzyme for alleviation of symptoms in the later stages of Alzheimer’s disease [4,5]. These characteristics have thus promoted the continuous search for new compounds that can modulate the activities of these enzymes of the cholinesterase family [6,7]. In recent years, new approaches have been developed for the search for lead compounds through the availability of huge databases of existing natural and synthetic organic molecules [7]. With rapidly increasing computational power, search algorithms have been developed that allow all compounds in such databases to be surveyed according to specific criteria. These might include the size and charge of the molecules, their solubility, their predicted crossing of the blood–brain barrier, among many further possibilities [8]. A second level of software has also been introduced for the further insilico prediction of interactions/binding of the previously reduced number of candidates [9]. The resulting hits can then be subjected to rational selection in terms of some 50 to 100 potentially active compounds, as at this stage these can no longer be sorted by automatic means. The subsequent step is to test these potential hits for their biological activities, initially using the purified target; i.e., the enzyme. It should be stressed that such procedures have indeed recently resulted in the identification of several highly specific ligands, which have also been further improved by targeted chemical modifications in the following steps [6–9].
Molecules 2017, 22, 1248; doi:10.3390/molecules22081248
www.mdpi.com/journal/molecules
Molecules 2017, 22, 1248
2 of 9
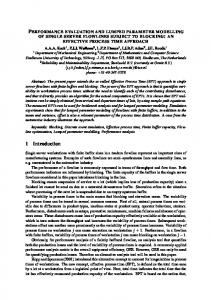
Here, the focus is on effective and rapid invitro determination of the biological activities of selected compounds as potential inhibitors of the system under investigation. This process is based on a single progress-curve measurement in the presence of each candidate ligand, to yield the corresponding kinetic parameters, and also to indicate the mode of action. The best-known classical reversible anti-cholinesterase inhibitors were included in this study, along with others that have shown more complex interactions. For reliable verification of the mode of action of each of these compounds, the three-dimensional (3D) structures of most of them in complexes with at least one cholinesterase are available [10–12]. 2. Results and Discussion Hundreds of ligands have been tested as inhibitors of cholinesterases over recent decades, with their 3D structures in complexes with cholinesterases solved in many cases. Most of these studies were stimulated during searches for new nerve agents, and for compounds that might provide protection against them. Recently, several studies have concentrated on inhibitors with neuroprotective roles, and especially compounds that specifically interact with BChEs [7,13–15]. To reach this goal, all serious candidate ligands have to be tested in vitro on the target enzyme(s). Although new, more or less automated technologies equipped with expensive robots can furnish a huge amount of information in a relatively short period of time, all of this information must be processed, with the main aim being to single out only the potentially interesting compounds. While most screening tests use IC50 as a determining criterion, it is clear that this is a relatively limited system. Indeed, an IC50 can only provide reliable conclusions if the compound acts in a non-competitive fashion. Otherwise, the IC50 can be very misleading, unless the concentration and type of substrate are also given. In contrast, the dissociation constant is universal, and thus not substrate dependent. Even more importantly, when classical initial rate analysis is used, any slow event during the interaction between the ligand and the target protein might be overlooked. Therefore, by making use of multiple progress curve analysis, as suggested here, it is exactly these drawbacks that are avoided. The selected inhibitors in this study are well-known compounds, and most of them come with solved 3D structures in complexes with cholinesterases, for which the kinetics parameters and reaction mechanisms have been reported. Figure 1 shows the progress curves for each of the eight inhibitors investigated here, in the presence of the 50 µM butyrylthiocholine iodide (BSCh) starting concentration. Within this substrate concentration, cholinesterases follow simple hyperbolic kinetics and the evolving products (thiocholine and butyrate) do not affect the hydrolysis. Figure 1 is divided into four panels for clarity, and also on the basis of the thorough inspection of their shape and the analysis using the ENZO application, according to competitive inhibition. The theoretical curves in Figure 1A support the experimental data, which indicate that tetramethylammonium iodide (TMA), tetraethylammonium iodide (TEA), edrophonium chloride (EDR) and decamethonium bromide (DME) indeed act as competitive inhibitors of BSCh hydrolysis by horse BChE. This is in line with the (expected) positioning of EDR and DME in the active site of horse BChE, although the structures were actually solved for Torpedo californica AChE. A similar reasoning leads to the conclusion that the positive charged TMA and TEA are accommodated above E197 of horse BChE, where they form additional cation-Π interactions with W82 in the same way as seen for BSCh (Protein Data Bank code: 1P0P, [12]). It should be mentioned here, that in the presence of higher substrate concentrations any ternary or quaternary complexes between acylated enzyme, the inhibitor, and the substrate are expected. Consequently, uncompetitive or parabolic component in the inhibition pattern can be introduced, revealing substrate inhibition/activation but also paradoxical activation by an inhibitor [13]. The two theoretical curves in Figure 1B, however, do not follow the experimental data. Here, it can be seen that the initial portions of the curves in particular deviate substantially from the data. As d-tubocurarine was previously defined as a slow binding inhibitor of horse BChE, its action was interpreted as instantaneous binding followed by a slow isomerization step [14]. Therefore, such
Molecules 2017, 22, 1248
3 of 9
an isomerization step was added to the final analysis, and then the theoretical curve followed the experimental data (run the evaluation at http://enzo.cmm.ki.si/kinetic.php?uwd=170623269&load= Molecules 2017, 22, 1248 of 9 true). On the other hand, the reason for the similar shape of the progress curve in the presence of 9423 is different. This is a tight binding inhibitor that acts at concentrations close to that of BChE. Consequently, binding inhibitor that acts at concentrations close to that of BChE. Consequently, a very high affinity a very high affinity that is characterized by a low dissociation rate −1constant (koff , 0.027 s−1 ) causes the that is characterized by a low dissociation rate constant (koff, 0.027 s ) causes the slow onset of inhibition slow onset of inhibition at very low concentrations despite a relatively high association rate constant at very low concentrations despite a relatively high association rate constant (kon, 6.2 × 10⁷ M−1 s−1). (kon , 6.2 × 10⁷ M−1 s−1 ).
Figure 1. Progress curves (to 600 s) for the hydrolysis of 50 µM BSCh in the absence (red curves, Figure 1. Progress curves (to 600 s) for the hydrolysis of 50 μM BSCh in the absence (red curves, in all in all panels) and presence of the eight inhibitors. (A) The reversible competitive inhibitors panels) and presence of the eight inhibitors. (A) The reversible competitive inhibitors tetramethylammonium (TMA, upper green), tetraethylammonium (TEA, lower green) edrophonium tetramethylammonium (TMA, upper green), tetraethylammonium (TEA, lower green) edrophonium (EDR, upper orange), and decamethonium (DME, lower orange); (B) The slow binder d-tubocurarine (EDR, upper orange), and decamethonium (DME, lower orange); (B) The slow binder d-tubocurarine (D-Tc, lower orange) and the tight binder 942 (upper orange); (C) The mixed reversible inhibitor sodium (D-Tc, lower orange) and the tight binder 942 (upper orange); (C) The mixed reversible inhibitor fluoride (NaF); (D) The irreversible inhibitor methanesulfonylfluoride (MSF). sodium fluoride (NaF); (D) The irreversible inhibitor methanesulfonylfluoride (MSF).
The the small smallirreversible irreversible inhibitor, methanesulfonylfluoride (MSF), is shown in Theaction action of of the inhibitor, methanesulfonylfluoride (MSF), is shown in Figure Figure 1D, and this was very easy to diagnose: the plateau of the curve is lower than the plateau of the 1D, and this was very easy to diagnose: the plateau of the curve is lower than the plateau of the curve curve the absence of MSF, because the concentration of MSF inactivates horse BChE before the in theinabsence of MSF, because the concentration of MSF usedused inactivates horse BChE before the total total added substrate hydrolyzed. This whythe thestep stepfor forMSF MSF in in the reaction added substrate cancan be be hydrolyzed. This is iswhy reaction scheme scheme(Figure (Figure2,2, k16 k16) )isismodelled modelledasasan anirreversible irreversibleone. one.ItItcan canalso alsobe bestressed stressedhere herethat thatthe theinitial initialrate rateininthis thiscurve curvethat that was at aatrelatively highhigh concentration (15 mM recognize MSF as anMSF inhibitor, wasobtained obtained a relatively concentration (15MSF) mMwould MSF) not would not recognize as an although has successfully passed stagepassed 2 of clinical for approval as an anti-Alzheimer’s inhibitor,MSF although MSF has successfully stage trials 2 of clinical trials for approval as an antidisease drug [16]. Alzheimer’s disease drug [16].
Molecules 2017, 22, 1248 Molecules 2017, 22, 1248
4 of 9 4 of 9
Figure 2. Reaction scheme scheme for for the the simultaneous simultaneous analysis analysis of of four Figure 2. Reaction four competitive competitive reversible reversible enzyme enzyme inhibitors: a mixed reversible enzyme inhibitor, an irreversible inhibitor, a slow binding inhibitor, and inhibitors: a mixed reversible enzyme inhibitor, an irreversible inhibitor, a slow binding inhibitor, and reversible inhibitor inhibitor in in the the presence presence of of the the substrate. substrate. In In this this scheme, scheme, EE is is horse horse BChE, BChE, aa tight tight binding binding reversible the reversible inhibitors are tetramethylammonium(TMA), tetraethylammonium (TEA), edrophonium the reversible inhibitors are tetramethylammonium(TMA), tetraethylammonium (TEA), (EDR), and decamethonium (DME), the mixed inhibitor is sodium fluoride (F), the slow binding edrophonium (EDR), and decamethonium (DME), the mixed inhibitor is sodium fluoride (F), the slow inhibitor is d-tubocurarine (TC), which acts in two steps, as an instantaneous step followed by a slow binding inhibitor is d-tubocurarine (TC), which acts in two steps, as an instantaneous step followed isomerization, the irreversible inhibitor is methanesulfonylfluoride (MSF), and the tight binderis 942 by a slow isomerization, the irreversible inhibitor is methanesulfonylfluoride (MSF), and the tight (I). S represents the substrate BSCh and P represents thiocholine, a detection product. k0 –k20 are binderis 942 (I). S represents the substrate BSCh and P represents thiocholine, a detection product. k0– second and first order rate constants. The scheme was generated by the web application ENZO at k20 are second and first order rate constants. The scheme was generated by the web application ENZO http://enzo.cmm.ki.si/kinetic.php?uwd=170623269&load=true. at http://enzo.cmm.ki.si/kinetic.php?uwd=170623269&load=true.
SodiumFluoride as SodiumFluoride as an an Inhibitor Inhibitor of of Butyrylthiocholine Butyrylthiocholine Iodide Iodide Hydrolysis Hydrolysis by by Horse Horse Butyrylcholinesterase Butyrylcholinesterase The fluoride fluoride anion anionisisaawell-known well-knownBChE BChEinhibitor inhibitor [17,18]. The solved crystal structure of The [17,18]. The solved 3D3D crystal structure of the the fluoride anion in complex with human BChE showed that it is positioned in the oxyanion hole of fluoride anion in complex with human BChE showed that it is positioned in the oxyanion hole of the the BChE active (PDB 2XMC, adjacent the hydroxyl group the catalytic serine. BChE active site site (PDB code:code: 2XMC, [19]),[19]), adjacent to thetohydroxyl group of theofcatalytic serine. This This position thus prevents the carbonyl oxygen of the substrate from positioning appropriately for position thus prevents the carbonyl oxygen of the substrate from positioning appropriately for hydrolysis. As a consequence, it would be reasonable to expect competitive inhibition for sodium hydrolysis. As a consequence, it would be reasonable to expect competitive inhibition for sodium fluoride. However, However, the the progress progress curve curve for for the the hydrolysis hydrolysis of of BSCh BSCh by by horse horse BChE BChE in in the fluoride. the presence presence of of 0.5 mM sodium fluoride does not support this conclusion (Figure 1C). It can be seen that 0.5 mM sodium fluoride does not support this conclusion (Figure 1C). It can be seen that the the initial initial part part of of the the theoretical theoretical curve curve lies lies above above the the experimental experimental curve, curve, and and that that the the approach approach to to the the plateau plateau is slower than the approach of the experimental curve. Such a course indicates that the inhibition is slower than the approach of the experimental curve. Such a course indicates that the inhibition becomes weaker becomes weaker as as the the substrate substrate concentration concentration decreases, decreases, which which clearly clearly contradicts contradicts competitive competitive inhibition. To To provide provide an an explanation explanation for for this, this, measurements measurements in in the the presence presence of of three inhibition. three additional additional sodium fluoride concentrations were conducted under otherwise identical conditions. sodium fluoride concentrations were conducted under otherwise identical conditions. Then, Then, the the progress curves obtained in the absence and presence of these four sodium fluoride concentrations progress curves obtained in the absence and presence of these four sodium fluoride concentrations were The results results are were analyzedaccording analyzedaccording to to each each of of four four classical classical reversible reversible inhibition inhibition mechanisms. mechanisms. The are shown in Figure 3, and these are in line with the initial findings. Indeed, the best agreement between the shown in Figure 3, and these are in line with the initial findings. Indeed, the best agreement between experimental and theoretical curves was achieved when the data were modelled to the mixed inhibition, the experimental and theoretical curves was achieved when the data were modelled to the mixed which yielded an uncompetitive that was 2.4-fold stronger than2.4-fold the competitive inhibition, which yielded an component uncompetitive component that was strongercomponent than the (Table 1). Taking into account this finding and the solved 3D structure of fluoride with competitive component (Table 1). Taking into account this finding and the solvedcomplexed 3D structure of BChE, it appears thatwith the positively charged substrate, BSCh, serves as a vehicle for the delivery the fluoride complexed BChE, it appears that the positively charged substrate, BSCh, servesofas a otherwise repelled negatively charged particles (i.e., fluoride) into the active site of the cholinesterases. vehicle for the delivery of the otherwise repelled negatively charged particles (i.e., fluoride) into the Moreover, thethe electrostatic attraction betweenthe theelectrostatic positive moiety of BSCh and other halogen moiety anions active site of cholinesterases. Moreover, attraction between the positive besides is much weaker, so their concomitant the active siteconcomitant is very unlikely. Once of BSChfluoride and other halogen anions besides fluoride entrance is much into weaker, so their entrance the fluoride anion is delivered to the bottom of the active site, it is substituted by the E197 side chain into the active site is very unlikely. Once the fluoride anion is delivered to the bottom of the active and the fluoride canE197 easilyside enter the adjacent oxyanionfluoride hole (compare [18]).enter The the outstanding site, it isreleased substituted by the chain and the released can easily adjacent
oxyanion hole (compare [18]). The outstanding binding characteristics of the fluoride anion were compared with analogous measurements with sodium iodide, which showed no inhibition at 0.5 mM
Molecules 2017, 22, 1248
5 of 9
Moleculescharacteristics 2017, 22, 1248 5 of 9 binding of the fluoride anion were compared with analogous measurements with sodium iodide, which showed no inhibition at 0.5 mM sodium iodide (data not shown). On the other sodium iodide (data not Onion thewas other hand, it might be argued that the because iodide ion was hand, it might be argued thatshown). the iodide already present in these measurements, BSCh already present in these measurements, because BSCh iodide was used as substrate. The absence iodide was used as substrate. The absence of inhibition with the 10-fold higher iodide concentrationof inhibition the 10-fold higher iodide concentration suggests that the similar suggests thatwith the similar ‘co-transport’ of iodide into the active site does not occur. This‘co-transport’ appears to beof iodide into the active site does not occur. This appears to be because, in contrast to fluoride, because, in contrast to fluoride, iodide is largely dissociated from the positively charged moietyiodide of the is largely dissociated from the positively charged moiety of the substrate BSCh in the bulk solute. substrate BSCh in the bulk solute.
Figure Progress curves inhibition μMBSCh hydrolysis horse BChE absence Figure 3. 3. Progress curves forfor thethe inhibition of of 5050 µMBSCh hydrolysis byby horse BChE in in thethe absence (red) and fluoride(0.25, (0.25,0.5, 0.5,1 and 1 and mM, from the highest the (red) andpresence presence(orange) (orange)of of sodium fluoride 2.52.5 mM, from the highest to thetolowest, lowest, respectively). The black curves are theoretical, obtained types of reversible inhibition. respectively). The black curves are theoretical, obtained for for fourfour types of reversible inhibition. (A) (A)Competitive; Competitive;(B) (B)Uncompetitive; Uncompetitive;(C) (C)Non-competitive; Non-competitive; (D)Mixed. Mixed.Note Notethe theagreement agreementbetween betweenthe (D) theexperimental experimentaland andfitted fittedcurves. curves. a. a Table 1. Kinetics parameters forfor thethe inhibition of of horse BChE byby thethe eight inhibitors Table 1. Kinetics parameters inhibition horse BChE eight inhibitors .
Kinetics Parameter Kinetics Parameter K i K ii K on +isomerizationKK-isomerization Koff Koff KK+isomerization Ki Kii Kon -isomerization Tetramethylammonium Tetramethylammonium 2.4 mM 2.4 mM Tetraethylammonium 1.5 mM 1.5 mM Tetraethylammonium Edrophonium (1ACK) 21 µM Edrophonium 21 μM Decamethonium (1ACL) (1ACK) 7.6 µM Sodium fluoride * (2XMC) (1ACL) 0.83 mM 7.6 0.34μM mM Decamethonium d-Tubocurarine 5.1 µM 0.029 s−1 0.010 s−1 Sodium fluoride * (2XMC) 0.83 mM0.34 mM − 1 − 1 − 1 942 (5DYT) 0.43 nM 6.2 M s 0.003 s d-Tubocurarine 5.1 μM 0.029 s−1 0.010 s−1 Methanesulfonylfluoride (5EHX) 0.39 s−1 −1 −1 −1 a :For(5DYT) 0.43 nM can be run6.2 M s 0.003 s * from Figure 3. 942 standard errors, the application at: http://enzo.cmm.ki.si/kinetic.php?uwd= 170623269&load=true. Methanesulfonylfluoride (5EHX) 0.39 s−1 Inhibitor Inhibitor
* from Figure 3. a :For standard errors, the application can be run at: http://enzo.cmm.ki.si/kinetic.php? With this study, we have shown that simultaneous progress-curve analysis of a number of uwd=170623269&load=true.
different inhibitors can provide basic information on their binding properties, even with a single With this study, we have shown that simultaneous progress-curve analysis of a number of kinetics measurement at hand. Not only can the inhibition constants be determined, but also the different inhibitors can provide basic information on their binding properties, even with a single mode of action. In most cases, the findings can be interpreted through correlations with the available kinetics measurement at hand. Not only can the inhibition constants be determined, but also the mode of action. In most cases, the findings can be interpreted through correlations with the available crystallographic information. When, however, the theoretical and experimental kinetics contradict, the rational explanation can still be sought through minimal additional experiments. Indeed, in the
Molecules 2017, 22, 1248
6 of 9
crystallographic information. When, however, the theoretical and experimental kinetics contradict, the rational explanation can still be sought through minimal additional experiments. Indeed, in the case of the cholinesterases, the large amount of different data produced previously helps in reaching an adequate interpretation. Nevertheless, the analysis itself is of paramount importance. In comparison to initial rate data, the complete progress curves include more mechanistic information by far [20], and with the appropriate analysis none of this kinetics information is wasted. However, it must be remembered, that a single progress curve measurement analysis might be insufficient if a peculiar pattern is encountered. Here, for instance, the used low substrate concentration essentially simplifies the actual happenings in the active site in comparison to the events going on at higher substrate concentrations [21,22]. Nevertheless, it seems that for fast screening of a long list of new putative inhibitors, the suggested method is the method of choice. In this report, a web application designed exactly for such cases was used [23]. This is based on a user-friendly graphical interface for the easy drawing of the reaction mechanisms, which is linked to a numerical integration algorithm for the solving of systems of differential equations and for the corresponding parameter estimation. In an alternative analysis, the integrated Michaelis–Menten equation derived by Goliˇcnik in 2013 can be used [24]. Although this equation can only handle classical reversible inhibitors of different types (see Appendix A), it does clearly reveal deviations, as shown for d-tubocurarine and 942 here. 3. Methods and Materials 3.1. Chemicals Purified horse BChE was from Worthington Biochemical Corporation, dithio-bis-di-nitro benzoic acid and butyrylthiocholine iodide (BSCh) were from Sigma, tetramethylammonium iodide (TMA), tetraethylammonium iodide (TEA), edrophonium chloride (EDR), and methanesulfonylfluoride (MSF) were from BDH; decamethonium bromide (DME) was from Koch Light Laboratories; sodium fluoride and d-Tubocurarine were from Fluka AG. N-((1-benzylpiperidin-3-yl)methyl)-N-methylnaphthalene2-sulfonamide (942) was synthesized in the Faculty of Pharmacy, University of Ljubljana (Ljubljana, Slovenia). All other reagents used were of analytical grade. The experiments were carried out at 25 ◦ C in 25 mM phosphate buffer, pH 7.0. 3.2. Inhibition of Butyrylthiocholine Iodide Hydrolysis by Horse Butyrylcholinesterase A series of compounds were tested by measuring the progress curves for BSCh hydrolysis by horse BChE in the absence and presence of each compound at a single concentration over 10 min, in a 0.6 mL cuvette, using the method of Ellman et al. [25]. These included the four classical inhibitors of 2 mM TMA, 2 mM TEA, 25 µM EDR, and 30 µM DME, and also 0.5 mM sodium fluoride, 7.5 mM d-tubocurarine (slow binder), 3.13 mM 942 (tight binder), and 15 mM MSF (irreversible inhibitor). The concentration of horse BChE, which was always added last, was ~1 nM, for hydrolysis of 50 µM BSCh to completion (in most cases), in the presence of 1 mM dithio-bis-di-nitro benzoic acid. Reaching the plateau was important to get an exact estimate of the actual initial BSCh concentration. This was achieved by conversion of the change in absorbance at 412 nm of the resulting thio-nitro benzoate, using a molar absorption coefficient of 13,800 mol−1 cm−1 . All of the measurements were conducted using a conventional spectrophotometer (Lambda 45/Vis; Perkin-Elmer), and a 10-s lag period was added before the start of each measurement. The progress curves were then extrapolated to start at the origin prior to the analysis. 3.3. Theoretical Basis of the Kinetics Analysis The progress-curve analysis was performed using the ENZO web application (Figure 2), implemented at www.enzo.cmm.ki.si [23]. For rapid determination of the kinetics mechanisms and parameters, the Van Slyke–Cullen reaction scheme [26] for substrate hydrolysis by horse BChE was
Molecules 2017, 22, 1248
7 of 9
combined with a reversible competitive inhibition mechanism, as expected for active-site-directed ligands. For MSF, a well-known irreversible inhibitor, a simple irreversible second-order reaction was used. In the initial evaluation, all of the second-order binding rate constants (kon ’s), although not the constant for MSF, were set to the diffusion rate-limited value of 2 ×10⁸ M−1 s−1 . Therefore, only the first-order dissociation rate constants, together with the substrate specificity constant kcat /Km , the initial substrate concentration, and the added horse BChE active-site concentration, had to be evaluated. The kcat of 663 s−1 for the hydrolysis of BSCh by horse BChE was taken from a previous study performed under the same conditions [27]. 3.4. Sodium Fluoride Inhibition of Butyrylthiocholine Iodide Hydrolysis by Horse Butyrylcholinesterase The experimental time-course of sodium fluoride inhibition of BSCh hydrolysis by horse BChE clearly deviated from reversible competitive inhibition. Therefore, a similar experiment was performed, but in the presence of three additional sodium fluoride concentrations (0.25, 1, 2.5 mM). Each of these measurements was performed twice in a row to determine the reliability of the data obtained. The progress curve analysis was then performed using four types of classical inhibition mechanisms: competitive, uncompetitive, non-competitive, and mixed. Again, a 10-s lag period was added to the time-course of each measurement prior to the analysis using the ENZO web application. 4. Conclusions For rapid kinetics evaluation of a number of putative inhibitors, a single progress-curve measurement for each candidate is suggested. A set of curves in the presence of different compounds is analyzed in a simultaneous evaluation run, to estimate the inhibition parameters and define the inhibitors with unconventional mechanistic patterns. These latter can be further processed, in some cases with just a few additional experiments. A subsequent repetition of the measurements under identical conditions, like the 10 curves shown in Figure 3, support the reliability of the information obtained. Acknowledgments: Research Agency of Slovenia is greatly acknowledged (grant No.: P1-170). Conflicts of Interest: There are no conflicts of interest what so ever.
Appendix A An explicit list of reactions implemented in the Scheme as depicted in Figure 2 is: E + S → EA + P → E E + TMA ↔ ETMA E + TEA ↔ ETEA E + EDR ↔ EEDR E + DME ↔ EDME E + F ↔ EF E + TC ↔ TCE ↔ ETC E + MSF → EMSF E + I ↔ EI E is horse BChE, TMA stands fortetramethylammonium, TEA is tetraethylammonium, EDR is edrophonium, DME is decamethonium, F is sodium fluoride, TC is d-tubocurarine, which acts in two steps, as an instantaneous step followed by a slow isomerization, MSF is methanesulfonylfluoride and the I is 942. S represents the substrate BSCh and P represents thiocholine, a detection product. In the suggested analysis the substrate hydrolysis (first reaction) was common to all tested inhibitors and so the two determined parameters (kcat /Km and kcat ).
Molecules 2017, 22, 1248
8 of 9
An alternative analysis of the curves in the presence of classical reversible inhibitors uses the integrated Michaelis–Menten equation as derived by Goliˇcnik [22]:
Pt = S0 − K M × 1.4586887 × ln 1.2 ×
S −V ∗t ( 0 K max ) M S0 × e − 0.4586887 × ln2 × S −V ∗t ( 0 K max ) M S0 × e K M ln2.4× S −V ∗t ( 0 K max ) M S ×e K M ln1+2.4∗ 0
KM
S0 −Vmax ×t ( ) KM S0 × e S −V ×t ( 0 Kmax ) M S ×e K M ln1+2× 0 KM
In this equation, KM is substituted by KM × (1 + [I]/Ki ) to get the progress curve equation in the presence of a competitive inhibitor, or Vmax is substituted by Vmax /(1 + [I]/Ki ) for non-competitive inhibition. If Vmax is substituted by Vmax /(1 + [I]/Kii ) and Km by (1 + [I]/Ki )/(1 + [I]/Kii ), the equation for mixed inhibition is obtained. References 1. 2. 3. 4. 5. 6.
7.
8.
9.
10.
11.
12.
13.
Rosenberry, T.L. Acetylcholinesterase. Adv. Enzymol. 1975, 43, 103–218. [PubMed] Moralev, S.N.; Rozengart, E.V. Comparative Enzymology of Cholinesterases; International University Line: La Jolla, CA, USA, 2006. Krupka, R.M. Chemical structure and function of the active center of acetylcholinesterase. Biochemistry 1966, 5, 1988–1998. [CrossRef] [PubMed] Scarpini, E.; Schelterns, P.; Feldman, H. Treatment of Alzheimer’s disease: Current status and new perspectives. Lancet Neurol. 2003, 2, 539–547. [CrossRef] Giacobini, E. Cholinesterase inhibitors: New roles and therapeutic alternatives. Pharmacol. Res. 2004, 50, 433–440. [CrossRef] [PubMed] Zha, X.; Lamba, D.; Zhang, L.; Lou, Y.; Xu, C.; Kang, D.; Chen, L.; Xu, Y.; Zhang, L.; De Simone, A.; et al. Novel tacrine-benzofuran hybrids as potent multitarget-directed ligands for the treatment of Alzheimer’s disease: Design, synthesis, biological evaluation, and X-ray crystallography. J. Med. Chem. 2016, 59, 114–131. [CrossRef] [PubMed] Košak, U.; Brus, B.; Knez, D.; Šink, R.; Žakelj, S.; Trontelj, J.; Pišlar, A.; Šlenc, J.; Gobec, M.; Živin, M.; et al. Development of an in-vivo active reversible butyrylcholinesterase inhibitor. Sci. Rep. 2016, 6, 39495. [CrossRef] [PubMed] Lipinski, C.A.; Lombardo, F.; Dominy, B.W.; Feeney, P.J. Experimental and computational approaches to estimate solubility and permeability in drug discovery and development settings. Adv. Drug Deliv. Rev. 2001, 46, 3–26. [CrossRef] Brus, B.; Košak, U.; Turk, S.; Pišlar, A.; Coquelle, N.; Kos, J.; Stojan, J.; Colletier, J.P.; Gobec, S. Discovery, biological bvaluation and crystal structure of a novel nanomolar selective butyrylcholinesterase inhibitor. J. Med. Chem. 2014, 57, 8167–8179. [CrossRef] [PubMed] Sussman, J.L.; Harel, M.; Frolow, F.; Oefner, C.; Goldman, A.; Toker, L.; Silman, I. Atomic structure of acetylcholinesterase from Torpedo Californica: A prototypic acetylcholine-binding protein. Science 1991, 253, 872–879. [CrossRef] [PubMed] Harel, M.; Schalk, I.; Ehret-Sabatier, L.; Bouet, F.; Goeldner, M.; Hirth, C.; Axelsen, P.H.; Silman, I.; Sussman, J.L. Quaternary ligand binding to aromatic residues in the active-site gorge of acetylcholinesterase. Proc. Natl. Acad. Sci. USA 1993, 90, 9031–9035. [CrossRef] [PubMed] Nicolet, Y.; Lockridge, O.; Masson, P.; Fontecilla-Camps, J.C.; Nachon, F. Crystal structure of human butyrylcholinesterase and of its complexes with substrate and products. J. Biol. Chem. 2003, 278, 41141–41147. [CrossRef] [PubMed] Stojan, J.; Golicnik, M.; Froment, M.T.; Estour, F.; Masson, P. Concentration-dependent reversible activation-inhibition of human butyrylcholinesterase by tetraethylammonium ion. Eur. J. Biochem. 2002, 269, 1154–1161. [CrossRef] [PubMed]
Molecules 2017, 22, 1248
14. 15.
16.
17. 18. 19.
20. 21.
22.
23.
24. 25. 26. 27.
9 of 9
Stojan, J.; Pavlic, M.R. On the inhibition of cholinesterase by d-tubocurarine. Biochim. Biophys. Acta 1991, 1079, 96–102. [CrossRef] Dou, D.; Park, J.G.; Rana, S.; Madden, B.J.; Jiang, H.; Pang, Y.P. Novel selective and irreversible mosquito acetylcholinesterase inhibitors for controlling malaria and other mosquito-borne diseases. Sci. Rep. 2013, 3, 1068. [CrossRef] [PubMed] Moss, D.E.; Perez, R.G.; Kobayashi, H. Cholinesterase inhibitor therapy in Alzheimer’s disease: The limits and tolerability of irreversible CNS-selective acetylcholinesterase inhibition in primates. J. Alzheimers Dis. 2017, 55, 1285–1294. [CrossRef] [PubMed] Page, J.D.; Wilson, I.B.; Silman, I. Butyrylcholinesterase: Inhibition by arsenite, fluoride, and other ligands, cooperativity in binding. Mol. Pharmacol. 1985, 27, 437–443. [PubMed] Froede, H.C.; Wilson, I.B. The slow rate of inhibition of acetylcholinesterase by fluoride. Mol. Pharmacol. 1985, 27, 630–633. [PubMed] Nachon, F.; Carletti, E.; Wandhammer, M.; Nicolet, Y.; Schopfer, L.M.; Masson, P.; Lockridge, O. X-ray crystallographic snapshots of reaction intermediates in the G117H mutant of human butyrylcholinesterase, a nerve agent target engineered into a catalytic bioscavenger. Biochem. J. 2011, 434, 73–82. [CrossRef] [PubMed] Markus, M.; Plesser, T. Design and analysis of progress curves in enzyme kinetics. Biochem. Soc. Trans. 1976, 4, 361–364. [CrossRef] [PubMed] Stojan, J.; Brochier, L.; Alies, C.; Colletier, J.P.; Fournier, D. Inhibition of Drosophila melanogaster acetylcholinesterase by high concentrations of substrate. Eur. J. Biochem. 2004, 271, 1364–1371. [CrossRef] [PubMed] Szegletes, T.; Mallender, W.D.; Thomas, P.J.; Rosenberry, T.L. Substrate binding to the peripheral site of acetylcholinesterase initiates enzymatic catalysis. Substrate inhibition arises as a secondary effect. Biochemistry 1999, 38, 122–133. [CrossRef] [PubMed] Bevc, S.; Konc, J.; Stojan, J.; Hodošˇcek, M.; Penca, M.; Praprotnik, M.; Janežiˇc, D. ENZO: A web tool for derivation and evaluation of kinetic models of enzyme catalyzed reactions. PLoS ONE 2011, 6, e22265. [CrossRef] [PubMed] Goliˇcnik, M. The integrated Michaelis-Menten rate equation: Déjà vu or vu jàdé? J. Enzyme Inhib. Med. Chem. 2013, 28, 879–893. [CrossRef] [PubMed] Ellman, G.L.; Courtney, K.D.; Andres, V., Jr.; Featherstone, R.M. A new and rapid colorimetric determination of acetylcholinesterase activity. Biochem. Pharmacol. 1961, 7, 88–95. [CrossRef] Kuzmic, P. Application of the Van Slyke-Cullen irreversible mechanism in the analysis of enzymatic progress curves. Anal. Biochem. 2009, 394, 287–289. [CrossRef] [PubMed] Stojan, J. The significance of low substrate concentration measurements for mechanistic interpretation in cholinesterases. Chem. Biol. Interact. 2013, 203, 44–50. [CrossRef] [PubMed]
Sample Availability: Samples of the compounds are commercially available but the inhibitor 942, which can be asked from the authors. © 2017 by the author. Licensee MDPI, Basel, Switzerland. This article is an open access article distributed under the terms and conditions of the Creative Commons Attribution (CC BY) license (http://creativecommons.org/licenses/by/4.0/).