Internet Survey Developments at Statistics Netherlands Discussion paper 05003
Jelke Bethlehem
The views expressed in this paper are those of the author and do not necessarily reflect the policies of Statistics Netherlands
Statistics Netherlands
Voorburg/Heerlen, May 2005
Explanation of symbols . * x – – 0 (0,0) blank 2004–2005 2004/2005 2004/’05
= data not available = provisional figure = publication prohibited (confidential figure) = nil or less than half of unit concerned = (between two figures) inclusive = less than half of unit concerned = not applicable = 2004 to 2005 inclusive = average of 2004 up to and including 2005 = crop year, financial year, school year etc. beginning in 2004 and ending in 2005
Due to rounding, some totals may not correspond with the sum of the separate figures.
Publisher Statistics Netherlands Prinses Beatrixlaan 428 2273 XZ Voorburg The Netherlands
Printed by Statistics Netherlands - Facility Services
Cover design WAT ontwerpers, Utrecht
Information E-mail:
[email protected]
Where to order E-mail:
[email protected]
Internet http://www.cbs.nl
© Statistics Netherlands, Voorburg/Heerlen 2005. Quotation of source is compulsory. Reproduction is permitted for own or internal use.
ISSN: 1572-0314 Key figure: X-10 Production code: 6008305003
Statistics Netherlands
INTERNET SURVEY DEVELOPMENTS AT STATISTICS NETHERLANDS Summary: The Internet is expanding rapidly. More and more people have access to it. The Internet has now become an attractive medium for collecting relatively large amounts of data in a relatively cheap way. Not surprisingly, national statistical institutes, research institutes, and commercial marketing research organisations are using, or are considering using, Internet surveys for collecting survey data. Use of Internet surveys is not without draw-backs. Lack of attention for the methodological aspects may easily lead to survey designs that will produce invalid survey results. And there are ample examples of such surveys. This paper gives a description of some of the methodological problems of Internet surveys. Then it discusses the role web surveys can play in national statistical institutes. In the short run, Statistics Netherlands foresees interesting applications in mixed-mode surveys Attention is paid to some problems concerning implementation of mixed-mode surveys. The Blaise system, developed by Statistics Netherlands, is described as a useful tool for mixed-mode surveys. Some early experiments and experiences with Internet surveys are mentioned. The final part discusses the prospects for single-mode Internet survey in the not too far away future. Keywords: Internet surveys, Web surveys, Mixed-mode surveys, Questionnaire design, Survey errors, Blaise system
1. Introduction Collecting data using a survey is a complex, costly and time-consuming process. Traditionally, surveys where carried out using paper forms (PAPI). One of the problems of this mode of data collection was that data usually contain many errors. Therefore, extensive data editing is required to obtain data of acceptable quality. Data editing activities often consume a substantial part of the total survey budget. Rapid developments in information technology in the last decades of the previous century made it possible to use microcomputers for computer-assisted interviewing (CAI). This type of data collection has three major advantages: (1) It simplifies work of the interviewers, because they do not have to pay attention any more to choosing the correct route through the questionnaire, (2) it improves the quality of the collected data, because answers can be checked and corrected during the interview, and (3) it considerably reduces time needed to process the survey data. Thus improves the timeliness of the survey results, and it reduces the survey costs. More on the benefits of CAI can be found in Couper et al. (1998). The rapid development of the Internet in the last decade has lead to a new type of computerassisted interviewing: Computer Assisted Web Interviewing (CAWI). The questionnaire is designed as a website, which is accessed by respondents. Web surveys are almost always selfadministered: respondents visit the website, and complete the questionnaire by answering the 1
questions. This type of survey is also called a web survey. Note that that are other ways to interview people using the Internet. One example is an e-mail survey, which requires that people fill in and return forms that are part of an e-mail or are attached to an e-mail. Any survey carried out using the Internet will be called an Internet Survey. A web survey is a special kind of Internet survey, i.e. a survey using a browser on the World Wide Web. Not surprisingly, survey organisations use, or consider using, Internet surveys. At first sight, Internet surveys seem to have some attractive advantages: •
Now that so many people are connected to the Internet, an Internet survey is a simple means to get access to a large group of potential respondents;
•
Questionnaires can be distributed at very low costs. No interviewers are needed, and there are no mailing and printing costs;
•
Surveys can be launched very quickly. Little time is lost between the moment the questionnaire is ready and the start of the fieldwork;
•
Particularly web surveys offer new, attractive possibilities, such as the use of multimedia (sound, pictures, animation, and movies);
Thus, Internet surveys seem to be a fast, cheap an attractive means of collecting large amounts of data. However, there are methodological problems. These problems are partly caused by using the Internet for selecting respondents, and partly by using the web as a measuring instrument. If these problems are not seriously addressed, Internet surveys may result in low quality data for which no proper inference can be made with respect to the target population of the survey. Cooper (2000) remarks that web has made it possible for many organisations, other than traditional survey organisations, to conduct surveys. Several of these organisations are not aware of potential methodological risks involved in conducting web surveys, Therefore there are many bad surveys on the Internet. For respondents it is not always easy to distinguish the good from the bad. The abundance of web surveys has a negative effect on response rates. Potential respondents are overcrowded, and pull out. The effect is similar to that of telephone surveys, where the survey climate is spoiled by telemarketing activities. This paper consists of three parts. The first part describes some of the methodological issues that are specific for Internet surveys, with a special focus on web surveys. Particularly, attention is paid to the effects of non-probability sampling, coverage errors, measurement errors, and nonresponse errors. The second part is about the role Internet surveys can play in national statistical institutes. There are potential applications, both in economic and social surveys. Due to coverage problems, use in social surveys will for the time being probably be limited to mixed-mode surveys. Implementing mixed-mode surveys can be a challenge. The Blaise System is discussed as a useful tool for carrying mixed-mode surveys, including web-surveys. Statistics Netherlands has developed this system for computer assisted interviewing. This system has been extended for use as a web survey instrument. The features of Blaise can make it a powerful instrument for high quality data collection in the Internet. It is also shown that this system is particularly well suited for use in mixed-mode surveys. 2
The third part of the paper is devoted to plans, experiments and early experiences of Statistics Netherlands related to Internet surveys. The final part of the paper discusses the potential of single-mode web surveys. In the long run, web surveys may be a relatively cheap data collection tool for national statistical institutes, but this requires a number of methodological problems to be solved.
2. Methodological issues 2.1.
About survey errors
One of the main objectives of a sample survey usually is to compute estimates of population characteristics. Such estimates will never be exactly equal to the population characteristics. There will always be some error. This error can have many causes. Bethlehem (1999) gives taxonomy of possible causes. It is reproduced in figure 2.1. The taxonomy is a more extended version of one given by Kish (1967). Figure 2.1. Taxonomy of survey errors
Total error Sampling error Estimation error
Non-sampling error Selection error
Observation error
Over-coverage error
Measurement error
Non-observation error Processing error
Under-coverage error
Nonresponse error
The ultimate result of all these errors is a discrepancy between the survey estimate and the population characteristic to be estimated. This discrepancy is called the total error. Two broad categories can be distinguished contributing to this total error: sampling errors and nonsampling errors. Sampling errors are introduced by the sampling design. They are due to the fact that estimates are based on a sample and not on a complete enumeration of the population. Sampling errors vanish if the complete population is observed. Since only a sample is available for computing population characteristics, and not the complete data set, one has to rely on estimates. The sampling error can be split in a selection error and an estimation error. The estimation error denotes the effect caused by using a sample based on a random selection procedure. Every new selection of a sample will result in different elements, and thus in a different value of the estimator. The estimation error can be controlled through the sampling design. For example, by increasing the sample size, or by taking selection probabilities
3
proportional to the values of some well chosen auxiliary variable, one can reduce the error in the estimate. A selection error occurs when wrong selection probabilities are used. For example, true selection probabilities may differ from anticipated selection probabilities when elements have multiple occurrences in the sampling frame. Selection errors are hard to avoid without thorough investigation of the sampling frame. Non-sampling errors may even occur if the whole population is investigated. They denote errors made during the process of obtaining answers to questions asked. Non-sampling errors can be divided in observation errors and non-observation errors. Observation errors are one form of non-sampling errors. They refer to errors made during the process of obtaining and recording answers. An overcoverage error means that elements are included in the survey that do not belong to the target population. A measurement error occurs when a respondent does not understand a question, or does not want to give the true answer, or if the interviewer makes an error in recording the answer. Also, interview effects, question wording effects, and memory effects belong to this group of errors. A measurement error causes a difference between the true value and the value processed in the survey. A processing error denotes an error made during data processing, e.g. data entry. Non-observation errors are errors made because intended measurements can not be carried out. Undercoverage occurs when elements of the target population do not have a corresponding entry in the sampling frame. These elements can and will never be contacted. Another nonobservation error is nonresponse. It is the phenomenon that elements selected in the sample do not provide the required information. The taxonomy above makes clear that a lot can go wrong during the process of collecting survey data, and usually it does. Some errors can be avoided by taking preventive measures at the design stage. However, some errors will remain. Therefore, it is important to check collected data for errors, and where possible, to correct these errors. This activity is called data editing. Data editing procedures are not able to handle every type of survey error. They are most suitable for detecting and correcting measurement errors, processing errors, and possibly overcoverage. Phenomena like selection errors, undercoverage, and nonresponse require a different approach. This approach often leads to the use of adjustment weights in estimation procedures, and not to correction of individual values in records. 2.2.
Selection problems
Horvitz and Thompson (1952) show in their fundament paper that only unbiased estimates of population characteristics can be computed if every element in the population has a non-zero probability of selection, and these probabilities are known to the researcher. Furthermore, only under these conditions, the accuracy of estimates can be computed. Many surveys on the web are not based on probability sampling. Couper (2000) distinguished three groups of such surveys: The first group consists of surveys that are primarily intended for entertainment purposes. They often take the form of simple polls. There is no control over who responds, and even how many times one responds. A typical example was the survey on Kennisnet (Knowledge net, 4
www.kennisnet.nl), see figure 2.2.1. This is a Dutch website for all those involved in education. More than 11,000 schools and other educational institutes use this website. The survey was an opinion poll for the general elections of 22 January 2003. Everybody, also those not involved in education, could participate in the poll. Table 2.2.1 contains both the official results (seats in parliament) of the election (column 2) and the results of this poll on the morning of the election day (column 3).
Figure 2.2.1. The Kennisnet election website
The survey estimates were based on votes of approximately 17,000 people. No adjustment weighting was carried out. Although this is a large sample, it is clear that the survey results were no way near the true election results. The Mean Absolute Difference (MAD) is equal to 12.5, which means that the estimated number of seats and the true number of seats differ on overage by an amount of 12.5. This survey could certainly not be used for predicting election results. I was unclear whether this was the objective of this opinion poll. The second group of non-probability sample surveys consists of self-selected web surveys. This approach uses open invitations on portals, frequently visited websites, or dedicated survey sites.
5
Table 2.2.1. The results of various opinion survey Election Sample size Seats in parliament: CDA (christian democrats) LPF (populist party) VVD (liberals) PvdA (social democrats) SP (socialists) GL (green party) D66 (liberal democrats) Other parties Mean Absolute Difference
44 8 28 42 9 8 6 5
Kennisnet
RTL4
SBS6
Nederland 1
17,000
10,000
3,000
1,200
29 18 24 13 22 26 4 14
24 12 38 41 10 9 7 9
42 6 28 45 11 6 5 7
42 7 28 43 9 8 6 7
12.5
5.3
1.8
0.8
An example of this approach was the election site of the Dutch Television channel RTL 4, see figure 2.2.2. It resembled to some extend the ‘entertainment’ web survey, but had a slightly more serious appearance, and also targeted a much wider group of people. Again, the survey researcher had no control at all over who was voting. There was some protection, by means of cookies, against voting more than once. However, this also had the draw-back, that only one member of the family could participate.
Figure 2.2.2. The RTL 4 election website
Table 2.2.1 shows the survey results at noon on the day of the general elections (column 4). Figures were based on slightly over 10,000 votes. No weighting adjustment procedure was 6
carried out. The results are somewhat better than that of the Kennisnet survey, since the MAD decreased from 12.5 to 5.3 However, deviations between estimates and true figures are still large, particularly for the large parties. Note that even a large sample size of over 10,000 people does not help to get accurate estimates. The third group of non-probability sample surveys distinguished by Cooper (2000) consists of volunteer panels of Internet users. This approach creates a volunteer panel by wide appeals on well-visited sites and Internet portals. At time of registration basic demographic variables are asked. A large database of potential respondents is created in this way. For future surveys, samples are selected from this database. Only registered people can participate in these surveys. An illustrative example of this approach was the general election survey of the Dutch commercial television channel SBS6, see www.stemvannederland.nl. People were invited to participate in the survey. Those visitors of the site accepting the invitation were asked a number of questions related to socio-demographic characteristics and voting behaviour in the previous election. From the set of people that was obtained in this way, samples of size 3,000 were selected. Selection was carried out such that the sample was representative with respect to the social-demographic and voting characteristics. Selected people where asked for their voting behaviour in the coming election. Table 2.2.1 shows the results (column 5). The survey took place on the day before the general elections. Although attempts have been made to create a representative sample, the results differ still from the final result. The MAD has decreased to 1.8, but is still substantial. A better prediction would have been obtained with a true probability sample. Table 2.2.1 shows the results of a survey based on such a probability sample. It was carried out by the television channel Nederland in co-operation with the marketing agency Interview-NSS, see also www.politiekebarometer.nl. A sample of size 1200 was selected by means of random digit dialling. The MAD has been reduced to 0.8. The conclusion from the analysis above may be that probability samples are a vital prerequisite for making proper inference about the target population of a survey. Even with a probability sample of only size 1,200 better results can be obtained than with a non-probability sample of size 10,000 or more. Probability sampling starts with the choice of a sampling design. This is the definition of the selection mechanism applied. It should give a non-zero chance of selection to every element in the target population. A straightforward example of a sampling design is simple random sampling, where each element has the same probability of selection. Estimation problems occur if the Internet is used as a selection mechanism. This happens when surfers on the World Wide Web are invited to participate in a survey through a banner, popup window, or other announcement they happen to see on a website. The probability of being confronted with such an invitation is unknown, and the probability of accepting it is unknown. Therefore, it is impossible to compute unbiased estimates of population characteristics. The selfselection surveys in this section are illustrative examples of such non-probability samples.
7
2.3.
Coverage problems
The collection of all elements that can be contacted through the sampling frame is called the frame population. Since the sample is selected from the frame population, conclusions drawn from the survey data will apply to the frame population, and not necessarily to the target population. Coverage problems can arise when the frame population differs from the target population. Undercoverage occurs when elements in the target population do not appear in the frame population. These elements have zero probability of being selected in the sample. Undercoverage can be a serious problem for Internet surveys. If the target population consists of all people with an Internet connection, there is no problem. However, usually the target population is more general than that. Then, undercoverage occurs due to the fact many people do not have access to the Internet.
Figure 2.3.1. Percentage of households having Interne 70
65
60
58
59
2002
2003
48
50 38
40 Percentage 30 20
23 14
10 0 1998
1999
2000
2001
2004
Year
In the Netherlands, the percentage of households having an Internet connection at home increases from year to year, see figure 2.3.1 (source: www.cbs.nl). In six years time, the percentage of Internet connections increased from 14% to 65%. Still, it is clear that not every household will have access to Internet in the near future.
Figure 2.3.1. Having Internet, by sex.
Female
69
Male
77
0
20
40
60 Percentage
8
80
100
An analysis of data (source: www.cbs.nl) about having Internet in 2004 indicates that this is unevenly distributed over the population. Figure 2.3.2 shows the distribution by sex. Clearly, more males than females have access to the Internet.
Figure 2.3.3. Having Internet, by age. 90
12-17 18-24
80
25-34
81
35-44
85
45-54
84 68
55-64 36
65-74 75+
13 0
20
40
60
80
100
Percentage
Figure 2.3.3 contains the percentage of people having Internet by age group (in 2004), source: www.cbs.nl. The percentages of people having access to Internet at home decrease with age. Particularly, the people of age 55 and older will be very much under-represented when the Internet is used as a selection mechanism. Figure 2.3.4 contains the percentage of people using the Internet by level of education (in 2003), source: www.cbs.nl. It is clear that people with a higher level of education more frequently have Internet than people with a lower level of education.
Figure 2.3.2. Having Internet by level of education.
47
Primary
56
Prevocational Junior secondary
73 75
Senior secondary
85
Higher 0
10
20
30
40
50
60
70
80
90
Percentage
The Social and Cultural Planning Agency (SCP) carried out a survey about the use of digital media among a sample of students in secondary education, see De Haan et al. (2002). It turned out that 97% of the students have a PC at home, and that 84% have an Internet connection. 9
However, this percentage is much lower among students with a foreign background. Only 15% of the students with a Moroccan or Turkish background have computer at home. And only 12% of the students with a former Dutch Indies background have a computer at home. The results described above are in line with the findings of authors in other countries. See e.g. Couper (2000), and Dillman and Bowker (2001). It is clear that the Internet itself cannot (yet) be used as a sampling frame, because certain specific groups are substantially under-represented. Even if a proper probability sample is selected, the Internet cannot be used as an instrument for data collection. This will lead to selective nonresponse, because specific parts of the target population will not be able to fill in the (electronic) questionnaire form. However, data collection through the Internet can play a role in a mixed mode surveys, see section 3.1. 2.4.
Nonresponse problems
Nonresponse is the phenomenon that elements (persons, households, firms) in a selected sample do not provide the requested information, or that the provided information is useless. The situation in which all requested information on an element is missing is called unit nonresponse. If information is missing on some items only, it is called item nonresponse. Due to nonresponse the sample size is smaller than expected. This leads to less accurate, but still valid, estimates of population characteristics. This is not a serious problem. It can be taken care of by taking a larger initial sample. A far more serious problem caused by nonresponse is that estimates of population characteristics may be biased. This situation occurs if, due to nonresponse, some groups in the population are over- or under-represented, and these groups behave differently with respect to the characteristics to be investigated. It is clear that nonresponse can have a negative impact on the quality of population estimates. Biased estimates may lead to wrong conclusions being drawn from survey results. And problems become more serious for lower response rates. It can be shown, see e.g. Bethlehem (1988), that the magnitude of the nonresponse bias of estimates is determined by two factors: • The contrast between respondents and nonrespondents, i.e. the extent in which they differ. A large difference in the means of a survey variable for respondents and nonrespondents will lead to a large bias. • The response rate. The lower the response rate is, the higher the bias will be. The response rate of surveys is determined by a large number of factors, including the topic of the survey, the target population, the time period, the length of the questionnaire, etc. The mode of data collection is also an important factor. Generally, face-to-face surveys and telephone surveys have higher response rates than surveys in which respondent are confronted with selfadministered questionnaires. The role of interviewers is crucial in this. They can play an important role in persuading people to participate, and in assisting respondents to answer questions. Such assistance is not available for self-administered questionnaires. A web survey questionnaire is a form of self-administered questionnaire. Therefore, web surveys have a potential of high nonresponse rates. An additional source of nonresponse problems are technical problems of respondents having to interact with the Internet, see e.g.
10
Couper (2000), Dillman and Bowker (2001), Fricker and Schonlau (2002), and Heerwegh and Loosveldt (2002). Slow modem speeds, unreliable connections, high connection costs, low-end browsers, and unclear navigation instructions may frustrate respondents. This often results in respondents discontinuing the completion of the questionnaire. In order to keep the survey response up to an acceptable level, every measure must be taken to avoid these problems. This requires a careful design of web survey questionnaire instruments. Using the Internet for survey data collection is no guarantee for high response rates. Nevertheless, filling in a web survey questionnaire form may be attractive for some people in the target population. It may very well be that in this way a group of respondents is reached which would otherwise not have co-operated for other form of data collection. This makes it worth while to investigate whether web data collection could play a supplementary role in a survey. This is the area of mixed-mode surveys.
3. Web surveys and mixed-mode surveys 3.1.
Mixed-mode surveys
Mixed-mode surveys combine several means of data collection in one survey. Traditionally, there are three modes of data collection: face-to-face interviewing, telephone interviewing, and mail interviewing. Each of these modes has its own advantages and disadvantages in terms of data quality and costs. By combining these modes the best of three worlds may be obtained: high quality data at low costs. The main reason for considering a mixed-mode survey is obtaining satisfactory response rates. Often, a sequential approach is taken. First, the cheapest mode of data collection is applied: mail interviewing (by means of self-administered questionnaires). Non-respondents are reapproached with the next cheapest mode of data collection: telephone interviewing. Finally, for remaining non-respondents, the most expensive mode of data collection is used: face-to-face interviewing. These three modes of data collection vary with respect to response rates that can be achieved. Research shows, see e.g. De Leeuw and Collins (1997), that face-to-face interviewing usually results in the highest response rates, followed by telephone interviewing, and mail interviewing. Dillman et al. (2001) have shown that a mixed-mode approach can substantially increase response rates, particularly when one mode attempt is followed by another after a short pause. A potential problem of mixed mode surveys is that people, who respond by one mode, would give different answers had they responded by another mode. These mode effects have been found in a number of experiments. De Leeuw and Collins (1997) point out that mail surveys perform better than face-to-face and telephone surveys with respect to sensitive questions. Faceto-face surveys and telephone surveys have less item nonresponse than mail surveys. The possible effects for improving response rates by changing from one mode of data collection to another mode were examined by Dillman et al. (2001).
11
A survey organisation designing and implementing a mixed-mode survey is confronted with a number of challenges: • Questionnaire design. To avoid mode effects as much as possible, the questionnaire forms used in different modes should resemble each other as much as possible. This is really a challenge, not only in the development phase of a survey questionnaire, but also in its implementation phase. • Hardware and software. Often different systems are used for different modes. Then it will not be easy to design, implement and maintain data collection instruments that work exactly the same on different systems. If consistency is not enforced, this approach can be very errorprone. It may happen that variables are measured in one mode and not in another, or are measured differently in another mode. So, mode effects can very easily be introduced. • Case management. If different modes are carried out with different systems, case management may prove to be complex. Case management should be straightforward and transparent in order to be able to move cases from mode to another, and to avoid cases from getting lost, or cases occurring in different modes at the same time. • Post-collection treatment. If different systems are used for different modes of data collection, data may be stored in different files formats in different locations. Merging of various data files into one analysis data file may turn out to be cumbersome. In order to avoid the problems mentioned above, there is a need for a well-integrated data collection system. Such a system should support not only support traditional modes of computer-assisted interviewing, but also web interviewing. 3.2.
Using Blaise for mixed-mode surveys
Already in the nineties of the previous century, Statistics Netherlands developed the idea of a Control Centre for Computer Assisted Survey Processing, see Bethlehem (1997). It has been implemented in a software system called Blaise. It is based on the idea that processing survey information is essentially a set of activities for the manipulation of both data and metadata. The data are the answers to the questions on the questionnaire form, and in the course of the process they are transformed into useful statistical information. This can only be achieved properly if relevant metadata is available: the information about the data. Blaise implements the principle that there can be no data without metadata. This principle is implemented everywhere in the system. To carry out a survey, Blaise requires the definition of a data model. It is a description (in the language of the Blaise system) of the variables to be measured, and the rules the values of the variables have to obey. The data model is a metadata specification. Blaise stores this metadata specification in machine-readable form, making it available to all parts of the system. From this moment on, the metadata is always there, and it can be transformed automatically into many different formats, depending on the software that needs it. Blaise supports several modes of data collection. For traditional data collection with paper questionnaires, Blaise can generate a paper form. Blaise can also generate an interviewing program. Traditionally, three types of computer-assisted interviewing were distinguished:
12
•
Computer-assisted telephone interviewing (CATI). For this mode, Blaise also generates the call scheduling system required for managing the survey.
•
Computer-assisted personal interviewing (CAPI). The interviewing program can be downloaded on a laptop or notebook computer, and be used for face-to-face interviewing.
•
Computer-assisted self interviewing (CASI). The interviewing program can be sent to respondents (on diskette, CD-Rom, or by e-mail). They can run it on their own computer, answer the questions, and send the recorded information back to the survey organisation.
Indeed, data can be collected in many different ways. The flexibility of Blaise allows for combining different methods in one survey. And because all interviewing software uses the same metadata definition, and thus the same questionnaire, consistency of the various interviewing modes is enforced. Moreover, Blaise also uses the same file formats for different modes, and tools are available to simply merge data files for further analysis. The current version of Blaise also supports computer-assisted web interviewing (CAWI). From the same data model, a web survey questionnaire can be generated. Two approaches to web interviewing can be implemented: the question-oriented approach and the form-oriented approach. The question-oriented approach can be applied for long and complex questionnaires that contain routing instructions (skipping and branching), and also checks on the provided answers. Carrying out such an interview requires continuous interaction between the computer of the respondent and the Internet server on which the interview software and data files are stored. Therefore, the respondent must be on-line during the entire interview. Each web page only contains one question. After the respondent has specified an answer, the information is sent to the server, and processed there. Depending on the outcome, the next question on the route is displayed, or a message in case an incorrect answer was given. The form-based approach can be applied for short and simple surveys with straightforward data entry without question routing. The web page contains all questions. It actually resembles a paper and pencil interview. The web page can be scrolled up or down to answer questions in any order. While filling in the form, no contact is required between the respondent and the Internet server. Therefore, it is also possible to do this off-line. After completing the form, contact is established with the server. The questionnaire data are sent, and possibly checked for consistency. Depending on the result, the session is finished, or the respondent can be requested to correct detected errors. Blaise also supports a hybrid approach. The questionnaire can be divided into a number of subquestionnaires. Each sub-questionnaire is offered as a form, with routing or checks. After a subquestionnaire has been completed, the data are sent to the Internet server, and processed there Depending on the outcome, a new sub-questionnaire is offered.
13
4. Plans and experiences 4.1.
The Business Tendency Survey
The first Internet survey test of Statistics Netherlands was carried out in 1998, see Roos et al. (1999). Objective of the test was to explore to what extent e-mail could be used to collect data for the Business Tendency Survey. This is a non-compulsory panel survey, where companies answer a short number of questions about production expectations, order-books and stocks. Traditionally data for this survey are collected by means of paper forms. In one wave, 1600 companies were asked to participate in the test. If so, they had to provide their e-mail address. About 190 companies agreed to participate. These were mainly larger companies with a well developed computer infra-structure. At the time, Internet browsers and HTML where not sufficiently developed and used to allow for and HTML-based questionnaire form. So, it was decided to send a simple ASCII text form by means of e-mail. After activating the reply-option, respondents could fill in answers in the text. It was a software-independent and platform-independent solution, but rather primitive from a respondent’s point of view. The test was a success. The response rate among the participating companies was almost 90%. No technical problems were encountered. Overall, respondents were positive. However, they considered the ASCII questionnaire old-fashioned, and not very user-friendly. 4.2.
The Survey of Construction
Following the success of the test with the e-mail survey described in section 4.1, it was decided in 1999 to carry out a test with Blaise IS, the first version of the Blaise System capable of generating web questionnaire forms. These HTML-forms could be handled by browsers like Internet Explorer 3.0 and higher, and Netscape Navigator 3.0 and higher. The target population was a group of approximately 1500 construction companies. This panel provides data for the monthly Statistics on Construction. Each month companies fill in a simple form consisting of three questions related to turnover and number of employees. In fact, three modes of data collection were offered: •
Companies with an e-mail facility, but without the possibility to surf on the web, filled in an e-mail form as described in section 4.1.
•
Companies with the possibility to surf on the web could choose for the on-line version of the questionnaire. This was the question-based approach, in which the answer to a question was sent to the Internet-server and checked before the next question was displayed on the screen.
•
Companies with the possibility to surf on the web could also choose for the off-line version of the questionnaire. In this case the whole questionnaire was contained in one HTML-form. This was send to respondents as an attachment in an e-mail. They could fill in the form offline. After completion, they press the submit-button to transmit the data back to the server.
14
The advantage of the on-line versions was that more checks and route instructions could be build in, leading to better data. Of course, the disadvantage was the respondents had to remain on-line while they were filling the form. The off-line version had the same questions, but no routing instructions were built in, and also the number of checks was limited. Of the 188 construction companies willing to participate in the test, ultimately 74% filled in an electronic form. This response rate was slightly higher than for the paper version of the survey. Of the responding companies, 23% had e-mail but no surf possibility. 38% had surf possibilities and chose for the off-line version. 39% had surf possibilities and chose for the on-line version. A small group of 8% responded otherwise. An evaluation of the test showed that respondents using the on-line version were not completely happy with the design of the electronic form. This was not what they expected from an electronic form. Some of the respondents also complained about the slow response times of the system. This was caused by the extensive checking and routing that took place. The overall conclusion of this and the previous test was that this way of data collection is certainly feasible, and that in cause of time it could make data collection more efficient and cost-effective. For more information, see Roos and Snijkers (1999). 4.3.
The E-Quest Project
The success of the test described in the previous two sections lead to the E-Quest Project., see Roos (2002). Objective of this project was to implement the use of Internet survey forms in the production environment for some 20 short-term panel business surveys. The questionnaire forms for these (monthly or quarterly) surveys are roughly the same, and mainly contain questions about turnover. Another objective of the project was to convince one-third of the 27,000 companies in the panel to participate in this form of electronic data transfer. After intensive efforts, about 7,000 companies agreed and supplied an e-mail-address. These companies were sent an e-mail asking whether they could surf on the web. The e-mail-only companies are sent (by e-mail) a monthly or quarterly reminder to fill in and return their questionnaire. The web-surfers are sent an e-mail with an HTML-form as attachment. Data encryption is used to keep the data confidential. 4.4.
Production Statistics Pilot
Currently, data collection for the system of Production Statistics still uses mainly paper questionnaires. Questions are stored in a database. Each questionnaire is constructed by building a Blaise data model from the information in the database. From the Blaise metadata both a paper questionnaire and a Blaise data entry program are generated. The data that are collected by means of the paper forms and are entered and edited using the data entry program. In October 2004, a pilot has started to find out whether electronic questionnaires can be used to collect data for the yearly production statistics, see Snijkers et al. (2004). Two approaches will be tested. The first approach is denoted by Electronic Data Reporting (EDR). It is a system for respondents to manage Blaise interviewing programs on their own computers. The EDRsoftware is sent to respondents on a CD-Rom. After the software has been installed, new survey 15
interviews can be sent to respondents by e-mail. These Blaise data models are automatically imported in the EDR environment. A simple click will start the interview. After off-line completion of the interview, the entered data are automatically encrypted and sent to Statistics Netherlands. The second approach is an on-line web survey. The survey questionnaire is generated from the same Blaise data model. Selected respondents will receive a letter with the address of the website and an authentication code. Respondents must be allowed to interrupt the interview, save the entered data, and continue at a later point in time. This is important because questions are often not filled in by one person in a company, but by various persons. Note that the web survey form can not be completed off-line. This is due to extensive checking and routing instructions. For the web-survey, the hybrid approach will be implemented. The questionnaire is divided into a number of sub-questionnaires. Each sub-questionnaire will correspond to one web page. There will be no routing instructions within such a sub-form. The pilot will be carried out in a sample of just over 100 companies in four different branches: transport of goods by road, ICT-companies, accountancy firms, and professional cleaners. 4.5.
CBSquest
Most web survey experiments of Statistics Netherlands have been carried out in the area of business surveys. This is not surprising, because penetration of computers and Internet facilities has been much bigger in companies than in households. Now that more and more households (65% in 2004) have access to these facilities, it has become worth while to investigate this means of data collection for households. A first step in this direction is the CBSquest Project, see Daas and Vis (2004). One objective of this project was to investigate whether electronic questionnaires can be used for groups in the population that are hard to reach in face-to-face surveys (they are almost never home) and in telephone surveys (unlisted number, mobile phone). Another objective was to explore possible cost reductions of this means of data collection. CBSquest consists of a set of programs and files that are sent to respondents on a CD-Rom. They install the software on their computer. Then they enter a user-identification, and the Blaise generated computer-assisted interviewing program is started. After having completed the questionnaire form, the data are sent back to Statistics Netherlands using the e-mail software on the computer of the respondents. Data are encrypted before they are transmitted. When they have completed their job, respondents can remove the CBSquest software from their computer in a simple way. For the first step a question module was used from the Integrated Survey on Living Conditions (POLS). This module contains a number questions about having a PC and using the Internet. To check whether the whole procedure of installing and using the software was technically correct, a test was carried out among a sample of 40 employees of Statistics Netherlands. This test was a success. The respondents did not experience major technical problems. Nevertheless, they made several suggestions for improvements in the system. In the second version of the system, data is
16
not transmitted any more using the e-mail software of the respondent. Instead, the browser takes care of it. 4.6.
Consumer Sentiments Survey
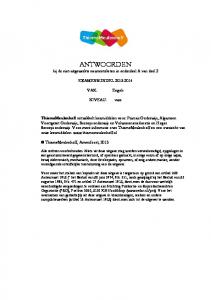
As a next step in the process of introducing web surveys for households, an electronic version of the Consumer Sentiments survey will be developed. This questionnaire will be offered to ‘real’ respondents. The test will concentrate on investigating possible mode effects, i.e. will the change from telephone survey to web survey result in respondents giving different answers. The test must also give more insight into the maximum number of questions that can be asked in a web survey form. Some experts sat the numbers of questions should not exceed 30. Among the potential advantages of conducting web surveys is the possibility to new ways of recording answers on a numerical scale. This can be done entering a numerical value or selecting a radio button (for e.g. a five-point scale), but also use of a slider may be considered, see figure 4.6.1. Use of a slider avoids mistakes like entering alpha-numeric characters, or outof-range values. Experiments with various answer modes will also be included in the test.
Figure 4.6.1. Use of a slider to answer a numeric question What is your age? Click the left mouse button on the slider button. With the mouse button pressed, move the slider button to the left or to the right until you see the proper answer in the input field.
5. Discussion Internet surveys form an interesting new possibility for national statistical institutes to collect data. They seem to be a fast, cheap and attractive means of collecting large amounts of data. However, there are methodological problems. These problems are partly caused by using the Internet for selecting respondents, and partly by using the web as a measuring instrument. If these problems are not seriously addressed, Internet surveys may result in low quality data for which no proper inference can be made with respect to the target population of the survey. National statistical institutes can use Internet data collection both for economic and social surveys. Due to the high penetration of computers in businesses, first experiments have taken place here. From the results it is clear that various ways of collecting data over the Internet (email, off-line, on-line) are technically feasible. Consequently, this mode of data collection will gradually find its way in the normal production processes of business statistics, particular for business surveys with only a small number of questions.
17
Currently, coverage of Internet access for households still is a problem. In 2004, about 65% of the households in the Netherlands had access to the Internet. Figure 5.1 shows a positive trend over the last couple of years (source: www.cbs.nl). One can expect an even higher coverage in the future.
Figure 5.1. Percentage of households with Internet 70
65
60
58
59
2002
2003
48
50 38
40 Percentage 30 20
23 14
10 0 1998
1999
2000
2001
2004
Year
It should be noted that other modes of data collection also have their coverage problems. For telephone surveys, Statistics Netherlands can only uses listed telephone numbers. Recent research, see Cobben (2004), shows that approximately 66% of the Dutch have a listed telephone number. This percentage is decreasing. Hence, over one-third of the people cannot be contact in a telephone survey, and this will be worse in the future. It is expected that for the time being household web surveys will be part of a mixed-mode design. The web-mode of the survey may be successful where other modes fail. The advantage of the web-mode is that respondents can determine their own moment in time to fill in the questionnaire. This mode may particularly be successful for groups in the population that are hard to reach in face-to-face surveys (they are almost never home) and in telephone surveys (unlisted number, mobile phone). For the long run, it should be investigated whether or not single-mode web surveys are feasible. Coverage problem will diminish, but never disappear completely. Advanced adjustment weighting techniques may help to reduce the effects of coverage errors. For some variables (e.g. use of the Internet) adjustment weighting will have no effect, but for many other variable that are less strongly related with this mode of data collection, it may be possible to improve the quality of estimates. Single-mode web surveys may turn out to be less costly than CAPI or CATI surveys. Cost reductions are possible because no interviewers are required to carry out the fieldwork. This means that budget becomes available that can be spend on incentives, thus increasing response rates. A proper design of a web survey questionnaire is crucial for the quality of the data that is collected with it. Layout of the questionnaire, question wording, type of expected answer, ease 18
of navigation, speed of processing, and browser compliance are all factors that may have an impact on measurement errors and response rates. Therefore, careful attention must be paid to these cognitive aspects in the design stage of the web survey instrument. See also Bethlehem and Hoogendoorn (2003). For example, there are different ways of displaying the possible answer s to a closed question, and selecting one of them. Examples are displayed in figure 5.2. Figure 5.2. Various ways of displaying a closed question
The solution on the lower left uses radio buttons, and the other ones use drop-down boxes. All forms have their advantages and disadvantages. More research is necessary. Many household survey questionnaires are long and complex (in terms of routing and checking). This faces the researcher with the dilemma of either offering the survey form on-line (allowing extensive routing and checking computations to be carried out on the server, but also increasing connection costs and risks for the respondent), or offering it off-line (thus limiting routing and checking possibilities, but also reducing costs and risks). The on-line approach should be preferred from the point of view of data quality. Fortunately, Internet users increasingly have broadband-access. Figure 5.3 shows the type of Internet connection Dutch households had in 2002, 2003 and 2004 (source: www.cbs.nl). The percentage of households with slow modems has rapidly decreased from 60% to 37%. And the percentage of broadband connections has more than doubled, from 24% to 49%. About two out of every five broadband connections is an ADSL connection. ADSL is typically more prominent in urban areas. The other connections are cable Internet connections. They are predominant in rural areas. So, there is development in the right direction (nearly a half of the households has a broadband connection), but the ideal situation (broadband for everybody) will still take some years.
19
Figure 5.3 Type of Internet connection that households have 70 60
60 50
50
49
40
34
Percentage 30 20
Modem ISDN Broadband
37
24 18
16
14
2002
2003
2004
10 0 Year
Particularly if the web survey instrument is part of a mixed-mode design, it is important to have the proper technical environment for executing the survey in a consistent and effective way. Multi-mode survey software systems like Blaise may help in this respect. A final problem of web surveys that should be mentioned here is authentication. When someone is invited to complete a web survey questionnaire, there is no guarantee that this person will really answer the questions, and not someone else in the household. Note that this problem is not specific for web surveys. It is a general issue for all self-completion survey questionnaires, and the problem may also come up in telephone surveys. For web surveys, the developments in ICT (web cams, biometrics, and digital signatures) may (in time) solve this problem. In conclusion, it will be clear that the web surveys present an interesting new possibility for data collection by national statistical institutes. However, research is still necessary in order to turn it into a full-grown, well-established mode of data collection.
6. References Bethlehem, J.G. (1988), Reduction of the nonresponse bias through regression estimation. Journal of Official Statistics 4, pp. 251-260. Bethlehem, J.G. (1997), Integrated Control Systems for Survey Processing. In: L. Lyberg et al., Survey Measurement and Process Control. Wiley, New York, pp. 371-392. Bethlehem, J.G. (1999), Cross-sectional Research. In: H.J. Adèr and G.J. Mellenbergh, Research Methodology in the Social, Behaviuoural & Life Science. Sage Publications, London, pp.110-142. Bethlehem, J.G. and Hoogendoorn, A.W. (2003), Methodological guidelines for Blaise web surveys. Proceedings of the 8th International Blaise Users Conference, IBUC 2003, Copenhagen, Denmark, pp. 91-124.
20
Cobben, F.(2004), Nonresponse correction techniques in household surveys at Statistics Netherlands: a CAPI-CATI comparison. Technical report, Statistical Netherlands, Methods and Informatics Department, Voorburg, The Netherlands. Couper, M.P. (2000) , Web surveys: A review of issues and approaches. Public Opinion Quarterly 64, pp. 464-494. Couper, M.P., Baker, R.P., Bethlehem, J.G., Clark, C.Z.F., Martin, J., Nicholls II, W.L., O’Reilly, J.M. (eds.) (1998), Computer Assisted Survey Information Collection. Wiley, New York. Daas, P. and Vis, R. (2004), Verslag Pre-test Zelfstartende Vragenlijst (CBSquest). Report H2386-04-TMO, Methods and Informatics Department, Heerlen De Haan, J., Huysmans, F. and Steyart, J. (2002), Van huis uit digitaal: verwerving van digitale vaardigheden tussen thuismilieu en school. Sociaal en Cultureel PlanBureau, Den Haag. De Leeuw, E. and Collins, M. (1997), Data collection methods and survey quality: an overview. In: L. Lyberg, P. Biemer, Collins, M., De Leeuw, E., Dippo, C., Schwarz, N. and D. Trewin (eds.), Survey Measurement and Process Quality. Wiley, New York. Dillman, D.A., Phelps, G., Tortora, R., Swift, K. Kohrell, J. and Berck, J. (2001), Response Rate and Measurment Differences in Mixed Mode Surveys using Mail, Telephone, Interactive Voice Response and the Internet. Report, Social and Economic Sciences Research Center, Washington State University, Pullman, WA. Dillman, D A. Bowker, D. (2001), The web questionnaire challenge to survey methodologists. In: Reips, U.D. and Bosnjak, M. (eds.), Dimensions of Internet Science, Pabst Science Publishers, Lengerich, Germany. Fricker, R. and Schonlau, M. (2002), Advantages and disadvantages of Internet rsearch surveys.: Evidence from the literature. Field Methods 15, pp. 347-367. Heerwegh, D. and Loosveldt, G. (2002), An evaluation of the effect of response formats on data quality in web surveys. Paper presented at the International Conference on Improving Surveys, Copenhagen, 2002. Horvitz, D.G. en D.J. Thompson (1952), A generalization of sampling without replacement from a finite universe. Journal of the American Statistical Association 47, blz. 663-685. Kish, L. (1967), Survey Sampling. Wiley, New York, USA. Roos, M. (2002), Methods of Internet Data Collection and Implications for Recruting Respondents. Invited paper, EDR Conference, Geneva. Roos, M, Jaspers, L. and Snijkers, G. (1999), De Conjunctuurtest via Internet. Report H435099-GWM, Statistics Netherlands, Data Collection Methodology Department. Heerlen. Roos, M and Snijkers, G. (1999), Blaise IS in de Bouw. Report H4435-99-GWM, Statistics Netherlands, Data Collection Methodology Department. Heerlen. Snijkers, G., Tonglet, J. and Onat, E. (2004), Projectplan Pilot e-PS. Internal Report H3424-04BOO, Development and Support Department, Division of Business Statistics, Statistics Netherlands, Heerlen.
21