Sep 9, 1994 - k j < k kkk k for some 2 R p. (A.5) so a lower bound on the distance ..... Dame, Indiana, 1989. 28] R.C.Younce and C.E.Rohrs, Identi cation with ...
Rapproachment Between Bounded Error and Stochastic Estimation Theory Brett M. Ninness 1 and Graham C. Goodwin September 9, 1994
ABSTRACT
There has been a recent surge of interest in estimation theory based on very simple noise descriptions; for example, the absolute value of a noise sample is simply bounded. To date this line of work has not been critically compared to pre-existing work on stochastic estimation theory which uses more complicated noise descriptions. The present paper attempts to redress this gap by examining the rapproachment between the two schools of work. For example, we show that for many problems a bounded error estimation approach is precisely equivalent in terms of nal result to the stochastic approach of Bayesian estimation. We also show that in spite of having the advantages of being simple and intuitive, bounded error estimation theory is demanding on the quantitative accuracy of prior information. In contrast, we discuss how the assumptions underlying stochastic estimation theory are more complex, but have the key feature that qualitative assumptions on the nature of a typical disturbance sequence can be made to reduce the importance on quantitative assumptions being correct. We also discuss how stochastic theory can be extended to deal with a problem at present tackled only by bounded error estimation methods: the quanti cation of estimation errors arising from the presence of undermodelling.
Technical Report EE9241 Department of Electrical and Computer Engineering, University of Newcastle, Callaghan 2308, AUSTRALIA
1 The author is grateful to the Centre for Industrial Control Science at the University of Newcastle, Australia and the Australian Telecommunications and Electronics Research Board for Scholarship Assistance.
1 Introduction
1
1 Introduction The mainstream of estimation theory to the present date relies on modelling any disturbances corrupting observed data via random variable descriptions [12, 20, 35]. This necessitates speci cation of probability density functions and correlation information for the random variables making up a disturbance sequence. A variety of theoretically sound estimation schemes have been developed from this framework such as Maximum Likelihood, Least Squares and Bayesian techniques. The choice of scheme depends on the application. For example, if the desire is to nd feasible regions for the parameters of a system, then it is possible to use Bayes' rule to nd the probability density function for these parameters conditional upon observed data. For the case when the disturbances can be taken to have Gaussian distributions this approach is very popular since the relevant calculations are very easily performed by running a Kalman lter. Unfortunately, when the disturbances are not Gaussian distributed, then the calculations can be very complex. For example, in general it will not be su�cient to just keep track of the rst two moments of the conditional distribution as the Kalman lter does. In these cases the usual approach is to choose a simpler estimation scheme, such as least squares, and then use the Central Limit Theorem to obtain information on the distribution of the estimate. This leads to con dence regions for the parameters. A de ciency with this paradigm is that the con dence regions provide only soft, not hard bounds, even when the disturbance may satisfy a hard bound. Furthermore, these con dence regions only apply as the amount of observed data tends to in nity. It is di�cult to determine how reliable they are for nite data. Motivated by these and other issues a large body of work has emerged under the title of `bounded error' estimation theory [33, 6, 7, 23, 24, 25, 19, 18, 16]. By comparing assumptions to observed data an ingenious solution to the parameter bounding problem is obtained by only calculating the support for the a-posteriori distribution of the parameters. For many cases of practical signi cance the algorithms involved are simple. Furthermore, the assumptions on disturbances are minimal. No probability density functions need be speci ed; only a bound on the magnitude of the disturbance need be known. The attraction of these minimal assumptions has resulted in rapid progress in the bounded error estimation area with little re ection on the rapproachment between these new methods and pre-existing estimation methods based on stochastic disturbance models. The work in [17, 32] are examples of such re ection and this paper is intended for the same area. For example, we show that for problems expressible in linear regressor form, the feasible parameter set obtained by bounded error estimation methods is precisely the support of the posterior probability density for the parameters calculated by Bayes rule in the special case of the random variables modelling the disturbance sequence being independent. That is, for a large class of problems, bounded error estimation methods can be considered as a special case of stochastic estimation - Bayesian estimation when the disturbance is an independent process. The motivating idea of bounded error estimation theory is the minimal assumptions it makes on disturbances. As we shall discuss, a consequence of these minimal assumptions is that the resultant parameter bounds can be sensitive to the disturbance bound regardless of how much data is observed. In contrast, when stochastic models for disturbances are used then con dence intervals tend to be insensitive to prior quantitative speci cations on disturbances, and the sensitivity decreases with the amount of observed data. For example the quantitative speci cations can, if necessary, be estimated with increasing accuracy as the amount of available data grows. This is intriguing and we trace the phenomenon to the fact that the more complex stochastic model is able to account for the `on-average' nature of the disturbance. We conclude that if one can make qualitative assumptions on the average properties of a disturbance sequence, then a stochastic model for the disturbance can be employed to allow quantitative properties of the disturbance sequence, such as bounds, to be estimated from the available data. We also examine, via example, how the complex density function for least squares estimates from nite data can be approximately calculated. This leads to the observation that the convergence in the central limit theorem can in some cases be very rapid so that con dence intervals can be accurate even for short data lengths. These results suggest that depending on the application, both stochastic and bounded error estimation methods have their place; the choice of paradigm depending chie y on a tradeo�
2 A Motivating Example
2
between the required accuracy of qualitative information and quantitative information. If one can make qualitative assumptions about the on-average properties of a disturbance realisation, then a stochastic framework seems appropriate. If such assumptions cannot be made then a bounded error approach may be appropriate. An important example of where this decision of framework must be made is the problem of providing parameter bounds that take into account undermodelling for the subsequent purpose of robust controller design. The mainstream approaches to this problem [37, 30, 29, 31, 21, 14, 15, 28] draw on bounded error estimation ideas in their solution to the problem. However, as discussed, the cost of the simple disturbance models used is sensitivity to the quantitative accuracy of the bounds assumed for disturbances and undermodelling. Consequently, the robust controller for a plant arrived at via these mainstream approaches will be sensitive to prior information about the plant. This contradicts the original ambit of robust design which is to achieve insensitivity to prior information. To obtain the required insensitivity we detail an appropriate random variable description of the undermodelling which allows a stochastic approach to the problem. These ideas have been discussed, but not compared to bounded error methods, in [22, 10, 11, 13, 8]. The key idea in this new approach is to nd bounds that apply not only over a chosen class of disturbance sequences, but also over a chosen class of undermodellings. In the current paper we go on to explain, as in [9], how parameters describing the undermodelling need not be speci ed a-priori; they can be estimated from the data if certain qualitative assumptions on the nature of the undermodelling are made. We conclude by reporting some of the results of [1] that examine the success of such a scheme.
2 A Motivating Example
We begin with a simple scalar motivating example; namely estimation of a xed scalar value �0 in the presence of bounded disturbances: yk = � 0 + �k (1) Here fyk g is our observation sequence and f�k g is the disturbance sequence. Suppose that each realization of �k is bounded: j�k j � � � 2 R+ (2) In most cases we will not a-priori know the bound � exactly, but we will be able to nd an overbound � > �. The key idea of bounded error estimation theory is to identify feasible parameter sets that are consistent with observed data fyk g and the assumed disturbance bound �. Using this principle we will never be able to nd �0 to an accuracy greater than �j� ? �j. Speci cally, the most informative observations for the purposes of bounded error estimation will be y+ = �0 + � and y? = �0 ? �. If we are lucky enough to get these observations then we can conclude (at best) � ? �0 2 D = [� ? �; � ? �] (3) Furthermore, after observing y+ = �0 + �, y? = �0 ? � we can never reduce D, no matter how much more data we observe. Additionally, the size of D is linearly related to the assumption �. This is in contrast to the case where a zero mean random variable description is appropriate for f�k g. Within this framework a con dence interval is generated which shrinks around the true value �0 as the amount of observed data grows. This necessitates more complicated assumptions on disturbances. A probability space f ; F ; Pg is assumed to model the e�ects of nature. The disturbance model is that an event ! from nature arises to result in a particular disturbance realisation via the random variable R mapping �k (! ). The likelihood of whole sets of events A 2 F � is determined as P(A) = X � (x)f� (x)dx where �k (A) 7! X 2 R and f� is the probability density function of � . An appropriate f� re ecting the assumption (2) is the uniform density ( 1 (4) f� (x) = 2� ; x 2 [0; �] 0 ; otherwise
2 A Motivating Example
3
Under this more complicated stochastic model we can adopt a Bayesian approach to the problem by calculating the probability of � given observed data fy1 ; � � � ; yN g. This is given, modulo a constant normalizing factor as P(�
j y1; � � � ; yN ) = P(y1; � � � ; yN j �)P(�)
(5)
and by the de nition of conditional probability P(y1 ;
N Y
� � � ; yN j � ) =
k=1 N Y
=
k=1
P(yk
j y1; � � � ; yk?1 ; �)
(6)
P(yk
j �)
(7)
where the last line follows by assuming independence of the f�k g process to give P(�
j y1 ; � � � ; yN ) = P(�)
N Y k=1
P(yk
j �)
where P(yk j �) has corresponding density function ( 1 fyk j� (x) = 2� ; jx ? �j < � 0 ; otherwise
(8)
(9)
Therefore, due to the product nature of (8), the a-posteriori density for �,f�jY will only be non-zero on the set � given by �=
N \
k=1
�k
�k , f� : jyk ? �j � �g
(10)
This set � is precisely the set D calculated by the bounded error estimation method we previously discussed. This latter method is thus subsumed by the stochastic approach of Bayesian estimation under the special assumption of disturbances being independent. Of course, under a stochastic disturbance model many other estimation schemes are possible such asPmaximum likelihood and least squares. For this scalar example the least squares estimator �^ = N1 Nk=1 yk for �0 results in the estimation error �~ , �^ ? �0 being a random variable given by X (11) �~N (!) = N1 �k (!) k=1 It is well known that if the �k are assumed independent we can nd the density function f�~(�) by convolution [38]: # "
f�~(�) = where [f� (x) f� (x)] (�) =
N O k=1
Z
f� (x) (�)
(12)
f� (� ? x)f� (x)dx
(13)
1 ?1
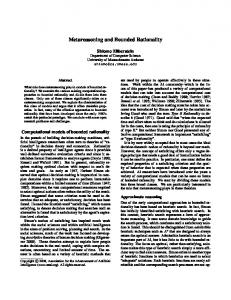
If we know � exactly as � = 0:5 and look at data lengths of N = 1; � � � ; 4 then the corresponding densities f�~ are shown in gure 1. As can be seen, after only 4 terms the true density function obtained by convolving the uniform density function (9) is almost indistinguishable from a Gaussian. This illustrates that extremely quick convergence in central limit theorems is possible if the true variance is known. The feasible parameter set is then taken to be the set in � space centered on �^N where f�~(�) is greater than some tolerance �. The smaller � is made, the less stress is placed
2 A Motivating Example
4 3
1.5 1
2
0.5 1
0 -0.5 -1
-0.5
0
0.5
1
0 -1
-0.5
N=1
0
0.5
1
0.5
1
N=2 3
2.5 2
2
1.5 1
1
0.5 0 -1
-0.5
0 N=3
0.5
1
0 -1
-0.5
0 N=4
Figure 1: Illustration of how quickly the density function for the average of independent random variables converges to the Gaussian density function. The solid line is the true density function, the dashed line is a Gaussian distribution with the same variance. The dotted line is a closed form approximation to the true density. upon quantitative assumptions being correct, but the larger the consequently more conservative parameter set D will be. If we consider the more realistic case of the bound � = 0:5 not being known exactly so that a conservative overbound � = 0:8 is assumed then the estimation results are shown in gure 2 for data lengths of N = 1; 2; 3; 30. The vertical dash-dot lines indicate the optimum feasible parameter set D that can be provided by bounded error estimation theory (see (3)). However, we see that after we have observed only 30 data points the density function shown as the curved dashed line, will allow us to conclude a set D smaller than that provided by bounded error estimation theory. The size of the feasible parameter set D is not sensitive to precise knowledge of � and the sensitivity decreases as more data is observed. The averaging of the least squares estimator provides robustness under a random variable model that is able to exploit this averaging. Furthermore, this con dence interval set will be obtained every time we do such an experiment, whereas to get a minimal size for the set D from bounded error estimation theory we need a very lucky set of observations. This latter set will not decrease in size as the number of observations grows, whereas for xed � the set D obtained from the density function will shrink. Finally, and perhaps most importantly, we note that the density function f�~(�) tells us that some values of � within D are far more worthy of our consideration than others. Given this example, we move on to the general class of problems we would like to consider, namely data generated as: yk = �Tk �0 + �k (14) where �k is a vector of known regressors, fyk g is an observed output realization, �0 is a vector of parameters to be estimated, and f�k g is a bounded disturbance sequence. We assume �k to be of
2 A Motivating Example
5
1
2.5
0.8
2
0.6
1.5
0.4
1
0.2
0.5
0 -1
-0.5
0
0.5
0 -1
1
-0.5
0
N=1
0.5
1
0.5
1
N=2 8
2.5 2
6
1.5 4 1 2
0.5 0 -1
-0.5
0
0.5
0 -1
1
-0.5
0
N=3
N=30
Figure 2: Illustration of the utility of using distribution functions for nding bounds on D. The solid
line is the true density function, the dashed line is a Gaussian distribution with the same variance. The vertical dash-dot lines give that smallest D that bounded error estimation theory can provide under conservative assumed disturbance bound � = 0:8 when the true value is � = 0:5.
the form:
�
�
�Tk = B1 (q?1 )uk ; � � � ; Bp (q?1 )uk (15) ? 1 ? 1 where the Bk (q ) are stable functions in the backward shift operator q and fuk g is a known input sequence to the system. Note that for simplicity we are not considering the case of ltered versions of fyk g appearing in �k since this leads to awkward feasible sets D for �0 [19]. In this case the generation of feasible parameter sets D consistent with bounded noise assumptions and observations is a well studied problem [7, 16, 24, 23] which can be most accurately solved as a linear programming problem that nds D as
D=
N \
k=1
Dk
(16)
where Dk is the area in � space between two hyperplanes: � Dk = � 2 Rp : ?� � yk ? �Tk � � � (17) The resulting polytope D can be found o�-line by linear programming, can be calculated on-line recursively [25] or, as is more usual, overbounded by an ellipsoid [23]. Whatever the method, if we assume the bound j�k j � � when in fact the true bound is j�k j � � where � < � then we have the following lower bound on how small D can be made: Theorem 1. De ne d as the diameter of the largest ball that can be placed inside D. Assume the energy in the regressors is bounded as k�k k2 � �� . Then (18) d > 2(��? �) > 0 �
2 A Motivating Example
6
Proof. See Appendix A
222
As in the preceding scalar example, if we employ an independent random variable modelling for the disturbance �k with density given by (4), then a Bayesian approach to the estimation problem involves using (8) together with ( 1 T fyk j� (y) = 2� ; jy ? �k �j � � (19) 0 ; otherwise so that again, the product in the expression (8) means that the posterior density for � is only non-zero on the domain D given by (16) and (17). Therefore, for the linear regression model (14) and (15) we see that bounded error estimation is subsumed by a stochastic estimation method: Bayesian estimation when the random variables modelling the disturbance sequence are independent. As in the preceding scalar example we examine the properties of another estimator that has been well studied in a stochastic framework: the least squares estimate of �0 given by NX ?1 �k y k �^N = PN?1 N1 k=0 NX ?1 PN = N1 �k �Tk k=0
(20) (21)
Combining (20) and (21) with the model (14) gives the estimation error as
�~N = PN?1 N1
NX ?1 k=0
�k � k
(22)
In the case where the disturbance is an independent sequence then use of the Central Limit Theorem [20, 35] gives2 .
p
3N P 1=2 (�^ ? � ) ?! D N (0; I ) as N ! 1 (23) � N N 0 This allows us to generate ellipsoidal con dence regions for �~ by recognising that quadratic forms of Gaussian random variables are �2 distributed: 3N (�^ ? � )T P (�^ ? � ) ?! D �2 as N ! 1 (24) N 0 N N 0 p 2 � where p = dim �0 . In the case of xed con dence level the size of the ellipsoidal con dence region for �0 may be measured by VN , the sum of the lengths of the principle axes and will obey 2 (25) VN / 3�N Tr fPN g If the input is of nite power then PN will tend to a constant < 1 [20] so we have that the sensitivity of the size measure VN to knowledge of � is 1 @VN / 2 (26) � @� 3N That is, the sensitivity decreases linearly with increasing data. This is in contrast to the result of Theorem 1 where no sensitivity decrease occurs. Additionally, it is well known that the variance 2 Note with f� as de ned in (4) we have Varf�k g = �2 =3
2 A Motivating Example
7
of measurement noise can be estimated from prediction error residuals. This leads to an estimate �^N of � which can be estimated from N observed data points as v u u t
N ?1
X (27) �^N = N 3? p (yk ? �Tk �^N )2 k=0 This estimation ability for � further decreases the stress on prior assumptions on � being correct. All these results on least squares estimation do, however, require a qualitative assumption to be correct. The average over a typical sample path for a disturbance sequence must be near zero. If this is not the case then perhaps one can achieve it by adding an o�set term in the parameter vector �0 to be estimated. If this still doesn't seem a reasonable model for an expected disturbance sequence then perhaps a bounded error estimation method is a better approach to the problem. The point is to recognize that if one can make a qualitative assumption that disturbances wander evenly around zero, then the stress on the quantitative assumption of � being correct can be lessened by estimating � and/or using an estimator that averages the data in an e�ort to reduce the e�ect of the disturbance. As mentioned in the introduction, these results on least squares estimation only provide soft bounds and these soft bounds only apply as the amount of data is allowed to increase to in nity. If one requires bounds that apply for nite data under a stochastic disturbance model then the probability density of �~N is required. In the case of independent disturbance sequences this can be accurately approximated via a Fourier expansion in Hermite polynomials [5]: Theorem 2. For scalar � and f� (x) given as in (4), the density function f�~(�) for the estimation error �~N for nite N can be approximated by a Gaussian density multiplied by a correction term "(�). � � 1 f�~(�) � � � �� "(�) (28)
where
"(�) , m4 , and
"
1 � m4 ? 3� 1 + 24 �4
�
� PN
�4
2 4
N X
� �4
� �
� �2
? 6 ��
N X N X
!#
+3
(29) 3
1 �4 + 2 2 2 2 25 5 k=1 k 3 k=1 j>k �k �j (1 ? 3 ln �k �j )
2 �2 = 3�P
N
PN =
N X k=1
�2k
(30) (31)
where �(x) is the standard normal density function and N is the number of observed data points. Proof. See Appendix B 222 If we apply this result to the scalar motivating example where �k = 1 we obtain for N = 10 � �2 � �" � �4 # � 1 � f�~(�) � � � � 0:985 + 0:03 � ? 0:0005 �� (32)
Therefore, for j�=�j < 1 the true density function is very close to the Gaussian suggested by the Central Limit Theorem even though N = 10 is so few observations that one may not expect an asymptotic result to hold with accuracy. For j�=�j > 1; �(�=�) becomes very small so the multiplicative correction term is not important for the calculation of con dence regions. To illustrate the accuracy of the approximation (32) it is plotted as a dotted line in gure 1 and should be compared to the solid line, which is the true density. The agreement is quite close indicating that in the case of an independent disturbance process it is possible to accurately calculate hard bounds for the least squares estimation error and to calculate the probability density within these bounds.
3 Multivariable Simulation Example
8
3 Multivariable Simulation Example We now wish to introduce a simulation example which will be carried through the remainder of the paper. The following continuous time system, sampled with period 1 second, was simulated : 1 G(s) = (10s + 1)( s + 1) The test input sequence fuk g was a 0.02 Hz fundamental square wave. The output of this system was corrupted with a noise sequence f�k g distributed uniformly as in (4) with � = 0:1. One hundred and fty samples of data were collected, the rst one hundred were used to get rid of initial condition e�ects in the simulated plant and regressor lters, and the last fty were used for least squares model tting. A 2nd order model of the form: � ?1 ?1 ?1 � yk = (1 �+1 q�q?1 ) + �2 q (1(1+?�q(2?+1 )�2)q ) uk (33) was tted to the data using least squares. Here � = ?0:8 was chosen (between the true system poles). Note that the unusual regressors are motivated by Laguerre polynomials [36, 26]. The resulting least squares estimates were: �^1 = 0:5104 �^2 = 0:3471 (34) The Bounded error estimates were found recursively via the ellipsoidal overbounding methods obtained by Fogel and Huang [7] with an assumed disturbance bound of � = 0:1. This algorithm appears to be one of the more popular methods of obtaining simple ellipsoidal feasible parameter sets in bounded error estimation theory. The results are shown in gure 3. The top left plot shows the observations fyk g together with the response of the identi ed plant parameterized by (34). The p top right plot shows the evolution of � det Pt which indicates the volume of the overbounding set Dt given in Fogel and Huang's algorithm. The bottom left plot shows the data weighting sequence �k involved in the algorithms. In this simulation it indicates that the data sequence is highly informative, Dk being re ned on almost every sample. Finally, the lower right plot shows the prediction error residuals demonstrating that � = 0:1 was a valid bound to assume. Feasible parameter T sets for this simulation example are shown in gure 4. The true feasible parameter set D50 = 50 k=1 Dk is the small polytope formed by the intersection of the straight lines. The largest ellipse is the ellipsoidal overbounding region for this polygon obtained by Fogel and Huang's algorithm. The smallest ellipse is the set motivated by the central limit theorem result (24): 3N �~T P �~ � 50 (35) �2 N where PN is given in (21). That is, the smallest ellipsoid is found by assuming �~ has a density function f�~(�) approximately that ofRthe Gaussian density shown in gure 5. The boundary of D is taken to be the values of �~ where D f�~(�) > 0:99995 and f�~ is taken to be a �2 density with 2 degrees of freedom. We chose a value very close to 1:0 in order to approximate a hard bounded set. As can be seen, this set is a good indication of the true feasible parameter polytope. This supports our claim that it is possible to obtain useful hard bound information in a stochastic framework by choosing the con dence region to be one of probability almost 1:0. Note that the con dence region is chosen on the assumption that the disturbance sequence is zero mean and independent. In the present simulation example this will not be the case due to the in uence of undermodelling - the restricted xed denominator model set we chose does not contain the `true' system we simulated. The fact that the the con dence regions are informative even though the stochastic assumptions are not exactly satis ed indicates a robustness property of stochastic analysis that we believe has in large part been responsible for its popularity and acceptance. It is also interesting to note the conservatism of the Fogel and Huang overbound which indicates the utility of approaches [25] to calculate the true polytopal feasible parameter set.
4 Undermodelling, Bounded Error Estimation, and Stochastic Embedding 1
True and Model response
1
9
Volume of Ellipsoid
0.9
0.5
0.8 0 0.7 -0.5
0.6
-1 0
50
0.5 0
Time (s) 1
20
40
60
Time(s)
Scaling Factor rho
0.1
Prediction Error
0.05
0.5
0 0
-0.05
-0.5 0
50 Time(s)
-0.1 0
50 Time(s)
Figure 3: The top left plot shows the true plant response compared with that of its least squares
identi ed model. The top right plot shows the evolution of the volume of the recursively calculated bounding ellipsoid using the algorithm of Fogel and Huang, while the bottom left plot shows the evolution of the weighting parameters �k . The bottom right plot shows the prediction residuals of the least squares identi ed system.
4 Undermodelling, Bounded Error Estimation, and Stochastic Embedding An important problem that has been addressed by application of bounded error estimation theory is the problem of quantifying the errors in estimated frequency responses that arise due to undermodelling. The motivation is the desire to employ robust methods in the design of control systems. This robust theory requires estimated frequency responses to be provided with bounds on any errors in their speci cation. The mainstream of thought on this problem is to suppose a-priori restrictions on quantities such as the smoothness or magnitude of any unmodelled dynamics (usually in the frequency domain) and then translate this information into pointwise bounds on any output mismatch that will occur due to the use of a restriced complexity model. This becomes a bounded disturbance. Thus the problem seems perfectly set up for bounded error estimation theory to be applied in order to nd bounds on the undermodelling induced bias errors in �. There are many examples of this approach covering a gamut of di�erent model structures, undermodelling descriptions and methods of translating time domain to frequency domain bounds. See [28, 29, 31, 37, 2] for examples. However, as Theorem 1 indicates, the bounds arrived at will be sensitive to prior knowledge of the undermodelling induced bounded disturbance, and hence will be sensitive to prior knowledge of the undermodelling itself. Moreover, these bounds are intended for use in robust controler synthesis whose mandate is to provide closed loop performance that is insensitive to the accuracy of prior information on the system to be controlled. There appears to be a contradiction here. In an e�ort to overcome this contradiction while still providing useful results, the current
4 Undermodelling, Bounded Error Estimation, and Stochastic Embedding
10
Feasible Sets 0.7 .. .. .. .. .. .. .. .. .. .. .. .. .. .. .. .. .. ... .. ........... ... ................................................ . .. ......... ... ........ .. . ............ .......... ...... x ... .............. . ........... ... ................ ..... ..... ....... .... .
0.6
theta_2
0.5
0.4
0.3
0.2
0.1
0 -0.2
0
0.2
0.4
0.6
0.8
1
1.2
theta_1
Figure 4: Feasible parameter sets for the previous simulation. Largest ellipse is obtained via Fogel and Huang's algorithm. Polygon is the true feasible parameter set that the largest ellipse is attempting to approximate. Smallest ellipse is the 99:995% con dence region obtained by the Central Limit Theorem. The cross marks the least squares estimate of the parameters. authors and others [11, 8, 9] have explored the possibility of embedding the description of the undermodelling in a stochastic framework in an e�ort to reduce the sensitivity to prior information. At rst this may seem inappropriate since the e�ects of undermodelling are manifestly di�erent from those we normally associate with noise which is modelled via a random variable description. However, the association of probability theory with notions of randomness is largely historical. Indeed, as Catlin [4] points out, `a random variable [�k (!)] is like the Holy Roman Empire- it wasn't holy, it wasn't Roman and it wasn't an Empire. A random variable is neither random nor variable, it is simply a function', The key issue is that we need to provide error bounds that apply over an ensemble of di�erent undermodellings. The solutions using bounded error estimation theory is to use hard bounds valid for all undermodellings. The stochastic embedding approach we are about to describe amounts to working with weighted averages over the ensemble of possible undermodellings. That we choose to do this averaging over a probability space and with a weighting that corresponds to a probability measure is essentially co-incidental. To be speci c, we assume that for some �0 2 Rp and for the chosen model set we can write the true frequency response as
GT (e?j 2�f ) = G(e?j 2�f ; �0 ) + G� (e?j 2�f ) (36) where G(e?j 2�f ; �0 ) is the frequency response of a p dimensional model parameterised by �0 and G� (e?j 2�f ) is the frequency response of any `unmodelled dynamics' not explained by G(e?j 2�f ; �0 ). Here we have used the symbol f for cyclic frequency normalised with respect to the sampling frequency since we don't want confusion with ! 2 the probability space. The key idea of the stochastic embedding approach is that we now assume that G� (e?j 2�f ) can
4 Undermodelling, Bounded Error Estimation, and Stochastic Embedding
11
Gaussian Distribution
$3N/(delta^2)x^T P^{-1}x = 50$ Value
15 10 5
0.1 0.05 -0.1
0
-0.05 0
-0.05 0.05 0.1
-0.1
theta_2
theta_1
Figure 5: The multivariable density function used in nding the feasible parameter set in the stochastic case. It was formed by intersecting a plane at the level of the arrow 3N=�2 xT P ?1 x = 50 with the Gaussian surface.
be modelled as a function on the measure space f ; F� ; P� g. This does not imply that G� (e?j 2�f ) is random. It is merely convenient to index the ensemble of possible undermodellings by ! 2 , and to concentrate iterest on some classes of undermodellings more than others by the choice of P� . For example, we may assume that averaged over all undermodellings, the contribution of the undermodelling G� (e?j 2�f ; !) is zero: Z
G� (e?j 2�f ; !)dP� =
Z
1
?1
G� (e?j 2�f ; x)f� (x)dx = 0
(37)
We may make assumptions also on how variations in f and ! interact. For example, we may assume: Z ?j 2�f + G� (e?j 2�f 1 ; !)G� (ej 2�f 2 ; !)dP� = 1��e ? �e?j2�f �; � 2 R ; f = f1 ? f2 (38)
If we go further to assume that G� (e?j 2�f ; !) is the frequency response of a linear system with impulse response sequence f�k (!)g then we have L X
�k (!)e?j 2�fk
(39)
�k (!) = G� (e?j 2�f ; !)ej 2�fk df 0 so that the assumption (38) becomes: � Z k �k (!)�` (!)dP� = ��0 kk =6= 1`
(40)
G� (e?j 2�f ; !) = That is
Z
1
k=1
(41)
4 Undermodelling, Bounded Error Estimation, and Stochastic Embedding
12
Assumptions (38) and (41) are thus equivalent. In the sequel, assumptions (41) will be more convenient from an implementational perspective, but (38) is more useful for intuition purposes since from it we get the smoothness constraint Z 2 G� (e?j 2�f 1 ; ! ) ? G� (e?j 2�f 2 ; ! ) 2 dP� = 2��(1 + �)(1 ? cos 2�f ) � 4� ��(1 + �) (f1 ?f2 )2 2 (1 ? �)(1 + � ? 2� cos 2�f ) (1 ? �)3
(42) Given this method of describing the undermodelling, we next examine how it impacts on the estimation error �^N ? �0 . That is, in the previous sections, we considered the errors to be produced only by a disturbance sequence f�k (!)g:
yk = G(q?1 ; �0 )uk + �k (!) (43) T = �k �0 + �k (!) (44) Now we have an additional error inducing factor due to the undermodelling: yk = G(q?1 ; �0 )uk + G� (q?1 ; !)uk + �k (!) (45) T T = �k �0 + k �(!) + �k (!) (46) where T (47) k , [uk?1 ; uk?1 ; � � � ; uk?L ] since (39) requires an FIR description for the undermodelling component. If we now adopt a convenient vectorized notation: �T , [ � 1 ; � � � ; � N ] (48) T , [ 1; � � � ; N ] (49) Y T , [ y1 ; � � � ; y N ] (50) T V (!) , [�1 (!); � � � ; �N (!)] (51) T � (!) , [�1 (!); � � � ; �L (!)] (52) then for an observed N point data sequence (47) leads us to Y = ��0 + �(!) + V (!) (53) with the least squares estimate given as: ? � �^N = �T � ?1 �T Y (54) so � � ? � ? � �^N ? �0 (!) = �T � ?1 �T �(!) + �T � ?1 �T V (!) (55) If we assume the function �(!) representing the undermodelling to be independent of that representing the disturbance V (!) then it is straightforward to conclude that Covf�~g =
Z
? � ? � ? � �~(!)�~T (!)dP�~ = �T � ?1 �T C� T + C� � �T � ?1
(56)
where if we adopt the example assumptions given in (37) together with its consequence (41) we have 3 2 �� Z 7 ... (57) C� = �(!)�T (!)dP� = 64 5
L �� and Z C� = V (!)V T (!)dP� (58)
5 Multivariable Simulation Revisited
13
This allows us to develop, as in the previous section, a feasible parameter set D that now is valid no only over an ensemble of possible bounded disturbances modelled by �k (!), but also over an ensemble of possible undermodellings indexed by ! 2 . This information can be translated into estimated frequency responses with frequency domain error bounds . This development is straighforward since by (39):
G� (e?j 2�f ; !) = �(e?j 2�f )�(!)
(59)
� � �(e?j 2�f ) = e?j 2�f ; � � � ; e?j 2�fL
(60)
G(e?j 2�f ; �) = �( e?j 2�f )� � � ? j 2 �f �(e ) = B1 (e?j 2�f ); � � � ; Bp (e?j 2�f )
(61) (62)
where and
so that
�
�
GT (e?j 2�f ) ? G(e?j 2�f ; �^N ) (!) = �(e?j 2�f )(�0 ? �^N ) + �(e?j 2�f )�(!)
(63)
The nal step of deriving error bounds on the left hand side of (63) is provided by the following theorem. Theorem 3. De ne 2
n
o 3
Re GT (e?j 2�f ) ? G(e?j 2�f ; �^N ) o g~(e?j! ) , 4 n Im GT (e?j 2�f ) ? G(e?j 2�f ; �^N ) ? � Q , �T � ?1 �T � T + C� )QT ?Q C� � Q ( C � � , ?C� T QT C� � � ? j 2 �f ? j 2 �f Re f �( e ) ; �( e ) g ? j 2 �f ?(e ) , Imf�(e?j 2�f ); �(e?j 2�f )g Then
Z
5
g~(e?j 2�f )~g(e?j 2�f )T dPg~ , Pg~ = ?(e?j 2�f )�?T (e?j 2�f )
Proof. See appendix C.
(64) (65) (66) (67) (68)
222
Note that, with this formulation, Z
2
G(e?j 2�f ; �^N (!)) ? GT (e?j 2�f ) (!)dP = Tr fPg~ g
(69)
but that the provision of Pg~ allows phase error information to be provided as well. Speci cally, motivated by Theorem 2 and the earlier simulation examples we may assume the density function for �^N ? �0 to be approximately Gaussian. If we also specify the density f� (�) to be of Gaussian shape then the density function for g~ will be Gaussian with covariance Pg~. It is then well known that the quantity g~(e?j 2�f )T Pg~?1 g~(e?j 2�f ) (70) will have a �22 density function and this may be used to calculate feasible frequency response sets that will be ellipsoidal and carry not only the magnitude information of (69) but also phase information as well. We will illustrate this discussion with a continuation of our multivariable simulation example.
5 Multivariable Simulation Revisited
14
True and predicted responses
1
True 0 and Estimated Frequency Response
0.5
-10
0 -20
-0.5 -1 0
20 40 Sample Number
60
-30 10 -3
10 -2 10 -1 Frequency (rad/s)
10 0
Posterior error covariance
0.025 0.02 0.015 0.01 0.005 0 10 -3
10 -2
10 -1
10 0
Frequency (rad/s)
Figure 6: Multivariable simulation results presented in the frequency domain. Top right plot is true response and that of the model, as was shown in gure 3. Top left plot is the true frequency reponse (solid) versus that of the model (dashed). The discrepency indicates the presence of undermodelling. The bottom left plot shows the estimate of the frequency repsonse magnitude error calculated by the stochastic embedding method.
5 Multivariable Simulation Revisited We return to the multivariable simulation example of the previous section. Now however we view the estimation results in the frequency domain as shown in gure 6. The top left plot shows the observed noise corrupted data and the response of the least squares estimated model parameterised by (34). The top right plot shows a comparison of the true and estimated frequency responses as Bode Magnitude plots. Note that these latter plots indicate that there is some undermodelling involved in our estimate, as is to be expected given the restricted complexity of the xed denominator model structure (33). If we embed our description of this undermodelling in a description (37),(38) where � = 1:0 � = 0:2 (71) then this corresponds to a magnitude error assumption at d.c of Z jG� (1; !)j2 dP� = 1�� (72) ? � = 0:25
and a Lipschitz smoothness assumption over the ensemble of possible undermodellings as Z
G� (e?j 2�f 1 ; !) ? G� (e?j 2�f 2 ; !) 2 dP� � 0:31 � 4�2 (f1 ? f2 )2
(73)
The resultant quanti cation of magnitude estimation error given by the previous theorem and (69) is shown in the bottom plot of gure 6. Note that it shows highly discriminatory information
5 Multivariable Simulation Revisited
15
about frequency response errors. Note in particular, as predicted in [3], the estimation error is minimised at the fundamental (0:02 � 2�) frequency of the input signal spectrum and then at the harmonics (odd multiples of the fundamental). That this quanti cation of error is meaningful, in that it truly does overbound the error is shown in gure 7 where the true and estimated Nyquist 0.1
0
-0.1
-0.2
-0.3
-0.4
-0.5
-0.6 -0.4
-0.2
0
0.2
0.4
0.6
0.8
1
1.2
Figure 7: Stochastic Embedding overbounds together with true and estimated Nyquist Plots plots are shown together with the error bounding ellipses
g~(e?j 2�f )T Pg~?1 g~(e?j 2�f ) � 4
(74)
This plot shows that our error bounds are valid whilst being highly informative. If more conservative bounds are required the right hand side of (74) may be increased to some value greater than 4. To evaluate the quality of the stochastic embedding paradigm for providing error bounds, we will compare it to a bounded error approach. There are many available in the literature, [29, 28] give examples and references. We chose to use the method proposed in [37, 2] since it will tie in nicely with the multivariable bounded error simulation we have already run. The idea in [37, 2] is to use bounded error estimation theory to estimate both � and �. However, prior information is used to bound � as closely as possible before the estimation experiment. Such prior information discussed in [37, 2] may be of many forms. The frequency domain ones t into the magnitude and Lipschitz smoothness ones we have discussed for our stochastic embedding approach although of course in the context of bounded error estimation the assumptions are not taken over the ensembles of undermodelling as we suggest. This information, together with prior information about �0 is used to form the initial matrix P0 used in the algorithm developed by Fogel and Huang in [7]. The bound �t is speci ed, for example, by the induced norm arguments discussed in [28, 27]. The algorithm of Fogel and Huang is then used to recursively update a feasible parameter set for � � �T , �T ; �T
(75)
6 Estimation of the Parameterization of the Noise and Undermodelling
16
That is, the algorithm provides after N iterations a matrix PN such that the true parameter lies in the set (� ? �0 )T PN?1 (� ? �0 ) < 1 (76) To use these parameter space bounds to provide frequency domain bounds the following result presented in [37] is required Lemma 1. Let x 2 Rn ,P 2 Rn�n be positive de nite, and assume that xT P ?1 x � 1 (77) Consider y = Ax, where y 2 Rp ,p � n, A 2 Rp�n and A has full rank. Then yT (APAT )?1 y � 1 (78) Proof. See [37]. 222 The result is applied in our context by noting that n o 3 2 ? j 2 �f ? j 2 �f ^ Re G ( e ) ? G ( e ; � ) T N o 5 �G(e?j 2�f ) , 4 n = ?(e?j 2�f )(�0 ? �^ N ) (79) ? j 2 �f ? j 2 �f ^ Im GT (e ) ? G(e ; �N ) so combining this with the bound on �^ N ? �0 , (76) and using the lemma we get the frequency domain bound � � �GT ?(e?j 2�f )PN ?(e?j 2�f )� ?1 �G � 1 (80) We employed this method of Wahlberg and Ljung on the simulation example used to illustrate the stochastic embedding bounds. We made the following choices which correspond roughly to earlier assumptions about the noise and undermodelling: � � �t = 0:1 P0 = I20�2 0:05I0 (81) 15�15 The results we obtained are shown in gure 8. The top left and right plots show the evolution of the volume of the bounding error ellipsoid, and the weighting sequence f�t g. We see that the data was informative for updating the feasible parameter set. The quanti ed magnitude response error obtained via (80) is shown in the bottom of the gure. As can be seen it does not show the ne discriminatory structure that was obtained via stochastic embedding in gure (6). The information obtained from (80) is shown in the Nyquist diagram form in gure 9. This plot is very similar to the results displayed in [37, 2]. Again the ne discriminatory structure displayed by the stochastic embedding approach is lost. The results are very conservative.
6 Estimation of the Parameterization of the Noise and Undermodelling We conclude the paper what we believe to be one of the most compelling reasons why the stochastic embedding approach to bounded error estimation should be considered over the set estimation approaches; namely the possibility of estimating the parameters �; �; � from the data. Estimating � would amount to estimating the variance ��2 of the measurement `noise' and then noting that for a uniform distribution ��2 = �2 =3. This idea is well known in stochastic estimation theory and is usual accomplished by considering the sample second moment of the prediction residuals. In this section we discuss the more unusual issue of estimating parameters of the undermodelling �; � from the prediction residuals as well. We give only a brief presentation here. For a fuller discussion see [9, 1]. To begin with, we de ne the N -vector of residuals " , Y ? ��^ (82) T ? 1 T = [I ? �(� �) � ]Y , PY: (83)
6 Estimation of the Parameterization of the Noise and Undermodelling 2
Volume of Overbounding Ellipsoid
log(vol)
0
1
17
Weighting Sequence rho
0.5
-2 0
-4 -6 0
0.3
20 40 Sample Number
60
-0.5 0
20
40
60
Time(s) Posterior error covariance
0.2
0.1
0 10 -3
10 -2
10 -1
10 0
Frequency (rad/s)
Figure 8: Quantifying the error in estimated frequency responses using bounded error estimation theory. The matrix in (83) has rank N -p. Therefore " has a singular distribution of rank N -p. To obtain a new full rank data vector, we represent " in a new coordinate system that forms a basis for the space orthogonal to the columns of �. Let R be any matrix whose columns span the subspace orthogonal to the columns of �. One way of constructing such an R is to take any N ? p independent linear combinations of the columns of P . Now de ne W 2 RN ?p as follows : W , RT ": (84) Then W has a nonsingular distribution and, by the construction of R, W = RT Y = RT � + RT V: (85) Since RT and depend on the input signal only, we observe that W is the sum of two independent random vectors whose probability density functions are computable functions of the unknown parameters �; �; ��2 . We can therefore compute the probability density function of W , conditioned on the observed input data vector U , and on � T , (�; �; ��2 ): We denote the corresponding likelihood function by L(W j U; � ). Maximizing this likelihood function yields the desired estimate for the unknown parameters : �^ = arg max fL(W j U; � )g (86) �
We investigate the properties of �^ for Gaussian assumptions on f� and f� as follows. Consider the special case of the stochastic embedding assumptions being as in (41) � � N (0; C�� (�; � )) (87) C� (�; �) = diag ��k (88) 1�k�L
In addition, assume that the noise f�k g is an independent sequence which is also independent of � and with �k � N (0; ��2 ). The Gaussian assumptions on the distributions f� and f� give the log
6 Estimation of the Parameterization of the Noise and Undermodelling
18
0.6 0.4 0.2 0 -0.2 -0.4 -0.6 -0.8 -1 -1
-0.5
0
0.5
1
1.5
Figure 9: Quantifying the error in estimated frequency responses using bounded error estimation theory. likelihood function l(W j U; � ) for the observed data as (89) l(W j U; � ) = ? 21 ln det � ? 21 W T �?1 W + constant; where � = RT C� (�; �) T R + ��2 RT R (90) 2 L C� (�; �) = diag f��; �� ; : : : ; �� g: (91) That this estimation scheme does in fact work is proved in [1]. Speci cally it is proved that if the regressors �, are orthogonalised by Gram-Schmidt, then provided the dimension L of � grows at a rate proportional to the data length N of ln N , then we will have a:s: � �^N ?! (92) 0 N !1 and if PL is the Fisher information matrix implied by the Likelihood function then we also have p 1=2 ^ D N (0; I ) N ! 1: (93) NPL [�0 ](�N ? �0 ) ?! Therefore, the maximum likelihood method of estimation is asymptotically e�cient. These results show that if we represent undermodelling via a random variable description, then it is possible to estimate the parameters �,� that describe the class of undermodellings of which we observe a realisation. At the same time we can measure ��2 which parameterises a class of disturbances of which we observe a realisation. We can use use these estimates to provide error bounds which apply over the classes of disturbances and undermodellings, and these error bounds are obtained without making any quantitative assumptions. We need only make qualitative assumptions on the nature of undermodelling and disturbances. We believe this dependence only on qualitative assumptions is highly desirable for the purposes of robust control design.
7 Conclusion
19
7 Conclusion In this paper we have examined the rapproachment between a stochastic and deterministic framework for evaluating feasible parameter sets from noise corrupted data. We have shown that in the case of linear regression form model structures the deterministic approach is subsumed by a Bayesian formulation in the stochastic framework. We have also examined the utility of deriving feasible parameter sets from con dence regions arising from application of the central limit theorem in a stochastic setting. In the case where a typical sample path for the disturbance wanders around zero, these latter sets were shown to not only be highly informative, but also to be insensitive to prior quantitative knowledge of disturbances. We concluded by showing how the problem of deriving error bounds accounting for undermodelling can be cast in a stochastic framework. This approach has the attendant advantages of allowing parameters describing the class of undermodellings of which we observe a realisation to be estimated from the available data. We conclude that the rapproachment between the two schools of thought is characterised by a tradeo� between the required accuracy of qualitative knowledge and quantitative knowledge. In a deterministic framework, the nature of a disturbance sequence need not be known, but an accurate quantitative bound is necessary. In a stochastic framework one needs to know the nature of a typical disturbance sample path, but parameters quantifying the ensemble from which it was drawn can be estimated from the data.
Appendix A Proof of Theorem 1 Proof. so feasible � 2 Rp satisfy
jyk ? �Tk �j < j�k j
(A.1)
�Tk � 2 [yk ? j�k j; yk + j�k j] (A.2) T For the purposes of forming D, the best possible realizations are yk = �k � �. Therefore, the best bounds obtainable for one sample are given by the hyperplane delineated region in � space: � Dk , � 2 Rp : �Tk � 2 [�Tk �0 + � ? j�k j; �Tk �0 ? � + j�k j] (A.3) But our conservative assumption is j�k j < � to give � Dk , � 2 Rp : �Tk (� ? �0 ) 2 [� ? �; � ? �] (A.4) So �~ , � ? �0 lies between a pair of hyperplanes perpendicular to �k . Also, if lies on one hyperplane, then ? lies on the other, so the distance between the hyperplanes in the direction is 2k k. But by the Cauchy-Schwartz inequality: j� ? �j = j�Tk j < k�k kk k for some 2 Rp (A.5) so a lower bound on the distance between the two hyperplanes forming Dk is (A.6) 2k k � 2jk��?k�j � 2(��? �) k � But this lower bound is valid 8k 2 N and N \
Dk
(A.7)
so DN is underbounded by a sphere of diameter d d � 2(��? �) � regardless of how large we make N .
(A.8)
DN =
k=1
222
B Proof of Theorem 2
20 Appendix B Proof of Theorem 2
Proof. The Hermite polynomials de ned by �
�
�
�
�
�
n xn?2 + 1:3: n xn?4 ? 1:3:5: n xn?6 + � � � 6 4 2 have the orthogonality property � Z 1 1 � � x � H � x � H � x � dx = n! ; m = n n � m � 0 ; m 6= n ?1 � � so if we write f�~(�) as a Fourier series in Hk (x): � � 1 � � X �n Hn �� f�~(�) = �1 � �� k=1 then we have � � � � Z 1 1 Z 1 1 ��� ��� X � � � Hn � Hm �� d� f�~(�)Hm � d� = �n � ?1 ?1 k=1 to give � � Z 1 1 �n = n! f�~(�)Hn �� d� Hn (x) = xn ?
Then using (B.1) gives:
�0 = �1 =
where
?1
Z
1
f�~(�)d� = 1 ?1 Z 1 �
(B.3)
(B.4) (B.5)
(B.7)
�
�2 = 2 �2 ? 1 f�~(�)d� = 0 by De nition of � ?1 � Z 1 � 3 � ? 3 � f (�)d� = 0 by symmetry of f �3 = 61 � � �~ ?1 �3 � Z 1 � 4 1 � ? 6 �2 + 3 f (�)d� = 1 � m4 ? 3� �4 = 24 �~ �2 24 �4 ?1 �4 m4 ,
(B.2)
(B.6)
f ~(�)d� = 0 by Lemma 15
� � ?1 Z 1 � 2 � 1
(B.1)
Z
1
?1
�4 f�~(�)d�
(B.8) (B.9) (B.10) (B.11)
We elect to terminate the Fourier expansion for f�~(�) at �4 for the purposes of our approximation. We are justi ed in this by knowing that [5]: lim � = 0 (B.12) n!1 n
and that the Fourier co-e�cients minimize the L2 error between f�~(�) and our approximation [5]. This gives: !# � �2 � �" � � � �4 �m � � 1 1 4 (B.13) f�~(�) � � � � 1 + 24 �4 ? 3 � ?6 � +3 Now by Lemma B.1
�
m4 = P� N
�4
2 4
N X
N X N X
3
1 �4 + 2 2 2 2 25 5 k=1 k 3 k=1 j>k �k �j (1 ? 3 ln �k �j )
(B.14)
B Proof of Theorem 2
21
also
2 �2 = 3�P
Substituting this into (B.13) then gives the result.
Lemma B.1.
(B.15)
N
222
2
3
�4 N N N � 1X 4 + 2 X X �2 �2 (1 ? 3 ln �2 �2 )5 4 m4 = P � k k j 5 k=1 3 k=1 j>k k j N �
Proof.
N X �~ = P1 �k � k
PN ,
N k=1
So
m4 =
1
Z
?1
N X k=1
�2k
(B.17)
�4 f�~(�)d�
(B.18)
Z Z N N X N X X 6 1 4 2 2 4 �k �k (!)dP + P 4 �k �j �k2 (!)�j2 (!)dP = P4
N k=1 N k=1 j>k
so by Lemma B.2 �4
�
m4 = P� N
2 4
(B.16)
N X
(B.19)
3
N X N X
1 �4 + 2 2 2 2 25 5 k=1 k 3 k=1 j>k �k �j (1 ? 3 ln �k �j )
(B.20)
222
Lemma B.2. Let �k (!) have the density function given in (4) and let �k 2 R. Then �2 �2 k j
Z
� 2 (!)� 2 (!)dP = k
j
(
�k �j �
�4k �4
5
;k = j
2 2 9 (1 ? 3 ln �k �j ) ; k 6= j
2 2 4
(B.21)
Proof. k = j The characteristic function '(s) for �k �k is [38]: k �s '(s) = sin� ��s
(B.22)
k
so we have [38]:
�2 4
Z
k
@ 4 sin �k �s = �4k �4 �k4 (!)dP = slim !0 @s4 � �s 5 k
(B.23)
k 6= j By Lemma B.3, the density function for �k (!)�j (!) is 2 f�k �j (x) = 21�2 ln j�xj
So
�2k �2j
Z
�k2 (!)�j2 (!)dP =
; jxj < �2
x2 ln �2 dx = �2k �2j �4 (1 ? 3 ln �2 �2 ) k j 9 ?�k �j �2 2�k �j �2 j�k �j xj
Z
�k �j �2
(B.24)
(B.25)
222
C Proof of Theorem 3
22
Lemma B.3. Let X (!) and Y (!) be independent and both have the same density function (4). Then if Z = XY , the density function fZ (z ) is 2 fZ (z ) = 21�2 ln j�z j for jz j � �2 Proof. De ne the Mellin Transform FM (s) of a positive function f (x) as:
FM (s) =
Z
0
1
xs?1 f (x)dx s 2 C
Split fX (x) = fY (y) into a positive function and a negative function: fX (x) = fX+ (x) + fX? (x) Then Z � s FX+ (s) = 21� xs?1 dx = 2��s 0
This gives [34]
2s � � FZ+ (s) = 2 FX+ (s) 2 = 21�2 �s2 Then fZ+ (z ) is given by the inverse Mellin Transform [34]: 1 Z c+j 1 z ?s �2s ds 2�2 fZ+ (z ) 2�j c?j 1 s2 which can be evaluated by residues as: @ z ?s �2s fZ+ (z ) = 21�2 slim !0 @s 2 = 21�2 ln j�z j z 2 [0; �2 ] �
�
(B.26) (B.27) (B.28) (B.29) (B.30) (B.31) (B.32) (B.33)
By symmetry fZ+ (z ) = fZ? (?z ) therefore
2 fZ (z ) = 21�2 ln j�z j
z 2 [?�2 ; �2 ]
(B.34)
222
Appendix C Proof of Theorem 3 Proof. From (63):
GT (e?j 2�f ) ? G(e?j 2�f ; �^N ) = �(�0 ? �^N ) + �� (C.1) However by the de nition of Q we have: �0 ? �^N = ?Q � ? QV (C.2) Furthermore g~(e?j! ) = ?(e?j 2�f )(�0 ? ^N ) (C.3) where ^N , [�^NT ; 0T ]T (C.4) 0 , [�0T ; �T ]T (C.5) Using (C.2) and remembering that V and � are independent then gives Covf�0 ? �^N g = �. This, combined with (C.3), then gives (68). 222
C Proof of Theorem 3 [1] [2] [3] [4] [5] [6] [7] [8] [9] [10] [11] [12] [13] [14] [15] [16] [17] [18] [19]
23
REFERENCES B.M.Ninness, Estimation of variance components in linear models with applications to stochastic embedding, Technical Report EE9226, Department of Electrical and Computer Engineering, University of Newcastle, AUSTRALIA, (1992). B.Wahlberg, On estimation of transfer function error bounds, Proceedings of 1st ECC, 2 (1991), pp. 1378{1383. B.Wahlberg and L.Ljung, Design variables for bias distribution in transfer function estimation, IEEE Trans.Autom.Control,, AC-31 (1986), pp. 134{144. D. E. Catlin, Estimation, Control, and the Discrete Kalman Filter, Springer-Verlag, 1989. R. Deutsch, System Analysis Techniques, Prentice Hall Inc., Englewood Cli�s N.J., 1969. E.Fogel, System identi cation via membership set constraints with energy constrained noise, IEEE Transactions on Automatic Control, AC-24, No 5 (1979), pp. 615{622. E.Fogel and Y.F.Huang, On the value of information in system identi cation-bounded noise case, Automatica, 18 (1982), pp. 229{238. G.C.Goodwin and B.M.Ninness, Model error quanti cation for robust control based on quasi-bayesian estimation in closed loop, Proceedings of CDC, (1991). G.C.Goodwin, M.Gevers, and B.M.Ninness, Quantifying the error in estimated transfer functions with application to model order selection, IEEE Transactions on Automatic Control., (July 1992). G.C.Goodwin and M.Salgado, Quanti cation of uncertainty in estimation using an embedding principle, Proceedings of ACC, Pittsburgh, (1989). , A stochastic embedding approach for quantifying uncertainty in the estimation of restricted complexity models, International Journal of Adaptive Control and Signal Processing, 3(4) (1989), pp. 333{356. G.C.Goodwin and R.L.Payne, Dynamic System Identi cation, Academic Press, 1977. G.Goodwin, B.M.Ninness, and M.Salgado, Quanti cation of uncertainty in estimation, Proceedings of the American Control Conference, (1990), pp. 2400{2405. G.Gu and P. Khargonekar, A class of algorithms for identi cation in H1 , Automatica, 28 (1992), pp. 299{312. A. Helmicki, C. Jacobson, and C. Nett, Control oriented system identi cation:A worst case/deterministic approach in H1 , IEEE Transactions on Automatic Control, 36 (October 1991), pp. 1163{1176. J.Deller, Set membership identi cation in digital signal processing, Acoustics Speech and Signal and Signal Processing Magazine, 6 (1990), pp. 4{20. J.M.Krause and P.P.Khargonekar, A comparison of classical stochastic estimation and deterministic robust estimation, IEEE Transactions on Automatic Control, AC-37 (1992), pp. 994{1000. J.P.Norton, Identi cation and application of bounded parameter models, Automatica, 23 (1987), pp. 497{507. , Identi cation of parameter bounds of armax models from records with bounded noises, International Journal of Control, 42 (1987), pp. 375{390.
C Proof of Theorem 3
24
[20] L. Ljung, System Identi cation: Theory for the User, Prentice-Hall, Inc., New Jersey, 1987. [21] R. L. Maire, L. Valavani, M. Athans, and G. Stein, A frequency domain estimator for use in adaptive control systems, Automatica, 27 (1991), pp. 23{38. [22] M.E.Salgado, Issues in Robust Identi cation, PhD thesis, University of Newcastle, 1989. [23] M.Milanese, Robustness in Identi cation and Control, Plenum Press, New York, 1989. [24] M.Milanese and G.Belforte, Estimations theory and uncertainty intervals evaluation in the presence of unknown but bounded errors:linear families of models and estimators, IEEE Transactions on Automatic Control, AC-27 (1982), pp. 408{414. [25] S. Mo and J. Norton, Recursive parameter bounding algorithms which compute polytope bounds, Proceedings of 12th IMACS World Congress, Paris, (1988). [26] P.M.Makila, Approximation of stable systems by laguerre lters, Automatica, 26 (1990), pp. 333{345. [27] R.C.Younce, Identi cation with non-parametric uncertainty, PhD thesis, University of Notre Dame, Indiana, 1989. [28] R.C.Younce and C.E.Rohrs, Identi cation with parameteric and non-parametric uncertainty, IEEE Transactions on Automatic Control, 37 (1992), pp. 715{728. [29] R.L.Kosut, Adaptive control via parameter set estimation, International Journal of Adaptive Control and Signal Processing, 2 No.4 (1988), pp. 371{400. [30] , Adaptive robust control via transfer function uncertainty estimation, Proceedings ACC, Atlanta, (1988). [31] R.L.Kosut, M.Lau, and S.Boyd, Identi cation of systems with parametric and nonparametric uncertainty, Proceedings of the American Control Conference, (1990), pp. 2412{ 2417. [32] R.Tempo and G.W.Wasilkowski, Maximum likelihood estimators and worst case optimal algorithms for system identi cation, Systems and Control Letters, 10 (1988), pp. 265{270. [33] F. Schweppe, Recursive state estimation-unknown but bounded errors and system inputs, IEEE Transactions on Automatic Control, (1968), pp. 22{28. [34] M. Springer, The Algebra of Random Variables, John Wiley and Sons, New York, 1979. [35] T.Soderstrom and P.Stoica, System Identi cation, Prentice Hall, New York, 1989. [36] B. Wahlberg, System identi cation using laguerre models, IEEE Transactions on Automatic Control, 36 (1991), pp. 551{562. [37] B. Wahlberg and L. Ljung, Hard frequency-domain model error bounds from least-squares like identi cation techniques, IEEE Transactions on Automatic Control, 37 (1992), pp. 900{ 912. [38] D. Williams, Probability with Martingales, Cambridge University Press, Cambridge, UK, 1991.