the popular social networks, like Facebook, Twitter etc., have added the functionality of .... Each chosen data source offers appropriate API for obtaining data in various formats (XML, ... http://www.panoramio.com/map/get_panoramas.php?
Rating content reliability in Interactive Tours System based on existing VGI data sources Sanja BogdanovicDinic University in Nis Faculty of Electronic Engineering A. Medvedeva 14 Nis, Serbia sanja.bogdanovic.dinic @elfak.ni.ac.rs
Nikola Davidovic University in Nis Faculty of Electronic Engineering A. Medvedeva 14 Nis, Serbia nikola.davidovic @elfak.ni.ac.rs
Aleksandar Stanimirovic University in Nis Faculty of Electronic Engineering A. Medvedeva 14 Nis, Serbia aleksandar.stanimirovic @elfak.ni.ac.rs
Leonid Stoimenov University in Nis Faculty of Electronic Engineering A. Medvedeva 14 Nis, Serbia leonid.stoimenov @elfak.ni.ac.rs
Abstract VGI concept has been thoroughly explored in last few years, emphasizing its enormous capacities. Communities of volunteers are making contributions on daily bases, thus increasing the quantity as well as the quality of published data. Even more, through commenting, tagging, liking and recommending they leave valuable subjective data descriptions that are crucial for semantic and context based analyses. The research presented in this paper represents an attempt of establishing rating procedure for assessing the extent of reliability, understandability and appropriateness of VGI data gathered from various geo and social networks and public geo databases. Keywords: VGI, geo-social networks, rating data reliability, Interactive tours system
1
Introduction
In recent years, users of different social networks made significant contributions regarding construction of rich and increasingly complex geospatial datasets. Geolocation, as the ability to precisely locate users geographically, is increasingly being exploited by popular social networks (e.g. Twitter, Foursquare, Gowalla) in order to offer new and improved services to their users. This includes place recommendations and tips, geographic social games, and geo-based tracking. Such geolocated services have grown tremendously over the past few years. In these so called „geolocated social networks“, users make their locations public, using GPS-enabled devices, and utilize this information to interact with other users. The trend in Geoscience that has evidently been growing in the past couple of years and that has been in the focus of the research community lately is Volunteered Geographic Information (VGI) [10][9]. It is a subset of crowd-sourcing that enables users to voluntarily collect and create georeferenced content that can be consumed and potentially evaluated by the general public. Such geographic content can be created either directly on the Websites, or by using different mobile applications on the contemporary mobile devices. In most cases it includes different types of data such as geometries, tagged or annotated geographic features, georeferenced photos, videos or texts and other values obtained using mobile sensors or other sensed data related to the specific place on the Earth. The urging need for semantic VGI data enrichments has influenced the development of geo-social networks, but has also pointed developers' attention towards the challenge of integrating various VGI data sources. In order to obtain as accurate information as possible, developers need to address not only geo sources, but also social and other data sources, in
the quest for user opinions, experiences or comments regarding points of interest (POI). Merging such content with existing geo related data could significantly increase informational value of the VGI data as well as increase data reliability, accuracy and quality. However, such endeavor raises many questions: Is there a different purpose of VGI data than just a map representation of the real-world facts, or it could be used to lead to new conclusion by users, thus producing new data according to the user preferences? Is it crucial for me to find the exact position of the preferred POI, or the POI that I prefer which is along my path? Can I derive new semantics from the existing VGI data that will help me use that data in a new manner? The aim of this paper is to address previously described issues by integrating various open VGI data sources with social and geo-social networks in the attempt of building an interactive tours system for facilitating the process of tour points' content definition. The system is based on VGI recommendation tool that collects data and offers it to user in the provided context. The key feature of the system is rating mechanism that provides rating of the VGI data that is included in the descriptions of the tour nodes. The application provides mechanisms for initial rating, as well as the rating after the tour has been published.
2
Contemporary trends in VGI research
People play important role in the sensor revolution since they themselves have become sensors that provide values of the physical sensor readings or their opinions and perceptions of the world facts [15]. It can be said that the rapid expansion of the applications based on the Citizens as Sensors and VGI concepts are influenced by the advancement of contemporary technology and the grooving interest of individuals to participate in information sharing for the benefit of the
AGILE 2013 – Leuven, May 14-17, 2013
community. But the problems that are consequently being raised are affecting the consumption of such data. While some types of VGI resemble traditional GIS data and are relatively easy to take advantage of, others are loosely structured and heterogeneous and can prove to be tricky to utilize. Two important challenges with such data could be identified: information overload and the extraction of meaning [10]. Growing trend of expanding social networks into geo-social networks has implied as one way of facing this challenge. During past several years, a large number of different VGI based Web applications have emerged. In addition, most of the popular social networks, like Facebook, Twitter etc., have added the functionality of georeferencing user published content. This has led to creating large quantities of open geo data that are freely available online. Notably, the most popular applications that provide such features are Google Earth and Google Maps. By allowing users to create placemarks, routes and overlays, geographic features are transcending from the mere geometrical visualisations of the characteristic of the space to the full descriptions of the place [13]. In [7], such descriptions of the place are termed “cyberscape”, and from the users point of view, can range from strictly local (e.g. user’s house, street) to national and international (country, top of the mountain, beach). Web and mobile platforms that are completely based on users’ contributions and enable them to actively create geo-data are Open Street Map and Wikimapia [2]. Such platforms are more accessible to different stakeholders in the process of creating geo-data, specifically citizens that contribute such content on voluntary basis, compared to existing GIS infrastructures such as the official geoportals. Foursquare is a Web and mobile application that enables users to “check-in” by posting and sharing their location with other users. Such “check-ins” are rewarded with
dealing with the accuracy of the OpenStreetMap data compared with either official Spatial Data Infrastructures (SDIs) or Google and Bing Maps [5],[11]. Although these studies have shown that inaccuracies and incompleteness of such data could be found, they, by no means, suggest that VGI shouldn't be used and they even account its advantages compared to the official SDI data. In addition to this, there have been several researches that propose various methods for quality assurance of the VGI data [8],[12],[14]. For example, in [8] authors propose three approaches to quality assurance: crowd-sourcing, social, and geographic approach. They all agree on the importance of crowd-sourcing as VGI assessment tool, as users indeed are the most reliable source of information. Taking into consideration that geolocation is often being enhanced with semantics regarding user experiences and opinions, crowd-sourcing certainly obtains a very firm position in the VGI quality assurance tests.
3
Rating tour nodes in an Interactive Tours system
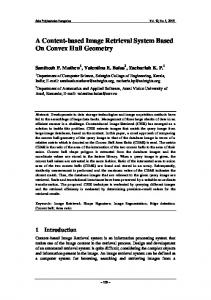
Interactive Tours is a system for collecting and maintaining touristic information in a form of user defined tours, comprised of a set of nodes that are representing touristic entities of user interest. The entire idea behind this system proposal relays on VGI concept interrelated with social networking tools that are offering open access to vast amount of users' opinions and experiences regarding relevant touristic sights. Fig. 1 depicts the architecture of the proposed Interactive Tours system, emphasizing three major constituents: data sources, server and WebGIS client. WebGIS client represents a user entry point, enabling new
Figure 1. Interactive Tours system architecture
points and badges for each user. Also, users can provide “Tips” for places that can be shared with other users, thus contributing to the descriptions of venues (places). Lately, social networks such as Twitter and Facebook have introduced the location feature which can be used to share the user’s location when posting content. For example, Twitter users can share only the information about the place they are in (neighbourhood, town, or state), but some third party applications provide the possibility to share the exact address or the coordinates. However, the quality of such published VGI data is being questioned among researchers. Several studies have been
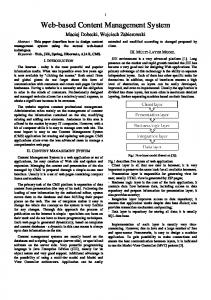
tours entering as well as reviewing and rating existing ones introduced by other users (Fig. 2). After a user defines a location for a new tour node on a map, the process of data acquisition starts by addressing available data sources. The results are then shown back to the user, grouped by the source, enabling them to choose relevant ones for the tour node context. Based on selected data subset, the system performs initial rating of a tour node and relates that information with the node as additional feature. Data sources are relevant sources of freely available information regarding points of interest that are used for generating datasets as initial tour nodes' descriptions. The
AGILE 2013 – Leuven, May 14-17, 2013
Server component is responsible for filtering acquired data based on a user defined context and geo location. Running on Tomcat server, this component drives a crucial system module named VGI Recommender whose task is to collect data, perform context based classification, enable user to define a relevant data subset and then perform an initial rating of touristic sight node based on accumulated data. Interactive Tours system represents a full VGI based system that offers not only the possibility of linking relevant VGI data with touristic sights, but also rating such defined content by other users, making significant contribution to establishing VGI context reliability. At this point of research, our main focus is on data collection and rating processes, where context is determined solely by geo location. The following subsections would give detailed considerations regarding data sources, VGI recommender and tour rating.
3.1
Data sources
Data sources of the proposed system represent VGI based, user defined content in various forms: description of places and venues based on their geo location in form of general information (place name, category, latitude, longitude etc.), articles, pictures, opinions, tips, recommendations and other. Existing sources offer enormous information quantities and
network and provides vast of additional data: user recommendations, tips and opinions, statistics on venues popularity, current trends and other. Counting over 20 million of users [1], Foursquare has imposed as a leading geo-social network and a reliable source of information. Geonames is a worldwide known geographical database of names, containing over 10 million geo names corresponding to 7.5 million features [4]. It already integrates with other VGI sources, namely OSM and Wikipedia, significantly facilitating the entire process of data collection. Wikipedia, as a world most used online encyclopedia, contains enormous number of articles that could be related to almost any known entity. Relating such contained knowledge with geo locations and POIs is of great importance for building reliable and context aware VGI based systems. As user opinion represents a measure of relevancy and accuracy of published information, social networking platforms have imposed as huge VGI influencers. With hundreds of millions of posts a day [6], we find microblogging Twitter platform a valuable source of user experiences that could significantly contribute to entire process of VGI integration. Finally, we have chosen Panoramio as source of pictures, for obtaining user uploaded imagery content based on geo location. Although Foursquare also offers the possibility of obtaining images associated with
Figure 2. Tour definition in WebGIS client application
valuable statistics that, if carefully integrated, could significantly increase informational POIs' value. Data sources chosen at this research phase are: Geonames, OpenStreetMaps (OSM), Wikipedia, Twitter, Foursquare and Panoramio. The selection process was based on the type of the information they offer, information quality and variety. OSM represents a valuable source of geo related information: streets and POIs of different types, and considering it is a pioneer in VGI movement, we find it highly reliable source for such data types. Foursquare, similarly to OSM, offers geo related information on POIs, but at the same time it acts as a social
venues, at this research point we wanted to have a particular data source for such type of data in order to truly explore integration potential of heterogeneous VGI sources. Each chosen data source offers appropriate API for obtaining data in various formats (XML, JSON) convenient for further processing. Geonames, as mentioned previously, implements interfaces towards OSM and Wikipedia in form of Web services, offering a suitable way for linking geo locations with POIs and encyclopedia information [3]. We used Geonames to access these two sources, while others, including Geonames as a toponym source, were accessed directly via their APIs.
AGILE 2013 – Leuven, May 14-17, 2013
3.2
VGI Recommender
VGI recommender runs on server component and makes an important ingredient of the proposed system. The module is comprised of four components (Fig. 1): VGI data acquisition, context classification, search engine and rating calculation. VGI data acquisition is responsible for addressing selected data sources and obtaining available data related to context provided. At this research point, context is defined by geo location solely. Data search is usually performed based on latitude, longitude and radius information. VGI Recommender contacts Geonames in order to obtain toponyms available for given geo area, as well as to address OSM for information regarding POIs' names and locations, and Wikipedia for information regarding articles about recognized toponyms and POIs.
are given in Fig. 3 along with snapshots of obtained responses. Server offers obtained content to the user, making user responsible for further selection and determination on which datasets would be joined to a new tour node. Context classification component is intended to perform collected VGI data classification based on existing context information. In active system, context could be defined through collaborative tagging where users apply tags to defined tours as descriptive guidelines for other users that are interested in reviewing published tours' information. Tagging could be applied during the process of defining new tour node, when it suggests to VGI data acquisition module what types of data it should be requesting from sources, or after defining an entire tour. Tags are very useful for searching as they could significantly facilitate criteria definition. Search engine within
Figure 3. Request examples: A) Wikipedia, B) OSM, C) Geonames, D) Foursquare, E) Twitter and F) Panoramio A) Wikipedia request http://api.geonames.org/findNearbyWikipedia?lat=44.814434&lng=20.459805&radius=1
B) OSM request http://api.geonames.org/findNearbyPOIsOSM?lat=44.814434&lng=20.459805&radius=1
C) Geonames request http://api.geonames.org/findNearby?lat=44.814434&lng=20.459805&radius=1
D) Foursquare request https://api.foursquare.com/v2/venues/explore?ll=44.81334,20.46086&radius=10
E) Twitter request http://search.twitter.com/search.json?q=Terazije F) Panoramio request http://www.panoramio.com/map/get_panoramas.php? set=public&from=0&to=100&minx=21.9033310miny=43.32472&maxx=21.903335&maxy=43.324724
It further searches through Foursquare against previously identified POIs and toponyms in attempt to obtain information regarding user comments, experiences and ratings. For precise results, the search is performed based on POI's or toponym's geo locations with given small radius (approximately 10 meters) acting as a margin of error. Twitter is being searched based on recognized entities' names and in the quest for posts that mention POIs and toponyms or reference them as hashtags, while Panoramio is searched against bounding box around tour node's location for obtaining available images. Query examples for all sources
our VGI recommender component could filter existing tours based on tags and thus perform context based data filtering. At this research point context is determined by the geo location and it is a subject of future research tasks. Tour rating is the focus of our research and it represents an attempt of defining a reliable procedure for rating VGI data in the provided context. The next subsection elaborates in detail the entire rating procedure along with its results.
AGILE 2013 – Leuven, May 14-17, 2013
3.3
Tour rating
Rating is the main outcome of the proposed system and it represents cumulative value obtained through particular ratings of VGI content chosen from relevant data sources. The final rating is a number from the range [0, 1] indicating accuracy, reliability and popularity of tour related data. Rating process is quite complex and performed in stages. Each data source is first separately rated and after, rating is performed for each tour node and finally for the entire tour. We define initial and live rating stages, where initial stage implies rating calculation at the moment of defining a tour node, while live rating relates to active users' ratings after it has been published. Considering that POIs' names, which are obtained from Geonames and OSM, are being used for obtaining Twitter and Foursquare information, these data sources are not being directly rated, but indirectly through other sources' ratings. Panoramio is another source that is not directly rated due to the possibility of outdated statistical information. The older the picture is on Panoramio, the better chances are it would have higher popularity. We consider this unreliable due to the fact that new pictures are more likely to be up to date, more modern and more realistic in terms of architecture, landscapes etc. For these reasons we have decided to exclude Panoramio from the initial rating phase. The three sources that are directly rated in the initial rating stage are Wikipedia, Foursquare and Twitter. Wikipedia rating is performed based on the rank information obtained via Geonames Wikipedia Web service. Rank is a number from the range [0, 100] and it is calculated according to the Wikipedia users' ratings. WikiRating indicator is being calculated as an average value of ranks of n Wikipedia sources that are chosen by the user as relevant for the tour point context, and scaled to range [0, 1] (1).
as relevant for the tour node. Each term is being rated based on the related tweets as average tweets' rating. The calculation of a particular tweet rating is performed as follows: for all tweets related to one term, maximal retweets number is first calculated (maxretweetsNo); if a tweet has not been retweeted, its rating is 0.1, else tweet's rating is calculated relatively to maximal retweets number based on its own retweets. The formula is being defined in a way that ensures that tweet would have 0.5 rating in case its retweets number is half of the maximal retweets number, higher than 0.5 in case its retweets number is higher than half of maximal retweets number, or under 0.5 in case its retweets number is lower than half of maximal (3).
-
(3) Tour point's rating is being calculated based on an average rating of the previous three indicators determined in initial rating stage, and Interactive Tours users' voting in live rating stage, as given in (4). Initial rating results with a measure for tour node named NodeWeight in the equation, while live rating is formulated as factor F. (4) NodeWeight represents an average rating of Wikipedia, Foursquare and Twitter sources involved in initial rating stage (5). (5)
(1) Foursquare data source provides vast of information regarding geographical places, along with significant statistical data. For the calculation purposes of FourSqRating indicator, we have chosen to utilize rating and likes information. Rating is a number from range [0, 10] that represents average venue's rating from Foursquare users, while likes represent a number of users that have liked the venue. (2) gives a formula for calculating FourSqRating as an average value of m venues ratings chosen by user as relevant for the tour point. Particular venue rating is calculated based on the Foursquare rating information (FRating), scaled to [0, 1] range and strengthened by the number of likes if there are any (FLikes).
(2) Twitter posts are obtained for each term related to tour node's location. Considering that there is no rating information related to particular tweets, we have defined a formula which acknowledges the number of tweets as popularity testimonial for the searched term. TwitterRating represents an average rating of all terms selected by the user
Factor F demonstrates the relation between Interactive Tours users' up-votes and down-votes and is calculated accordingly to (6). Up-votes (up) are given to a tour node as an indication of acknowledging the relevancy of the content applied. On the other side, down-votes (down) indicate that users do not find chosen content relevant. The role of this factor is to amplify initial rating when up-votes outnumber down-votes (the first case in (6)), or to absorb it in opposite case. If there are no up-votes or down-votes, the factor is equal 1 and it is not changing the initial rating.
(6)
The entire tour could be rated based on calculated ratings of all its nodes as an average rating of tour nodes, where n indicates the number of nodes (7). (7) Tour rating evaluates relevancy of the tour related data in a particular, user defined context. As user that performs new
AGILE 2013 – Leuven, May 14-17, 2013
tour entering is responsible for choosing tour content among recommended data, data quality, accuracy and relevancy of the created tour are mostly influenced by the user's personal opinion and experience. By rating such defined tour and its nodes, other users are actually expressing agreement or disagreement with tour creator's points of view.
[2] D. Coleman. Volunteered geographic information in spatial data infrastructure: an early look at opportunities and constraints. In GSDI 12 World Conference. Singapore 2010.
4
[4] Geonames Website. http://www.geonames.org/
Conclusion and future remarks
The Interactive Tours system is focused on building user defined tours based on available VGI data obtained from various geo and social networks and public geo databases. The information held by a single tour node represents a mix of data collected and selected by user from various available sources. The true value of the system is in the process of rating, which is an attempt of determining the accuracy and reliability of collected VGI data as numerical representation of accumulated geo and semantic information. Including user opinions and experiences in the information regarding names and locations of POIs, adds a significant value to collected data. Allowing users to rate such selections increases reliability even more. Live ratings in the proposed system are true value carriers as they enable users to assess the appropriateness of chosen datasets for tour context. A considerable strength of the proposed system is in providing wide POI's context by integrating various data sources. A tourist, as system's user, would therefore have a detailed description of tours of interest, while making sightseeing plans. This is an advantage of the proposed solution in comparison to similar ones, especially due to the fact that the Interactive tours system integrates and filters information coming from various VGI based systems. On the other hand, a user is responsible for generating tour point's context as they are the ones that make selections and determine relevant data descriptions for tour points. This could be considered a strength and at the same time a weakness of the system. It is a strength, as it directly reflects and supports VGI concept, but considering that selection of relevant data sources for tour point's context is determined by a single user, the descriptions are subjective and thus represent a weakness. Enabling live rating in the form of rating defined tour descriptions reduces this weakness making the crowd's opinion prevail. Contextual tagging is an important future consideration of the proposed system. Applying tags to tour nodes and entire tours, would increase information understandability and significantly ease filtering process. One tour node could be differently defined in various contexts, as well as the entire tour, enabling users to rate data differently regarding selected context. Context itself could also be rated. In such way, tourists wishing to visit city's sights could very easily find appropriate tours based on desired context and select those with highest ratings as probably most reliable ones.
References [1] D. Belic. Foursquare surpasses 20 million users, 2 billion check-ins, IntoMobile Web article, April 2012, http://www.intomobile.com/2012/04/21/foursquaresurpasses-20-million-users-2-billion-checkins/
[3] Geonames API. http://www.geonames.org/export/webservices.html
[5] J. F. Girres and G. Touya. Quality Assessment of the French OpenStreetMap Dataset. Transactions in GIS, 14: 435–459. doi: 10.1111/j.1467-9671.2010.01203.x, 2010. [6] L. Dugan. Twitter To Surpass 500 Million Registered Users On Wednesday, MediaBistro Weblog article, February 2012, http://www.mediabistro.com/alltwitter/500-millionregistered-users_b18842 [7] M. Crutcher and Z. Matthew. Placemarks and Waterlines: Racialized Cyberscapes in Post-Katrina Google Earth. Geoforum 40, no. 4, pages 523–534.2009 [8] M. F. Goodchild and L. Li. Assuring the quality of volunteered geographic information. Spatial statistics, 1 (2012), 110-120, 2012. [9] M. F. Goodchild, Citizens as sensors: The world of volunteered geography. GeoJournal, 69, pages 211–22, 2007. [10] M. F. Goodchild. Citizens as voluntary sensors: spatial data infrastructure in the world of Web 2.0, International Journal of Spatial Data Infrastructures Research 2, pages. 24–32. 2007 [11] M. Haklay. How good is volunteered geographical information? A comparative study of OpenStreetMap and Ordnance Survey datasets. Environment and Planning B: Planning and Design 37(4) 682 – 703, 2010. [12] M. van Exel, E. Dias and S. Fruijtier. The Impact of Crowdsourcing on Spatial Data Quality Indicators. In Proceedings of GiScience 2011, Zurich, Switzerland, 14– 17 September 2010. [13] R. S. Purves, and A. J. Edwardes. Exploiting Volunteered Geographic Information to DescribePlace, Proceedings of the GIS Research UK 16thAnnual Conference,D. Lambrick, editor, pages 252-255. 2008 [14] S. Matyas, P. Kiefer, C. Schlieder and S. Kleyer. Wisdom about the Crowd: Assuring Geospatial Data Quality Collected in Location-Based Games, In proceeding of: Entertainment Computing - ICEC 2011 10th International Conference, Vancouver, Canada, October 5-8, 2011 [15] V. Deparday and R. Feick, Methods for the Evaluation of Geovisualization Techniques to Explore Volunteered Geographic Information (VGI), Proceedings of Canadian Association of Geographers Conference, Calgary, AB, June 1-4, 2011.