1-5-1, Chofugaoka, Chofu, Tokyo, Japan1,2,3. {ochi ... Data sparseness reduces prediction accuracy. To ... We found that
Rating Prediction using Feature Words Extracted from Customer Reviews Masanao Ochi1
Makoto Okabe2
Rikio Onai3
The University of Electro-Communications1,2,3 , JST PRESTO2 1-5-1, Chofugaoka, Chofu, Tokyo, Japan1,2,3
{ochi, onai}@onailab.com1,3
[email protected]
ABSTRACT
Restaurant A
c
We developed a simple method of improving the accuracy of rating prediction using feature words extracted from customer reviews. Many rating predictors work well for a small and dense dataset of customer reviews. However, a practical dataset tends to be large and sparse, because it often includes too many products for each customer to buy and evaluate. Data sparseness reduces prediction accuracy. To improve accuracy, we reduced the dimension of the feature vector using feature words extracted by analyzing the relationship between ratings and accompanying review comments instead of using ratings. We applied our method to the Pranking algorithm and evaluated it on a corpus of golf course reviews supplied by a Japanese e-commerce company. We found that by successfully reducing data sparseness, our method improves prediction accuracy as measured using RankLoss.
Restaurant B
2 The food is very terrible
Categories and Subject Descriptors
3 3
2.5
3 It is not so terrible
c
H.3.3 [Information Storage and Retrieval]: Information Search and Retrieval—information filtering
terrible
4.5
3 Dishes looked delicious
c
c
Rest. A Rest. B Rest. C delicious
c
c
Restaurant C
5 It is very delicious
4 I enjoyed delicious cuisine 3 Not very terrible food
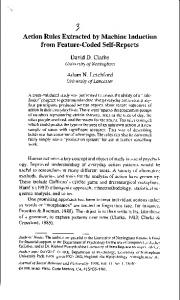
Figure 1: An illustration of our approach in the case of restaurant reviews. Left: The original dataset has ratings only in the blue cells and the whole matrix is sparse. Right: Instead of using customers, we use the feature vector of feature words extracted from the review comments. This reduces the dimension of the feature vector from 6 to 2, so the whole matrix becomes dense. The score of each cell is an average of the scores rated with each word. reduced the dimension of the feature vector and increased the density of the matrix by extracting “delicious” and “terrible” as feature words. We extracted a word as a feature word when it appeared frequently and was accompanied with a polarized score. The words “delicious” and “terrible” appeared many times with high and low scores and therefore were selected as feature words. “Very” was not selected as a feature word; although it also appeared many times, its accompanying score varied. Our method of analyzing ratings and accompanying review comments is a simple but powerful way of extracting feature words that can capture a characteristic of each rating aspect well. This is often difficult to implement by relying only on natural language-processing techniques or other corpora such as WordNet [3, 4].
General Terms Experimentation
Keywords sentiment analysis, review mining, rating prediction
1. INTRODUCTION Rating prediction is a practically important problem, because it enables the market to estimate how satisfied a customer will be with a service [1, 2, 5]. Given a dataset of customer reviews, rating predictors (like the Pranking algorithm [1]) can learn and predict the rating of a target customer. These algorithms work well for a small and dense dataset. However, the problem is that in practice a dataset is large and sparse, because it often includes too many products for each customer to buy and evaluate (Figure 1). The dimension of the feature vector increases as fast as the increase in the number of products. For example, the matrix of the EachMovie dataset is reportedly sparse (5% full) [5]. To address this problem, we developed a way to reduce the dimension of a feature vector using feature words extracted by analyzing the relationship between ratings and accompanying review comments. Figure 1 illustrates our approach. We
2.
EFFECT OF DATA DENSITY
As shown in Figure 1, the original dataset is often sparse. Crammer et al. proposed filling in blank cells with an intermediate score [1], which results in low prediction accuracy. We evaluated the relationship between data sparseness and the accuracy of the Pranking algorithm. Given a target customer and a product, the Pranking algorithm predicts the rating that the customer is likely to give the product by learning from the dataset how the customer has rated other products in the past. We used the Book-Crossing Dataset1 , which is a relatively dense dataset because of the
Copyright is held by the author/owner(s). SIGIR’11, July 24–28, 2011, Beijing, China. ACM 978-1-4503-0757-4/11/07.
1
1205
http://www.informatik.uni-freiburg.de/∼cziegler/BX/
㻻㼢㼑㼞㼍㼘㼘 㼣㼛㼞㼐 㼍㼢㼑㼞㼍㼓㼑 㼓㼞㼑㼍㼠 㻠㻚㻢 㻾㼛㼜㼑㻔㼓㼛㼘㼒㻌㼏㼛㼡㼞㼟㼑㻕 㻠㻚㻡 㼜㼞㼍㼕㼟㼑 㻠㻚㻡 㼟㼜㼘㼑㼚㼐㼕㼐 㻠㻚㻠 㼙㼕㼚㼐㼒㼡㼘 㻠㻚㻠 㼎㼑㼍㼡㼠㼕㼒㼡㼘 㻠㻚㻠 㼠㼔㼛㼡㼓㼔㼠㼒㼡㼘 㻠㻚㻠 㼜㼑㼞㼒㼑㼏㼠 㻠㻚㻠 㼞㼕㼏㼔 㻠㻚㻠 㼠㼔㼞㼕㼘㼘㼕㼚㼓 㻠㻚㻠
㼣㼛㼞㼐 㼚㼍㼟㼠㼥 㼏㼔㼑㼍㼜 㼎㼍㼐 㼍㼟㼗㼕㼚㼓 㼍㼜㼛㼘㼛㼓㼥 㼍㼚㼓㼑㼞 㼒㼕㼚㼍㼘㼘㼥 㼑㼙㼎㼍㼞㼞㼍㼟㼟㼕㼚㼓㼘㼥 㼍㼟㼟 㼐㼕㼞㼠㼥
㼍㼢㼑㼞㼍㼓㼑 㻞㻚㻡 㻞㻚㻢 㻞㻚㻣 㻞㻚㻤 㻞㻚㻤 㻞㻚㻤 㻞㻚㻤 㻞㻚㻤 㻞㻚㻥 㻞㻚㻥
㻯㼛㼡㼞㼟㼑 㼣㼛㼞㼐 㼍㼢㼑㼞㼍㼓㼑 㻵㼚㼛㼡㼑㻔㼚㼍㼙㼑㻕 㻠㻚㻡 㻿㼑㼕㼕㼏㼔㼕㻔㼚㼍㼙㼑㻕 㻠㻚㻡 㼓㼞㼑㼍㼠 㻠㻚㻠 㼟㼗㼕㼘㼘㼒㼡㼘 㻠㻚㻠 㻵㼟㼔㼕㼛㼗㼍㻔㼓㼛㼘㼒㻌㼏㼛㼡㼞㼟㼑㻕 㻠㻚㻠 㼍㼓㼕㼠㼍㼠㼑 㻠㻚㻠 㼙㼛㼠㼕㼢㼍㼠㼑 㻠㻚㻟 㼞㼍㼞㼕㼠㼥 㻠㻚㻟 㼢㼍㼞㼕㼑㼠㼥 㻠㻚㻟 㼏㼔㼍㼙㼜㼕㼛㼚㼟㼔㼕㼜 㻠㻚㻟
㼣㼛㼞㼐 㼘㼍㼏㼗 㼚㼍㼟㼠㼥 㼏㼔㼑㼍㼜 㼣㼑㼑㼐 㼑㼚㼒㼛㼞㼏㼑㼐 㼞㼕㼢㼑㼞 㼟㼍㼚㼐㻌㼜㼕㼠 㼙㼛㼚㼛㼠㼛㼚㼑 㼓㼡㼘㼘㼥 㼜㼍㼠㼏㼔㼥
㻯㼛㼟㼠㼋㼜㼑㼞㼒㼛㼞㼙㼍㼚㼏㼑 㼣㼛㼞㼐 㼍㼢㼑㼞㼍㼓㼑 㼗㼕㼘㼘㼑㼞㻌㼜㼞㼕㼏㼑 㻠㻚㻢 㼞㼑㼍㼘㻌㼏㼔㼑㼍㼜 㻠㻚㻢 㼜㼑㼞㼒㼛㼞㼙㼍㼚㼏㼑 㻠㻚㻡 㼎㼑㼠㼠㼑㼞 㻠㻚㻠 㼏㼛㼟㼠 㻠㻚㻠 㻯㻼 㻠㻚㻠 㼏㼔㼑㼍㼜 㻠㻚㻠 㼒㼕㼞㼑㻙㼟㼍㼘㼑 㻠㻚㻟 㼓㼞㼑㼍㼠 㻠㻚㻟 㼛㼡㼠㼏㼘㼍㼟㼟㼕㼚㼓 㻠㻚㻟
㼍㼢㼑㼞㼍㼓㼑 㻟㻚㻜 㻟㻚㻜 㻟㻚㻜 㻟㻚㻜 㻟㻚㻜 㻟㻚㻝 㻟㻚㻝 㻟㻚㻝 㻟㻚㻝 㻟㻚㻝
㼣㼛㼞㼐 㼞㼑㼘㼍㼠㼕㼢㼑㻌㼑㼤㼜㼑㼚㼟㼑 㼜㼑㼚㼚㼥㻙㼣㼕㼟㼑 㼍㼟㼗㼕㼚㼓 㼠㼑㼞㼞㼕㼎㼘㼑 㼍㼜㼛㼘㼛㼓㼥 㼑㼙㼎㼍㼞㼞㼍㼟㼟㼕㼚㼓㼘㼥 㼍㼞㼞㼛㼓㼍㼚㼠 㼙㼑㼟㼟㼥 㼍㼟㼟 㼏㼛㼙㼜㼘㼍㼕㼚㼠
㼍㼢㼑㼞㼍㼓㼑 㻟㻚㻜 㻟㻚㻝 㻟㻚㻞 㻟㻚㻞 㻟㻚㻞 㻟㻚㻟 㻟㻚㻟 㻟㻚㻟 㻟㻚㻟 㻟㻚㻟
Figure 2: Feature words extracted from customer reviews. All reviews were written in Japanese, and we translated each extracted word into English.
(a) RankLoss-DataDensity
(b)
(c)
overall
course
1.15
1.3
1.1 1.05
0.28
1.1 1.1
RankLoss
RankLoss
RankLoss
1 0.27
0.95 0.9 0.85
0.26
0.8
0.75 0.7 0
0.05
0.1
0.15
1 0.9
0.8
0.25
1.2 1.15
1.2
RankLoss
0.29
(d) cost_performance
1.05 1
customer
0.9
word_avg
0.85
0.7 1
DataDensity
6
11
16
base
0.95
0.8 1
6
itera on
11
16
itera on
1
6
11
16
itera on
Figure 3: (a) The performance of a rating predictor depends on the data density. (b)-(d) The RankLoss for each aspect. Base means prediction of an intermediate score, 3 in this case. Customer means customer ratings are used as the feature vector. Word avg means feature words are used as the feature vector. nature of the service. The original matrix of this dataset is 15% full. We generated a sparse dataset by removing data from randomly selected cells and applied it to the Pranking algorithm. We evaluated prediction accuracy using RanPT |ˆyt −yt | kLoss [1], RankLoss = . T is the number of t T products, yˆt is the t-th predicted output score, and yt is the t-th desired output score. As shown in Figure 3 (a), the sparser the dataset becomes, the lower the prediction accuracy becomes. This result motivated us to solve the problem of data sparseness by reducing the dimension of the feature vector.
rating is caused by complaints about the conditions of a golf course. We used the extracted feature words as the feature vector of the Pranking algorithm and reduced the dimension to increase the density of the data. The original dataset had 85,000 customers and was sparse (0.5% full). We selected 100 feature words with high and low average scores, thereby reducing the dimension of the feature vector from 85,000 to 100. As a result, data density was increased (30% full). We evaluated the RankLoss (Figure 3 (b)-(d)), and our results outperformed the results of the original sparse dataset.
3. EXPERIMENT AND RESULTS
4.
We applied our technique to the Pranking algorithm and evaluated it on a corpus of golf course reviews supplied by a Japanese e-commerce company2 . Each review was accompanied by a set of three aspects, each on a scale of 1-5: overall experience, golf course, and cost performance. To extract feature words related to each aspect, we computed the score for each word as the average of all rated scores accompanied by a review comment that included the word. The score is shown as “average” in Figure 2. As a result, the score of a word irrelevant to the aspect was close to the total average score, and a word that captured the characteristic of the aspect had a high or low average score. Figure 2 shows that our method successfully extracts interesting feature words. Note that our method extracts not only positive and negative words but also words that explain the semantic context of the aspect. For example, “Inoue” and “Seiichi,” shown in the Course table, refer to a famous golf course designer who has designed many golf courses in Japan. The negative side of the Course table includes words such as “weed,” “river,” and “sand pit,” from which one learns that a customer’s low
We have demonstrated that data density is important for prediction accuracy. We have developed a novel feature vector using feature words that successfully improves prediction accuracy as measured using RankLoss.
2
5.
CONCLUSIONS
REFERENCES
[1] K. Crammer. Pranking with ranking. NIPS’01, pages 641–647, 2001. [2] E. F. Harrington. Online ranking/collaborative filtering using the perceptron algorithm. ICML’03, pages 250–257, 2003. [3] M. Hu and B. Liu. Mining and summarizing customer reviews. KDD’04, pages 168–177, 2004. [4] J. Kamps, M. Marx, R. J. Mokken, and M. de Rijke. Using wordnet to measure semantic orientations of adjectives. LREC’04, pages 1115–11118, 2004. [5] A. Sashua and A. Levin. Ranking with large margin principle: Two approaches. NIPS’03, pages 937–944, 2002.
http://rit.rakuten.co.jp/rdr/index.html
1206