There was a problem previewing this document. Retrying... Download. Connect more apps... Try one of the apps below to op
Hindawi Publishing Corporation International Journal of Antennas and Propagation Volume 2015, Article ID 184608, 11 pages http://dx.doi.org/10.1155/2015/184608
Research Article Ray Tracing RF Field Prediction: An Unforgiving Validation E. M. Vitucci,1 V. Degli-Esposti,2 F. Fuschini,1 J. S. Lu,2 M. Barbiroli,1 J. N. Wu,2 M. Zoli,1 J. J. Zhu,2 and H. L. Bertoni3 1
Dipartimento di Ingegneria dell’Energia Elettrica e dell’Informazione “Guglielmo Marconi”, Alma Mater Studiorum, Universit`a di Bologna, 40136 Bologna, Italy 2 Polaris Wireless Inc., 301 North Whisman Road, Mountain View, CA 94043, USA 3 NYU Wireless Center of Polytechnic School of Engineering, New York University, Brooklyn, NY 11201, USA Correspondence should be addressed to E. M. Vitucci;
[email protected] Received 2 June 2015; Revised 23 July 2015; Accepted 26 July 2015 Academic Editor: Jose-Maria Molina-Garcia-Pardo Copyright © 2015 E. M. Vitucci et al. This is an open access article distributed under the Creative Commons Attribution License, which permits unrestricted use, distribution, and reproduction in any medium, provided the original work is properly cited. The prediction of RF coverage in urban environments is now commonly considered a solved problem with tens of models proposed in the literature showing good performance against measurements. Among these, ray tracing is regarded as one of the most accurate ones available. In the present work, however, we show that a great deal of work is still needed to make ray tracing really unleash its potential in practical use. A very extensive validation of a state-of-the-art 3D ray tracing model is carried out through comparison with measurements in one of the most challenging environments: the city of San Francisco. Although the comparison is based on RF cellular coverage at 850 and 1900 MHz, a widely studied territory, very relevant sources of error and inaccuracy are identified in several cases along with possible solutions.
1. Introduction Deterministic prediction of radio frequency (RF) coverage, or received signal strength indicator (RSSI), in urban environment has been widely addressed during the last 20 years, in particular through ray-based propagation models. Making use of the ray-optical approximation originally developed for optical propagation problems [1] and of theories to describe diffraction problems [2], ray-based propagation models such as ray tracing describe the propagating field as a set of rays undergoing multiple reflections and diffractions over and around the obstacles (e.g., terrain and buildings) in the propagation environment. Although ray tracing models have been shown to be the most accurate deterministic models available if properly fed a detailed description of the environment (e.g., building database), their widespread application has been hindered by the high complexity of operation and high computation time. For this reason, several methods to limit the number of propagating rays have been proposed over the years. Multiple-diffraction models for over-roof-top propagation in the radial direction have been developed for macro
cells [3] and two-dimensional (2D) models accounting for reflections and diffractions in the horizontal plane have been proposed for microcells [4]. Propagation in complex environments has been modelled with more sophisticated quasi-3D ray tracing (RT) approaches [5], or using fully 3D algorithms [6, 7]. More recently diffuse scattering phenomena due to irregularities of building walls have been embedded in ray tracing models to improve prediction accuracy [8, 9]. However, within most studies, validation was performed using a limited set of measurement data in a few reference environments. Typically, each set had less than a few hundred points. This is mainly due to the limited number of available measurements and to the high computation time involved in ray tracing operation. Furthermore, the measurement campaigns were often carried out at night to minimize the effect of traffic, and avoiding vegetated or hilly areas and very irregular urban layouts. To the authors’ knowledge, only one study addressed large-scale RF coverage prediction under normal operating conditions [10]. In the present paper the approach has been reversed: starting from an extensive and complete set of measurements in a challenging environment related to a practical
2 application, the actual performance of ray tracing has been assessed in a fair and complete way. A state-of-the-art 3D RT model including diffuse scattering is validated for the first time against a large set of measurements recorded in one of the most challenging environments: the city of San Francisco, USA. This set considers 18 transmitting base station sites and thousands of receivers per site with link distances ranging from a few meters to some kilometres. The San Francisco environment is characterized by an extreme variety of buildings from small wooden houses to 250 m tall glass-and-steel skyscrapers, a very hilly terrain, and a widespread presence of vegetation traffic, bridge ramps, and freeway junctions within the urban layout. In this investigation the measurement versus prediction comparison is based on narrowband RF coverage at 850 and 1900 MHz. Although it might appear old-fashioned, RF coverage is still the most important radio propagation parameter for the performance of present and future wireless communication systems, as well as for the implementation of RF-based services such as RSSI-based fingerprinting localization techniques for emergency and surveillance services [11]. The RT model, its characteristics, and details regarding its application to the problems under study in this work are described in Section 2. Validation results are illustrated in Section 3, where prediction performance is shown to be generally good, but very relevant and unexpected sources of error and inaccuracy are identified in several cases, as described in the different subsections, and possible solutions are also implemented and verified or proposed.
2. The Considered Ray-Based Model 2.1. The 3D Model’s Basics. A 3D RT model developed at the University of Bologna has been used in the present work [13] and is shortly described in the following. According to the deterministic approach, the RT engine requires to be fed by a detailed description of the urban environment. Geometrical information includes a vectorial representation of the building map, a digital description of the terrain height in raster format, and the positions of both the base station (BS) and the user equipment. In this work the BS will always be the transmitter (Tx) while the mobile stations will be the receiver (Rx). The electromagnetic description includes the antennas radiation patterns and the electromagnetic parameters of the materials, limited to the relative electrical permittivity (𝜀𝑅 ) and the conductivity (𝜎). In order to reduce the amount of data to be stored and handled, and due to the common unavailability of a complete and detailed description of buildings, walls are simply represented as flat and smooth surface slabs. Based on such a simplified representation, coherent rays (i.e., involving canonical interactions like reflection/diffraction/transmission) are tracked through an “image-RT approach” according to Geometrical Optics (GO) theory [1] and to the Uniform Theory of Diffraction (UTD) [2]. To determine the propagating rays, the algorithm recursively sets up a so called “visibility tree,” which is a virtual
International Journal of Antennas and Propagation Tx
Wall plane Visibility region
Reflecting wall VTx
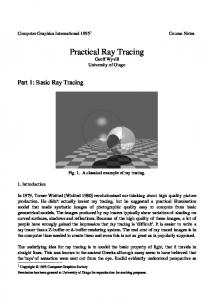
Figure 1: Example of VTx and visibility region for a reflecting wall.
layered structure representing the potential visibility relationships among transmitter, receiver, and interacting objects (i.e., walls and wedges) inside the scenario. In particular, objects are stored within the tree by means of proper “virtual transmitters” (VTx) that behave as secondary virtual sources [13, 14]. VTx locations related to wall-objects also depend on the electromagnetic interaction (reflection/transmission) experienced by the wall. For example, the first-order VTx associated with a wall is defined as the symmetric point (image) of the real Tx with respect to the wall plane if the wall acts as reflector (Figure 1), whereas it coincides with the Tx if transmission through the wall is assumed. A proper “visibility region” is also identified for each object, representing the spatial region that can be illuminated by the corresponding VTx. The visibility region of a reflecting wall is, for example, shown in Figure 1. In order to reduce the computation time, only the objects included within the visibility region of each VTx are preselected and stored in the visibility tree. The presence of a Rx inside the visibility region always means that an optical ray linking the Tx to the Rx exists, and its trajectory can be tracked climbing up the visibility tree according to a proper back-tracking procedure which determines the exact interaction points [9]. Of course, the undergone interactions must be compliant with the requirements preset at the beginning of the simulation: if the number of reflections/transmissions/diffractions exceeds the maximum allowed values, the ray must be discarded; otherwise, the field computation is performed. With reference to the number of transmissions, the ray-object intersection check is performed on the base of the Binary Space Partitioning approach [15]. In addition to standard electromagnetic interaction, the RT model also takes into account diffuse scattering (DS) due to building walls surface irregularities/volume dishomogeneities according to the “Effective Roughness” (ER) model [16]: the electromagnetic power impinging on a wall (or part of it) is spatially scattered according to a proper scattering coefficient 𝑆 and a suitable, scattering pattern [16]. In order for the scattering model to be physically sound, diffusion occurs at the expense of reflected and transmitted powers, which are therefore properly reduced.
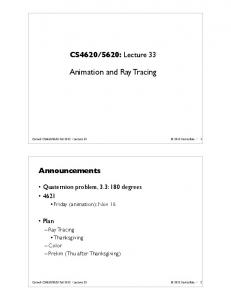
International Journal of Antennas and Propagation Differently from reflection, transmission, and diffraction, scattering is a “diffuse phenomenon”; that is, it can hardly be modelled by means of contributions coming from few, specific interaction points, as it is generated by a multitude of scatterers widely distributed on the scattering surface. According to this characteristic, the ER model requires the subdivision of each surface into “tiles” with prefixed dimensions; during the visibility assessment process, each tile is regarded as a single object with a VTx placed in its centre, which acts as secondary source of spherical wave radiated according to the scattering radiation pattern. 2.2. Extensions to the Ray Tracing Engine. Depending on the properties of the propagation scenario, the position of antennas (especially of BSs in cellular networks), and the link distance, the dominant propagation process can occur over building rooftops (ORT propagation), and/or around buildings along the street canyons [17]. Particularly when the BS antenna is placed near or above the rooftop level, propagation takes place primarily over the buildings [18], where the radio wave undergoes multiple diffractions over the horizontal edges delimiting the roofs contours. Differently from the buildings vertical corners, horizontal edges are not necessarily parallel to each other, and this poses a theoretical limit to the computation of the multiplediffracted field using a 3D ray tracing approach. In fact, although the geometrical trajectories can be tracked regardless of the number 𝑛𝑑 of involved diffractions [19], analytical expressions for the corresponding propagating field are available only for 𝑛𝑑 up to 3 if the wedges are arbitrarily oriented [20]. Since ORT propagation may sometimes require more than 3 diffractions, especially for large link distance, for rays undergoing more than 2 diffractions the fully 3D geometrical computation is replaced with a simplified approach using a multiple-screen UTD model limited to the vertical plane, considering one/two knife-edges for each building along the radial line between the Tx and the receiver (Rx). Before applying the UTD model, the ORT profile is simplified by identifying only the dominant obstacles with the “rubberband” method. As discussed in Section 3, such multi-knifeedge models seem to overestimate the attenuation (see Section 3), probably due to the ideality of the knife-edge assumption with respect to the actual shape of buildings; some correction factors are therefore added depending on the number of knife-edges, as suggested in [21, 22]. A proper combination of ORT and diffuse scattering is also introduced in the model, since it led to a significant prediction improvement in some cases, as described in the next section. Since each scattering tile behaves as a secondary source for a new, spherical wave radiated in all directions, scattering or the combination of scattering and ORT seems to be efficient ways to reach non-line-of-sight (NLOS) Rxs in deep street canyons where diffraction from the roof edge is very weak, as depicted in Figure 2. The RT tool has been also extended to take into account the effect of terrain, through ground reflection and obstruction. In the considered simulation setup, a Digital Terrain Model (DTM) consisting of a raster file with a resolution of 10 m is used.
3
SCAT + ORT ORT
SCAT
Figure 2: ORT model in the vertical plane and combination with scattering.
2.3. Impact of Computation Parameters. Preliminary evaluations have shown that a very high number of interactions is not necessary to get good predictions. In particular, the performance usually saturates (i.e., the mean error to tends to zero) when at least 3 reflections are considered, with the exception of high-rise building zones, where we found that a minimum number of 4 reflections are required. At least 2 diffractions (besides the ORT path) are necessary to obtain realistic predictions in the vicinity of street crossings. On the other hand, we found that increasing the number of diffractions from vertical edges above 2 does not improve NLOS propagation, especially for receivers located quite far from the line-of-sight (LOS) street crossings. Also throughbuilding transmissions have been found to be important in some cases, especially for the buildings in proximity of the BSs. Finally, the impact of the diffuse scattering model and of its parameters on the model performance has been investigated: in particular, the area of the scattering tiles has been found to be a quite critical parameter which has to be set carefully, as illustrated in Section 3. Investigations showed that results are not very sensitive to the building’s material characteristics, as already highlighted in [23]. Ray tracing simulations were then performed with uniform material parameters (relative permittivity 𝜀𝑟 = 5, conductivity 𝜎 = 0.02 [S/m]), with a maximum of 4 reflections, 2 diffractions (also in combination with reflections), single-bounce diffuse scattering, and offline ORT combined with diffuse scattering as described above. Regarding the scattering parameter 𝑆, a value of 0.4 has been assumed for all building walls, in accordance with previous investigations’ findings [16]. No material parameter optimization has been performed in the present work. 2.4. CPU Time Reduction. The required computational burden still represents a strong limitation to the widespread use of RT. The computational effort strongly depends on the number of objects (buildings) included in the input database, and it could be therefore reduced through an effective simplification of it. Such a speed-up technique is suggested in [12] and consists of the reduction of the input database by identifying and selecting the “active set” of buildings/obstacles (or “active map”) and discarding the rest of the database. The “active set” consists of the buildings or obstacles that are actually involved in the propagation process. According to what was proposed in [12], the active map basically includes the buildings around and between
4
International Journal of Antennas and Propagation Table 1: Comparison between computation times and simulation results for site A000127C using full map and simplified map.
Full map Simplified map (standard method [12]) Simplified map (new method) ∗
Number of buildings
Computation time
% reduction in computation time
Mean prediction error∗
Std. dev. of prediction error∗
18050 8706 1923
≈3.5 days ≈1.5 days ≈10 hours
— 58% 88%
—