(RBFs). The reader is led from its basic properties to several original inves- tigations ...... in terms of the power function, which is independent of the data values. Now, our aim is to .... bitrarily high for infinitely smooth strictly positive definite functions, while for strictly positive ...... tion from scattered radon data, Dolomites Res.
University of Torino, Department of Mathematics Doctoral School: Sciences and Innovative Technologies Ph.D. Thesis of Sciences and Innovative Technologies Area: Mathematics Cycle XXIX
RBF-based Partition of Unity Method: Theory, Algorithms and Applications Emma Perracchione Advisor: Prof. Alessandra De Rossi Doctorate coordinator: Prof. Ezio Venturino Academic years: 2014 – 2015 – 2016
RBF-based Partition of Unity Method: Theory, Algorithms and Applications Emma Perracchione Torino, 1/01/2014 – 31/12/2016
Preface This dissertation gives a self-contained overview about the Partition of Unity (PU) interpolant, locally implemented by means of Radial Basis Functions (RBFs). The reader is led from its basic properties to several original investigations concerning efficiency, accuracy, shape preservation and numerical stability. Moreover, to motivate the reader, all the results are supported not only by extensive numerical experiments, but also by applications with real world data including geometric modeling, topography, medicine, resolution of Partial Differential Equations (PDEs) and population dynamics. Therefore, since the mathematical theory is put in the context of applications, all the Matlab codes are provided as free software packages. A part of the material presented here is submitted on international journals or already published. Such papers and co-authors are all mentioned in the references. Precisely, this thesis is the fruit of a three-years joint work with other researchers. Thus, I feel the duty to thank all them, starting from my advisor Prof. Alessandra De Rossi for her availability, patience, motivation and support furnished me during these years. Special thanks are also due to Prof. Ezio Venturino and Prof. Roberto Cavoretto for their insightful comments and encouragement. I could not have imagined to spend such a nice and enjoyable time with all of them. I would also like to acknowledge Prof. Stefano De Marchi and Dr. Gabriele Santin who provided me the opportunity to join their research. Furthermore, I feel the duty to express my gratitude to all my colleagues and in doing so special thanks are due to the co-authors Dr. Ilaria Stura and Dr. Giorgio Sabetta for their friendship and cooperation. Moreover, special thanks are due to the reviewers who helped me to improve the thesis. Last but not the least, I would like to thank my whole family for providing me with continuous encouragement throughout my years of study. Aside from the Department of Mathematics “G. Peano” of the University of Torino, this thesis has been partially supported by the projects “Metodi numerici nelle scienze applicate” (Principal Investigator (PI) Prof. Ezio Venturino), “Tecniche di interpolazione per PDE” (PI Prof. Matteo Semplice), “Metodi e modelli numerici per le scienze applicate” (PI Prof. Alessandra De Rossi), European Cooperation in Science and Technology (ECOST) and Gruppo Nazionale per il Calcolo Scientifico (GNCS–INdAM). i
Contents Preface
i
Introduction
4
1 Preliminaries: RBF-PU interpolation 1.1 The scattered data interpolation problem . . . . . . 1.1.1 Positive definite matrices and functions . . . 1.1.2 Integral characterization . . . . . . . . . . . . 1.2 The scattered data interpolation problem via RBFs . 1.2.1 Completely and multiply monotone functions 1.2.2 The uniqueness of the solution . . . . . . . . 1.2.3 Reproducing kernels and Hilbert spaces . . . 1.2.4 Error bounds for RBF interpolants . . . . . . 1.2.5 Examples of globally supported RBFs . . . . 1.2.6 Examples of compactly supported RBFs . . . 1.2.7 Trade-off principles . . . . . . . . . . . . . . . 1.3 Local RBF-based interpolation techniques . . . . . . 1.3.1 The PU method . . . . . . . . . . . . . . . . 1.3.2 Error bounds for RBF-PU interpolants . . . . 1.4 Modeling 3D objects via PU interpolation . . . . . . 1.4.1 The implicit approach . . . . . . . . . . . . . 1.4.2 Normals estimation . . . . . . . . . . . . . . . 1.5 Concluding remarks . . . . . . . . . . . . . . . . . .
. . . . . . . . . . . . . . . . . .
. . . . . . . . . . . . . . . . . .
. . . . . . . . . . . . . . . . . .
. . . . . . . . . . . . . . . . . .
. . . . . . . . . . . . . . . . . .
7 8 9 10 12 14 16 19 21 25 27 30 33 33 36 36 36 38 41
2 On the efficiency of the PU method 2.1 Computation of the S-PS . . . . . . . . . . . . . . 2.1.1 Definition of the PU framework . . . . . . . 2.1.2 The sorting-based data structure . . . . . . 2.1.3 The sorting-based searching procedure . . . 2.1.4 The computation of local distance matrices 2.2 Complexity analysis . . . . . . . . . . . . . . . . . 2.2.1 The sorting-based data structure . . . . . . 2.2.2 The sorting-based searching procedure . . .
. . . . . . . .
. . . . . . . .
. . . . . . . .
. . . . . . . .
. . . . . . . .
43 44 45 47 48 49 50 52 53
1
. . . . . . . .
Contents
2 . . . . . .
. . . . . .
. . . . . .
54 55 56 58 61 63
3 On the accuracy of the PU method 3.1 Formulation of the BLOOCV-PU method . . . . . . . . . 3.1.1 Error estimates . . . . . . . . . . . . . . . . . . . . 3.1.2 The BLOOCV error estimate . . . . . . . . . . . . 3.2 Computation of the BLOOCV-PU method . . . . . . . . . 3.2.1 Definition of the BLOOCV-PU framework . . . . . 3.2.2 The integer-based data structure . . . . . . . . . . 3.2.3 Selection of a searching interval for the PU radius 3.2.4 The BLOOCV local computation . . . . . . . . . . 3.3 Complexity analysis . . . . . . . . . . . . . . . . . . . . . 3.3.1 The integer-based data structure . . . . . . . . . . 3.3.2 The BLOOCV local computation . . . . . . . . . . 3.4 Numerical experiments . . . . . . . . . . . . . . . . . . . . 3.4.1 Results for quasi-uniform data . . . . . . . . . . . 3.4.2 Results for non-conformal data . . . . . . . . . . . 3.5 Application to Earth’s topography . . . . . . . . . . . . . 3.6 Concluding remarks . . . . . . . . . . . . . . . . . . . . .
. . . . . . . . . . . . . . . .
. . . . . . . . . . . . . . . .
64 66 66 67 69 70 70 71 72 73 73 73 75 77 80 80 83
4 On the positivity of the PU method 4.1 Formulation of the PC-PU method . . . . . . 4.1.1 The positivity property . . . . . . . . 4.1.2 A positive PU fit . . . . . . . . . . . . 4.2 Computation of the PC-PU method . . . . . 4.2.1 Definition of the PC-PU framework . 4.2.2 Selection of the positive constraints . . 4.2.3 The PC local computation . . . . . . . 4.3 Complexity analysis . . . . . . . . . . . . . . 4.4 Numerical experiments . . . . . . . . . . . . . 4.4.1 Results for compactly supported RBFs 4.4.2 Results for globally supported RBFs . 4.5 Application to prostate cancer . . . . . . . . 4.6 Concluding remarks . . . . . . . . . . . . . .
. . . . . . . . . . . . .
85 . 87 . 87 . 88 . 90 . 90 . 91 . 92 . 93 . 94 . 95 . 95 . 98 . 102
2.3
2.4 2.5
2.2.3 The computation of local distance matrices Numerical experiments . . . . . . . . . . . . . . . . 2.3.1 Results for bivariate interpolation . . . . . 2.3.2 Results for trivariate interpolation . . . . . Application to reconstruction of 3D objects . . . . Concluding remarks . . . . . . . . . . . . . . . . .
. . . . . . . . . . . . .
. . . . . . . . . . . . .
. . . . . . . . . . . . .
. . . . . .
. . . . . . . . . . . . .
. . . . . .
. . . . . . . . . . . . .
. . . . . .
. . . . . . . . . . . . .
. . . . . . . . . . . . .
5 On the stability of the PU method 104 5.1 Formulation of the WSVD-PU method . . . . . . . . . . . . . 105 5.1.1 The WSVD basis . . . . . . . . . . . . . . . . . . . . . 106 5.1.2 Krylov space methods . . . . . . . . . . . . . . . . . . 109
Contents 5.2
5.3 5.4
5.5 5.6
3
Computation of the WSVD-PU method . . . . 5.2.1 Definition of the WSVD-PU framework 5.2.2 The WSVD-PU method via the Lanczos 5.2.3 The WSVD local computation . . . . . Complexity analysis . . . . . . . . . . . . . . . Numerical experiments . . . . . . . . . . . . . . 5.4.1 Results for high-order RBFs . . . . . . . 5.4.2 Results for low-order RBFs . . . . . . . Application to elliptic PDEs . . . . . . . . . . . Concluding remarks . . . . . . . . . . . . . . .
. . . . . . . . . . . . procedure . . . . . . . . . . . . . . . . . . . . . . . . . . . . . . . . . . . . . . . . . .
. . . . . . . . . .
. . . . . . . . . .
112 112 112 113 114 115 115 115 118 123
6 Approximation of attraction basins via PU method 6.1 Computation of the attraction basins . . . . . . . . . . . 6.1.1 Definition of the approximation framework . . . 6.1.2 Detection of points defining the attraction basins 6.2 Numerical experiments . . . . . . . . . . . . . . . . . . . 6.2.1 Results for 2D systems . . . . . . . . . . . . . . . 6.2.2 Results for 3D systems . . . . . . . . . . . . . . . 6.3 Concluding remarks . . . . . . . . . . . . . . . . . . . .
. . . . . . .
. . . . . . .
124 . 126 . 126 . 129 . 132 . 133 . 136 . 141
7 Approximation of attraction basins: A concrete 7.1 Dolomiti Bellunesi National park . . . . . . . . . 7.1.1 The mathematical model . . . . . . . . . 7.1.2 Parameters estimation and simulations . . 7.2 Attraction basins and sensitivity analysis . . . . 7.2.1 Approximation of the attraction basins . 7.2.2 Perturbations on parameters . . . . . . . 7.3 Concluding remarks . . . . . . . . . . . . . . . .
. . . . . . .
. . . . . . .
. . . . . . .
Appendices A Computation of several sets of A.1 Halton points . . . . . . . . . A.2 Random points . . . . . . . . A.3 Non-conformal points . . . .
study . . . . . . . . . . . . . . . . . . . . . . . . . . . .
143 144 145 146 149 149 149 152 153
data points 154 . . . . . . . . . . . . . . . . . . 154 . . . . . . . . . . . . . . . . . . 155 . . . . . . . . . . . . . . . . . . 156
B Computation of kd-trees 160 B.1 The kd-tree data structure . . . . . . . . . . . . . . . . . . . . 160 B.2 The kd-tree searching procedure . . . . . . . . . . . . . . . . 161 Conclusions
162
References
163
Introduction This dissertation focuses on recent theoretical and computational developments in the field of scattered data approximation. More precisely, our attention is devoted to meshfree or meshless methods. Indeed, taking advantage of being independent of a mesh, they turn out to be truly performing in high dimensions. Unfortunately, not all of them allow to deal with a large number of points. Therefore, in order to avoid this drawback, we direct our research towards local methods. In particular, the Partition of Unity (PU) interpolant performed via local Radial Basis Functions (RBFs) is the kernel of this investigation. We provide extensive studies with original contributions concerning its efficiency, accuracy, positivity and stability. Moreover, we also consider several applications of such meshless local strategy. The detailed overview of the thesis is given in what follows, after a short historical review.
Historical remarks In a certain sense, we can affirm that the pioneer of the PU scheme has been D. Shepard. In fact, in the late 1960s he introduced, as an undergraduate student at Harvard University, what are now called the Shepard weights [242]. His studies have been motivated by the fields of geophysics and meteorology. Moreover, related to the same topics, we also have to mention few papers that contain sentences and traces which seem to indicate that the Shepard’s scheme was known before his work (see the paper by I.K. Crain and B.K. Bhattacharyya (1967) [69] or the one by W.R. Goodin et al. [137]). Even if here we consider meshfree methods in the context of approximation theory, we have to point out that they have been used for the first time in statistics. In fact, their study began in 1870 with the work of W.S.B. Woolhouse [276]. It has been further developed few years later by E.L. De Forest [78, 79] and in 1883 by J.P. Gram [142]. Such works gave rise to moving least squares approximation (also known as local regression in statistic literature). For what concerns approximation theory, the historical and theoretical foundation of meshless methods lies in the concept of positive definite func-
4
Introduction
5
tions or, more in general, positive definite kernels. Their development can be traced back to both the work of J. Mercer (1909) [193], a Fellow of Trinity College at Cambridge University, and the one of M. Mathias (1923) [183], who was a student at the University of Berlin. Their studies have been linked to Fourier transforms in the 1930s by S. Bochner [25], lecturer at the University of Munich at that time, and by I. Schoenberg [239], who was assistant professor at Colby College. Further studies about positive definite functions up to the mid 1970s have been collected by J. Stewart [247]. Later, C.A. Micchelli in 1986 made the connection between scattered data interpolation and positive definite functions [195]. Many positive definite functions are nowadays classified as RBFs. Such term appeared for the first time in a publication made by N. Dyn and D. Levin in 1983 [98]. However, earlier in the 1970s, many researchers introduced functions that are now called RBFs. For instance, the term multiquadrics is due to R. Hardy, geodesist at Iowa State University [149]. Moreover, in 1972 R.L. Harder and R.N. Desmarais, two aerospace engineers, introduced the Thin Plate Splines (TPSs) [148]. Always at the same time, such functions appeared in several papers by J. Duchon, a mathematician at the Université Joseph Fourier in Grenoble [95, 96, 97]. Furthermore, we also have to mention J. Meingnet who, working at the Université Catholique de Luouvain, in 1970s introduced what are now known as polyharmonic splines [187, 188, 189, 190]. However, in the theory of RBFs the main step forward has been carried out by R. Franke in the 1980s. He proposed a comprehensive study about several methods for multivariate interpolation [119, 120].
State of the art, motivations and targets Aside from this short historical remark, in this dissertation we mainly refer to the recent books by M.D. Buhmann, G.E. Fasshauer, M.J. McCourt and H. Wendland [31, 102, 105, 266]. Such works provide a recent and extensive treatment about the theory of RBF-based meshless approximation methods. Specifically, in Chapter 1, following their guidelines, we review the main theoretical features concerning positive definite functions and RBFs. Moreover, we also introduce the main topic of this dissertation, i.e. the PU technique. The PU method, because of its local approach, enables us to interpolate large multivariate scattered data sets. Anyway, especially in high dimensions, its implementation is far from being truly efficient. Moreover, depending on the nodes distribution, it might show difficulties in preserving the positivity of the data and suffer in terms of accuracy and stability. These topics are analyzed in the first part of the work (see Chapters 2– 5). Therefore, we provide robust approximation tools which turn out to be
Introduction
6
meaningful in many applied sciences, such as in computer graphics, Earth’s topography, medicine, physics and population dynamics. The latter topic is related to the problem of reconstructing the so-called attraction basins and it is widely investigated in Chapters 6–7. More into details, after introducing the main theoretical aspects in the first chapter, in Chapter 2, mostly considering the paper by G. Allasia et al. [2] and the related works of R. Cavoretto and A. De Rossi [47, 48], we develop an efficient implementation for bivariate and trivariate PU interpolants. The proposed scheme is further investigated and generalized for working with multivariate data sets in Chapter 3. Always in this chapter, inspired by several papers, such as the work of A. Safdari-Vaighani et al. [224] or the one of S. Deparis et al. [90], we propose a local numerical tool that turns out to be extremely accurate in case of data characterized by highly varying densities. After discussing these approaches, which enable us to achieve both efficiency and accuracy, we focus on the problem of preserving both the positivity and the stability of the PU interpolant. The former is analyzed in Chapter 4. Precisely, starting from the paper by J. Wu et al. [283], we propose a constrained local method which, besides preserving the positivity property, produces truly accurate results. Furthermore, in Chapter 5 we develop a stable local approximation method. In doing so, we principally refer to the authors S. De Marchi, G. Santin and R. Schaback with related publications [81, 82, 83]. The second part of this work deals with several applications of meshfree methods in the field of population dynamics (see Chapters 6–7). In general, given a mathematical model, in order to assess without uncertainty the final configuration of the system, we need the knowledge of both the Initial Conditions (ICs) and the basins of attraction. In Chapter 6 we point out how the PU method with local RBFs approximants can be effectively performed in order to give graphical representations of the basins of attraction. Note that meshless methods have already been used in a similar context (see e.g. the recent papers by P. Giesl and H. Wendland [129, 130]). Then, we conclude this investigation with Chapter 7, where a practical study about a model that deals with populations in natural parks is carried out (refer to L. Tamburino, V. La Morgia and E. Venturino with related papers [251, 252]). More precisely, in order to prevent the possible extinction of herbivores, we successfully apply our method for detecting the attraction basins.
Chapter 1
Preliminaries: Radial basis function partition of unity interpolation Given a set of data, i.e. measurements and locations at which these measurements were obtained, the aim is to find a function which fits the given data. In what follows, our criterion for a good fit is that the function must exactly match the given measurements at their corresponding locations. Moreover, we focus on non-uniform data sites and this leads to the process of scattered data interpolation. More formally, the approximation problem we consider throughout this dissertation is the following. Problem 1.1. Given XN = {xi , i = 1, . . . , N } ⊆ Ω a set of distinct data points (or data sites or nodes), arbitrarily distributed on a domain Ω ⊆ RM , with an associated set FN = {fi = f (xi ), i = 1, . . . , N } of data values (or measurements or function values), which are obtained by sampling some (unknown) function f : Ω −→ R at the nodes xi , the scattered data interpolation problem consists in finding a function R : Ω −→ R such that R (xi ) = fi ,
i = 1, . . . , N.
(1.1)
Usually, the interpolant R is expressed as a linear combination of some basis functions Bi , i.e. R (x) =
N X
ck Bk (x) ,
x ∈ Ω.
(1.2)
k=1
Since the interpolant is a linear combination of the basis functions, the scattered data interpolation problem always reduces to solve a linear system of the form Ac = f , where the entries of A are given by (A)ik = Bk (xi ), i, k = 1, . . . , N , c = (c1 , . . . , cN )T and f = (f1 , . . . , fN )T . 7
Chapter 1. Preliminaries: RBF-PU interpolation
8
It is well-known that the system has a unique solution whenever the matrix A is non-singular. Thus, we present in a general framework the main theoretical results devoted to establish conditions under which Problem 1.1 is well-posed, see Section 1.1. Then, we introduce a particular class of basis functions, namely RBFs, and we provide error estimates for the RBF interpolant, see Section 1.2. Moreover, since one of the main disadvantages of global RBF-based methods is the computational cost associated to the solution of large linear systems, we direct our research towards local techniques, specifically towards the PU method. It allows to deal with a large number of points in a reasonable time. Such technique, error bounds and applications to the reconstruction of 3D objects are illustrated in Sections 1.3 and 1.4. Finally, Section 1.5 deals with conclusions. A general remark for this chapter is that for the exposition we mainly follow [102, 105, 266]. Therefore, the reader can refer to these books for comprehensive treatments of the topic as well as for the proofs of the theorems which will be stated in the sequel (if no further informations are given in the text).
1.1
The scattered data interpolation problem
In order to choose the basis functions for which Problem 1.1 is well-posed, i.e. a solution to such problem exists and is unique, we have to introduce the so-called Haar systems. For a detailed analysis of such systems, see e.g. [240]. Definition 1.1. The finite-dimensional linear space B ⊆ C(Ω), with basis {Bk }N k=1 , is a Haar space on Ω if detA 6= 0, for any set of distinct data points XN = {xi , i = 1, . . . , N } ⊆ Ω. The set {Bk }N k=1 is called a Haar system. For example, this is the case of the space of the univariate polynomials of degree N − 1 which form a N -dimensional Haar space. However, in the multivariate case one can no longer ensure this result if one chooses the basis independent of the data sites. This is a consequence of the following theorem [72, 146, 178]. Theorem 1.1 (Haar-Mairhuber-Curtis). Suppose that Ω ⊆ RM , M ≥ 2, contains an interior point. Then there exist no Haar spaces of continuous functions except for trivial ones, i.e. spaces spanned by a single function. From Theorem 1.1, we can infer that, if we want a well-posed multivariate scattered data interpolation problem, the basis should depend on data points.
Chapter 1. Preliminaries: RBF-PU interpolation
9
In order to obtain such data-dependent approximation spaces and consequently methods which are meshfree, we need to introduce positive definite matrices and functions.
1.1.1
Positive definite matrices and functions
In this subsection we present the main theoretical results concerning positive definite functions, see e.g. [266] for further details. Definition 1.2. A real symmetric matrix A is called positive semi-definite if the associated quadratic form is non-negative, i.e. N X N X
ci ck (A)ik ≥ 0,
(1.3)
i=1 k=1
for c = (c1 , . . . , cN )T ∈ RN . If the quadratic form (1.3) is zero only for c ≡ 0, then A is called positive definite. In particular, we remark that if A is a positive definite matrix, then all its eigenvalues are positive and therefore A is non-singular. Thus, since we always require well-posed interpolation problems, we consider shifted basis functions. Specifically, we focus on functions Bk which are the shifts of a certain function Φ centred at xk , i.e. Bk (·) = Φ (· − xk ). In this way, the interpolation matrix will be positive definite. Then, we need to give the following definition. Definition 1.3. A complex-valued continuous function Φ : RM −→ C is called positive definite on RM if N N X X
ci ck Φ (xi − xk ) ≥ 0,
(1.4)
i=1 k=1
for any N distinct data points x1 , . . . , xN ∈ RM and c = (c1 , . . . , cN )T ∈ CN . The function Φ is called strictly positive definite on RM if the quadratic form (1.4) is zero only for c ≡ 0. In the following theorem we list some preliminary properties of positive definite functions. Theorem 1.2. If Φ is a positive definite function, then: i. Φ (0) ≥ 0. ii. Φ (−x) = Φ (x). iii. Since |Φ (x)| ≤ Φ (0), Φ is bounded. iv. If Φ (0) = 0, then Φ ≡ 0.
Chapter 1. Preliminaries: RBF-PU interpolation
10
v. Non-negative finite linear combinations of positive definite functions are positive definite, i.e. if Φ1 , . . . , ΦN are positive definite on RM and ck ≥ 0, k = 1, . . . , N , then Φ (x) =
N X
ck Φk (x) ,
x ∈ RM ,
k=1
is also positive definite. Moreover, if at least one of the Φk is strictly positive definite and the corresponding ck > 0, then Φ is strictly positive definite. vi. The product of (strictly) positive definite functions is (strictly) positive definite. In Definition 1.3 we consider complex-valued functions. This allows to characterize (strictly) positive definite functions by means of the Fourier transform. Specifically, an integral characterization for (strictly) positive definite functions turns out to be essential in the assessment of the conditions under which the interpolation problem is well-posed.
1.1.2
Integral characterization of (strictly) positive definite functions
Many results concerning the integral characterization of positive definite functions have been established in [24, 25]. In order to give several details of this representation, we need to recall the following definition (see e.g. [126, 222, 262]). Definition 1.4. The Fourier transform of a function f ∈ L1 (RM ) and its inverse are respectively given by 1 fˆ (ω) = q (2π)M and
Z
f (x) e−iω·x dx,
RM
1 fˇ (x) = q (2π)M
Z
f (ω) eix·ω dω,
RM
ω ∈ RM ,
x ∈ RM .
Moreover, the Fourier transform of a finite measure µ on RM is defined as µ ˆ (ω) = q
1
(2π)M
Z RM
e−iω·x dµ (x) ,
ω ∈ RM .
Then, the characterization of positive definite functions in terms of Fourier transforms is stated in the Bochner’s theorem.
Chapter 1. Preliminaries: RBF-PU interpolation
11
Theorem 1.3 (Bochner). A function Φ ∈ C(RM ) is positive definite on RM if and only if it is the Fourier transform of a finite non-negative Borel measure µ on RM , i.e. Φ (x) = µ ˆ (x) = q
1 (2π)M
Z
e−ix·y dµ (y) ,
RM
x ∈ RM .
Bochner’s original proof is detailed in [24]. However, there are many proofs of Theorem 1.3, see e.g. [71, 127]. Essentially, Theorem 1.3 affirms that all positive definite functions are generated by Φ. We remark that our aim consists in guaranteeing a wellposed interpolation problem. To this scope, we first introduce the concept of carrier of a Borel measure and then we consider the extension of the Bochner’s characterization to strictly positive definite functions [102]. Definition 1.5. The carrier of a non-negative Borel measure, defined on some topological space X, is given by X\ ∪ {O : O is open and µ (O) = 0} . Theorem 1.4. Let µ be a non-negative finite Borel measure on RM whose carrier is a set of nonzero Lebesgue measure. Then the Fourier transform of µ is strictly positive definite on RM . Note that Theorem 1.4 gives us a sufficient condition for a function to be strictly positive definite on RM . A way to construct strictly positive definite functions and a criterion to check whether a given function is strictly positive definite are respectively given in the following two statements [102, 266]. Corollary 1.1. Let Φ ∈ L1 (RM ) be a continuous non-negative function, not identically zero. Then the Fourier transform of Φ is strictly positive definite on RM . Theorem 1.5. A continuous function Φ ∈ L1 (RM ) is strictly positive definite if and only if Φ is bounded and its Fourier transform is non-negative and not identically equal to zero. From Theorem 1.5 we can deduce that if we suppose that Φ is not idenˆ be non-negative in order tically equal to zero, we only need to ensure that Φ for Φ to be strictly positive definite. Observe that Definition 1.3 covers complex-valued functions, anyway it is possible to characterize real-valued positive definite functions via the following theorem [266].
Chapter 1. Preliminaries: RBF-PU interpolation
12
Theorem 1.6. A real-valued continuous function Φ is positive definite on RM if and only if it is even and N X N X
ci ck Φ (xi − xk ) ≥ 0,
(1.5)
i=1 k=1
for any N distinct data points x1 , . . . , xN ∈ RM and c = (c1 , . . . , cN )T ∈ RN . The function Φ is called strictly positive definite on RM if the quadratic form (1.5) is zero only for c ≡ 0. In what follows, we focus on RBFs as basis functions (see e.g. [31, 32, 42, 100, 102, 159]).
1.2
The scattered data interpolation problem via radial basis functions
Many interesting strictly positive definite functions belong to the class of radial functions. For this reason in (1.2) we focus on RBFs as basis functions. Definition 1.6. A function Φ : RM −→ R is called radial if there exists a univariate function φ : [0, ∞) −→ R such that Φ (x) = φ (r) ,
where
r = kxk ,
and k·k is some norm on RM . Even if we characterize a (strictly) positive definite function in terms of a multivariate function Φ, when we deal with a radial function, i.e. Φ (x) = φ (kxk), it is convenient to also refer to the univariate function φ as a positive definite radial function. As an immediate consequence, we have the following lemma [102]. Lemma 1.7. Suppose that Φ = φ (k·k) is (strictly) positive definite and radial on RM , then Φ is also (strictly) positive definite and radial on RP with P ≤ M . Coming back to the integral characterization, we first point out that the Fourier transform of a radial function is again radial [266]. Theorem 1.8. Let Φ ∈ L1 (RM ) be continuous and radial, i.e. Φ (x) = ˆ (ω) = FM φ (kωk), φ (kxk). Then its Fourier transform is also radial, i.e. Φ with Z ∞ 1 FM φ (r) = √ φ (t) tM/2 J(M −2)/2 (rt) dt, rM −2 0 where J(M −2)/2 is the classical Bessel function of the first kind of order (M − 2) /2.
Chapter 1. Preliminaries: RBF-PU interpolation
13
Then, we enunciate a theorem characterizing positive definite and radial functions. Its original formulation can be found in [239], see also [265]. Theorem 1.9. A continuous function φ : [0, ∞) −→ R is positive definite and radial on RM if and only if it is the Bessel transform of a finite nonnegative Borel measure µ on [0, ∞), i.e. Z ∞
DM (rt) dµ (t) ,
φ (r) = 0
where cos r, � � � �(M −2)/2 DM (r) = M 2 Γ J(M −2)/2 (r) ,
r
2
for M = 1, for M ≥ 2.
A Fourier transform characterization of strictly positive definite radial functions on RM can be found in [266]. Theorem 1.10. A continuous function φ : [0, ∞) −→ R such that r − 7 → rM −1 φ (r) ∈ L1 [0, ∞) is strictly positive definite and radial on RM if and only if the M -dimensional Fourier transform FM φ (r) = √
1
Z ∞
rM −2
0
φ (t) tM/2 J(M −2)/2 (rt) dt,
is non-negative and not identically equal to zero. The class of functions that are positive definite on RM for all M was also characterized in [239]. An extension to the strictly positive definite case can be found in [195]. Theorem 1.11 (Schoenberg). A continuous function φ : [0, ∞) −→ R is strictly positive definite and radial on RM for all M if and only if Z ∞
φ (r) =
e−r
2 t2
dµ (t) ,
(1.6)
0
where µ is a finite non-negative Borel measure on [0, ∞) not concentrated at the origin. We can observe that the characterization of (strictly) positive definite radial functions of Theorem 1.11 implies that we have a finite non-negative Borel measure µ on [0, ∞) of the form (1.6). If we want to find a zero r0 of φ then we have to solve Z ∞
φ (r0 ) =
2 2
e−r0 t dµ (t) .
0
Since the exponential function is positive and the measure is non-negative, µ must be the zero measure. Anyway, then φ is identically equal to zero. Therefore, a non-trivial function φ that is positive definite and radial on RM for all M can have no zeros. In particular, this implies the following theorem [102].
Chapter 1. Preliminaries: RBF-PU interpolation
14
Theorem 1.12. There are no oscillatory univariate continuous functions that are strictly positive definite and radial on RM for all M . Moreover, there are no compactly supported univariate continuous functions that are strictly positive definite and radial on RM for all M . The statement of Theorem 1.12 is taken from [102]. However, an equivalent argument for the oscillatory case is given in [113]. Fourier transform is not always easy to be computed. Therefore, in order to decide whether a function is strictly positive definite and radial, a characterization via completely and multiply monotone functions might be useful.
1.2.1
Completely and multiply monotone functions
Many results concerning completely and multiply monotone functions have been established in [67, 109, 272]. To introduce such functions, we need to define the Laplace transform (see e.g. the definition given in [102]). Definition 1.7. Let f be a piecewise continuous function that satisfies |f (t)| ≤ P eat for some constants a and P . The Laplace transform of f is given by Z ∞
Wf (s) =
f (t)e−st dt,
s > a,
0
while the Laplace transform of a Borel measure µ on [0, ∞) is defined as Wµ(s) =
Z ∞
e−st dµ(t).
0
Note that the Laplace transform is continuous at the origin if and only if µ is finite. Let us define completely monotone functions. Such class is useful to characterize functions that are positive definite and radial. Definition 1.8. A function φ : [0, ∞) −→ R is called completely monotone on [0, ∞) if φ ∈ C[0, ∞) ∩ C ∞ (0, ∞) and (−1)q φ(q) (r) ≥ 0, for each q = 0, 1, . . ., and r > 0. We now point out several immediate properties of completely monotone functions (see e.g. [67, 109, 272]): i. a non-negative finite linear combination of completely monotone functions is completely monotone, ii. the product of two completely monotone functions is completely monotone,
Chapter 1. Preliminaries: RBF-PU interpolation
15
iii. if φ is completely monotone and ψ is absolutely monotone, i.e. ψ (q) ≥ 0 for all q ≥ 0, then ψ ◦ φ is completely monotone, iv. if φ is completely monotone and ψ is a positive function such that its derivative is completely monotone, then φ ◦ ψ is completely monotone. The following theorem gives an integral characterization of completely monotone functions. Theorem 1.13 (Bernstein-Hausdorff-Widder). Let us consider a function φ : [0, ∞) −→ R. Then, φ is completely monotone on [0, ∞) if and only if it is the Laplace transform of a finite non-negative Borel measure µ on [0, ∞), i.e. φ is of the form φ(r) = Wµ(r) =
Z ∞
e−rt dµ(t).
0
For the original formulation of Theorem 1.13, refer to [272]. Alternatively, see also [67, 266]. We now give a connection between positive definite radial and completely monotone functions. It has been first pointed out in [239]. Theorem 1.14. A function φ is completely monotone on [0, ∞) if and only if Φ = φ(k·k2 ) is positive definite and radial on RM for all M . Moreover, from [239], we also know that strict positive definiteness follows from complete monotonicity. While, a proof that the converse also holds can be found in [266]. Theorem 1.15. A function φ : [0, ∞) −→ R is completely monotone but not constant if and only if φ(k·k2 ) is strictly positive definite and radial on RM for all M . Let us define multiply monotone functions. They are useful to test whether a radial function is strictly positive definite on RM for some value of M . Definition 1.9. A function φ : (0, ∞) −→ RM is called k-times monotone on (0, ∞) if φ ∈ C k−2 (0, ∞), k ≥ 2, and (−1)q φ(q) (r) is non-negative, nonincreasing and convex for each q = 0, . . . , k − 2. In case k = 1 we only require φ ∈ C(0, ∞) to be non-negative and non-increasing. The connection between strictly positive definite radial functions and the class of multiply monotone functions is given in [274] via the following theorem.
Chapter 1. Preliminaries: RBF-PU interpolation
16
Theorem 1.16 (Williamson). A continuous function φ : (0, ∞) → R is k-times monotone on (0, ∞) if and only if it is of the form Z ∞
φ(r) = 0
(1 − rt)k−1 + dµ(t),
where µ is a non-negative Borel measure on (0, ∞). Finally, the following statement provides us a criterion to check the strict positive definiteness of a radial function. In literature this theorem was stated in [195] and then refined in [32]. Theorem 1.17 (Micchelli). Let k = bM/2c + 2 be a positive integer. Suppose that φ : [0, ∞) −→ R, φ ∈ C[0, ∞), is k-times monotone on (0, ∞) but not constant, then φ is strictly positive definite and radial on RM for any M such that bM/2c ≤ k − 2.
1.2.2
The uniqueness of the solution
We now give a natural generalization of the definition of positive definite functions for RBFs. Definition 1.10. A real-valued continuous even function Φ is called conditionally positive definite of order L on RM if N N X X
ci ck Φ (xi − xk ) ≥ 0,
(1.7)
i=1 k=1
for any N distinct data points x1 , . . . , xN ∈ RM and c = (c1 , . . . , cN )T ∈ RN satisfying N X
ci p (xi ) = 0,
i=1
for any real-valued polynomial p of degree at most L − 1. The function Φ is called strictly conditionally positive definite of order L on RM if the quadratic form (1.7) is zero only for c ≡ 0. Also for conditionally positive definite (radial) functions there exists an integral characterization. It is a generalization of Bochner’s theorem, refer to [144, 249] for further details. Thus, in case of RBFs we need to modify (1.2) by adding a lower-degree M -variate polynomial term. Moreover, even if Definition 1.6 holds for a generic norm, in the sequel we consider the Euclidean norm k·k2 and thus a RBF interpolant is defined as follows.
Chapter 1. Preliminaries: RBF-PU interpolation
17
Definition 1.11. Given XN and FN , a RBF interpolant R : Ω −→ R assumes the form R (x) =
N X
ck φ (kx − xk k2 ) +
l X
0
ck0 pk0 (x) ,
0
k=1
x ∈ Ω,
(1.8)
k =1
where p1 , . . . , pl , are a basis for the l-dimensional linear space ΠM L−1 of polynomials of total degree less than or equal to L − 1 in M variables, where !
L−1+M . L−1
l=
Since the conditions (1.1) must be satisfied, solving the interpolation problem (1.8) leads to solve a linear system of the form A PT |
P O
{z A
!
c 0 c
!
} | {z } y
!
f , 0
=
(1.9)
| {z } b
where the entries of the interpolation matrix A are (A)ik = φ (kxi − xk k2 ) , (P )ik0 = pk0 (xi ) ,
i, k = 1, . . . , N,
i = 1, . . . , N, 0
0
0
k = 1, . . . , l.
0
Moreover, c = (c1 , . . . , cN )T , c = (c1 , . . . , cl )T , f = (f1 , . . . , fN )T , 0 is a zero vector of length l and O is a l × l zero matrix. In order to establish conditions under which the interpolation problem is well-posed, we give the following definition. Definition 1.12. A set XN = {xi , i = 1, . . . , N } ⊆ Ω of data points is called a (L − 1)-unisolvent set if the only polynomial of total degree at most L − 1 interpolating zero data on XN is the zero polynomial. Essentially, if the data come from a polynomial of total degree less than or equal to L − 1, then they are exactly fitted with (1.8). The following theorem on polynomial reproduction assesses conditions under which the interpolation problem admits a unique solution [102]. Theorem 1.18. If the function φ in (1.8) is strictly conditionally positive definite of order L on RM and the set XN = {xi , i = 1, . . . , N } ⊆ Ω of data points forms a (L − 1)-unisolvent set, then the system of linear equations (1.9) admits a unique solution. Moreover, since an N ×N matrix A that is conditionally positive definite of order L is positive definite on a subspace of dimension N − l, it has at least N − l positive eigenvalues. This is due to the following theorem [194].
Chapter 1. Preliminaries: RBF-PU interpolation
18
Theorem 1.19 (Courant-Fischer). Let A be a real symmetric N × N matrix with eigenvalues λ1 ≥ · · · ≥ λN , then !
λk = max
dimV=k
min
x∈V, kxk=1
xT Ax ,
and
!
λk =
min
dimV=n−k+1
max
x∈V, kxk=1
T
x Ax ,
where V denotes a subspace of RN . In the case L = 1 we have a stronger result stated in the following theorem [102]. Theorem 1.20. An N × N matrix A which is conditionally positive definite of order one and has a non-positive trace possesses one negative and N − 1 positive eigenvalues. Moreover, using Theorems 1.19 and 1.20, one can show that the interpolation with strictly conditionally positive definite functions of order one is possible without appending the constant term to solve the interpolation problem. This was first proved in [195]. To describe this fact, we need to point out that, by virtue of the equivalence stated in Definition 1.6, we can rewrite the entries of the interpolation matrix A as [102] (A)ik = Φ (xi − xk ) ,
i, k = 1, . . . , N.
(1.10)
Theorem 1.21. Suppose that Φ is strictly conditionally positive definite of order one and Φ(0) ≤ 0. Then, for any N distinct data points XN = {xi , i = 1, . . . , N } ⊆ Ω, the matrix A, with entries (A)ik = Φ (xi − xk ), has one negative and N − 1 positive eigenvalues and therefore is non-singular. If L = 0 we have strictly conditionally positive definite functions of order zero, i.e. strictly positive definite functions. As a consequence, since the interpolation matrix is non-singular, the notation simplifies. Therefore, in this case, given XN and FN , a RBF interpolant R : Ω −→ R assumes the form R (x) =
N X
ck φ (kx − xk k2 ) ,
x ∈ Ω.
(1.11)
k=1
Moreover, the entries of the interpolation matrix associated to the linear system Ac = f , (1.12) are given by (A)ik = φ (kxi − xk k2 ) ,
i, k = 1, . . . , N.
Chapter 1. Preliminaries: RBF-PU interpolation
19
Once we determine c by solving the system (1.12), we can evaluate the RBF interpolant at a point x as R (x) = φT (x) c,
(1.13)
where φT (x) = (φ (kx − x1 k2 ) , . . . , φ (kx − xN k2 )) . In order to formulate error bounds for the RBF interpolant, we need to introduce the so-called native spaces.
1.2.3
Reproducing kernels and Hilbert spaces
Focusing on strictly positive definite functions, our aim is to give error bounds for the RBF interpolant. Starting from (1.10), we study here the more general situation where Φ : RM × RM −→ R is a strictly positive definite kernel, i.e. the entries of A are given by (A)ik = Φ (xi , xk ) , i, k = 1, . . . , N. (1.14) The uniqueness result holds also in this general case. For each positive definite and symmetric kernel Φ it is possible to define an associated real Hilbert space, the so-called native space NΦ (Ω). Definition 1.13. Let H be a real Hilbert space of functions f : Ω −→ R, with inner product (·, ·)H . A function Φ : Ω×Ω −→ R is called a reproducing kernel for H if: i. Φ (·, x) ∈ H, for all x ∈ Ω, ii. f (x) = (f, Φ (·, x))H , for all f ∈ H and for all x ∈ Ω (reproducing property). Reproducing kernels, first introduced in [6], are a classical concept in analysis. It is well-known that the reproducing kernel of a Hilbert space is unique and that existence is equivalent to the fact that the point evaluation functionals δx are bounded linear functionals on Ω, i.e. there exists a positive constant Mx such that |δx f | = |f (x)| ≤ Mx ||f ||H , for all f ∈ H and x ∈ Ω. Additional properties are shown in the following theorem [102]. Theorem 1.22. If H is a Hilbert space of functions f : Ω −→ R, with reproducing kernel Φ, then: i. Φ (x, y) = (Φ (·, y) , Φ (·, x))H , for x, y ∈ Ω,
Chapter 1. Preliminaries: RBF-PU interpolation
20
ii. Φ (x, y) = Φ (y, x), for x, y ∈ Ω, iii. convergence in Hilbert space norm implies pointwise convergence, i.e. if we have kf − fn kH −→ 0 for n −→ ∞ then |f (x) − fn (x) | −→ 0 for all x ∈ Ω. After denoting with H∗ the space of bounded linear functionals on H, i.e. its dual, we state the following theorem [102]. It provides a connection between strictly positive definite functions and reproducing kernels. Theorem 1.23. Suppose H is a reproducing kernel Hilbert function space with reproducing kernel Φ : Ω × Ω −→ R. Then Φ is positive definite. Moreover, Φ is strictly positive definite if and only if the point evaluation functionals δx are linearly independent in H∗ . Theorem 1.23 provides one direction of the connection between strictly positive definite functions and reproducing kernels. However, we also want to know how to construct a reproducing kernel Hilbert space associated with strictly positive definite functions. To this aim, let us first note that from Definition 1.13 we have that H contains all functions of the form f=
N X
ck Φ(·, xk ),
k=1
with xk ∈ Ω. As a consequence, we have that ||f ||2H =
N N X X
ci ck Φ(xi , xk ).
i=1 k=1
Thus, we define the following space HΦ (Ω) = span{Φ (·, x) , x ∈ Ω}, equipped with the bilinear form (·, ·)HΦ (Ω) defined as m X i=1
ci Φ (·, xi ) ,
n X k=1
!
dk Φ (·, xk )
= HΦ (Ω)
n m X X
ci dk Φ (xi , xk ) .
i=1 k=1
By virtue of the above definition of the bilinear form, we can state the following theorem [102]. Theorem 1.24. If Φ : Ω × Ω −→ R is a symmetric strictly positive definite kernel, then the bilinear form (·, ·)HΦ (Ω) defines an inner product on HΦ (Ω). Furthermore, HΦ (Ω) is a pre-Hilbert space with reproducing kernel Φ. Since Theorem 1.24 just shows that HΦ (Ω) is a pre-Hilbert space, i.e. need not be complete, we now define the native space NΦ (Ω) of Φ to be the completion of HΦ (Ω) with respect to the norm ||·||HΦ (Ω) so that ||f ||HΦ (Ω) = ||f ||NΦ (Ω) , for all f ∈ HΦ (Ω), see [102, 266]. Native spaces for strictly (conditionally) positive definite functions can be constructed following [230, 231, 236]. Moreover, they are fundamental to give error bounds.
Chapter 1. Preliminaries: RBF-PU interpolation
1.2.4
21
Error bounds for radial basis function interpolants
In order to give an error bound, the key is to express the interpolant in Lagrange form, i.e. using the so-called cardinal basis functions [281]. To this aim let us consider the following theorem. Theorem 1.25. Suppose Φ is a strictly positive definite kernel. Then, for any set XN = {xi , i = 1, . . . , N } ⊆ Ω of distinct data points, there exist functions u∗k ∈ span{Φ(·, xk ), k = 1, . . . , N } such that u∗k (xi ) = δik . The resulting interpolant in cardinal form is given by N X
R (x) =
f (xk ) u∗k (x) ,
x ∈ Ω.
k=1
We now need to define the so-called power function. To this scope, for any strictly positive definite kernel Φ ∈ C(Ω × Ω), any set of distinct points XN = {xi , i = 1, . . . , N } ⊆ Ω, and any vector u ∈ RN , we define the quadratic form Q (u) = Φ (x, x) − 2
N X k=1
uk Φ (x, xk ) +
N N X X
ui uk Φ (xi , xk ) .
i=1 k=1
Definition 1.14. Suppose Ω ⊆ RM and Φ ∈ C(Ω × Ω) is strictly positive definite. For any distinct points of the set XN = {xi , i = 1, . . . , N } ⊆ Ω the power function is defined by [PΦ,XN (x)]2 = Q (u∗ (x)) , where u∗ is the vector of cardinal functions from Theorem 1.25. Taking into account the definition of the cardinal functions, computationally speaking, the power function can be calculated as PΦ,XN (x) =
q
Φ (x, x) − (b (x))T A−1 b (x),
(1.15)
where b = (Φ(·, x1 ), . . . , Φ(·, xN ))T . We are now able to give the following theorem [102]. Theorem 1.26. Let Ω ⊆ RM , Φ ∈ C(Ω × Ω) be a strictly positive definite kernel and suppose that the points XN = {xi , i = 1, . . . , N } ⊆ Ω are distinct. Then |f (x) − R (x) | ≤ PΦ,XN (x) ||f ||NΦ (Ω) , x ∈ Ω, where f ∈ NΦ (Ω).
Chapter 1. Preliminaries: RBF-PU interpolation
22
Theorem 1.26 allows to estimate the interpolation error by considering the smoothness of the data points measured in terms of the native space norm of f , which is independent of the data sites but dependent on Φ, and in terms of the power function, which is independent of the data values. Now, our aim is to refine this error estimate by expressing the influence of the nodes in function of their regularity. Thus, we define two common indicators of data regularity: the so-called separation distance and fill distance. Definition 1.15. The separation distance is given by qXN =
1 min kxi − xk k2 . 2 i6=k
(1.16)
The quantity qXN represents the radius of the largest ball that can be centred at every point in XN such that no two balls overlap. Definition 1.16. The fill distance, which is a measure of data distribution, is given by � � hXN = sup
x∈Ω
min kx − xk k2 .
xk ∈XN
(1.17)
The quantity (1.17) indicates how well the data fill out the domain Ω. A geometric interpretation of the fill distance is given by the radius of the largest possible empty ball that can be placed among the data locations inside Ω. Remark 1.1. The distances (1.16) and (1.17) give an idea of the node distribution, i.e. how uniform data are. Indeed, a set of data is supposed to be quasi-uniform with respect to a constant Cqu if qXN ≤ hXN ≤ Cqu qXN .
(1.18)
More specifically, the definition of quasi-uniform points has to be seen in the context of more than one data set. The idea is to consider a sequence of such sets so that the domain Ω is more and more filled out. Then, points are said to be quasi-uniform if (1.18) is satisfied by all the sets in this sequence with the same constant Cqu [266]. In numerical analysis, to obtain error bounds a common strategy is to take advantage of the polynomial precision of a method and then to apply a Taylor expansion. Theorem 1.27. Let Ω ⊆ RM , and suppose that Φ ∈ C(Ω × Ω) is strictly positive definite on RM . Let XN = {xi , i = 1, . . . , N } ⊆ Ω be a set of distinct data points and define the quadratic form Q(u). The minimum of Q(u) is given by the vector u = u∗ (x) in Theorem 1.25, i.e. Q (u∗ (x)) ≤ Q(u),
for all u ∈ RN .
Chapter 1. Preliminaries: RBF-PU interpolation
23
We now need some technical considerations. Definition 1.17. Ω ⊆ RM satisfies an interior cone condition if there exist an angle θ ∈ (0, π/2) and a radius γ > 0 such that, for all x ∈ Ω, a unit vector ξ (x) exists such that the cone C = {x + λy : y ∈ RM , ||y||2 = 1, y T ξ (x) ≥ cos (θ) , λ ∈ [0, γ]}, is contained in Ω. Let ΠM L−1 be the set of polynomials of degree L − 1. Then, we consider the following result [266]. Theorem 1.28. Suppose that Ω ⊆ RM is compact and satisfies an interior cone condition with angle θ = (0, π/2) and radius γ > 0. Suppose that there exist h0 , C1 , C2 > 0 constants depending only on M , θ and γ, such that hXN ≤ h0 . Then, for all XN = {xi , i = 1, . . . , N } ⊆ Ω and every x ∈ Ω, there exist functions vk : Ω −→ R, k = 1, . . . , N, such that: i.
PN
ii.
PN
k=1 vk
(x) p (xk ) = p (x), for all p ∈ ΠM L−1 ,
k=1 |vk
(x) | ≤ C1 ,
iii. vk (x) = 0 provided that kx − xk k2 ≥ C2 hXN . From Theorem 1.28 we can deduce that the first property yields the polynomial precision. Moreover the third one shows that the scheme is local. Finally, the upper bound shown in the second property is essential for controlling the growth of the error. In what follows we introduce the multi-index notation. Specifically, letPM ting β = (β1 , . . . , βM ) ∈ NM i=1 βi , we define the differential 0 , with |β| = β operator D as ∂ |β| Dβ = , (∂x1 )β1 · · · (∂xM )βM and the notation D2β Φ (w, ·) indicates that the operator is applied to Φ (w, ·) viewed as a function of the second variable. The multivariate Taylor expansion of the function Φ(w, ·) centred at w is given by X D β Φ(w, w) 2 Φ(w, z) = (z − w)β + r(w, z), |β| 1,
with a univariate polynomial pM,h of degree bM/2c + 3h + 1. Moreover, ϕ ∈ C 2h (R) are unique up to a constant factor, and the polynomial degree is minimal for given space dimension M and smoothness 2h. Here we give the explicit formulas to compute the functions ϕM,h for all M and h = 0, 1, 2, 3, see [103]. Theorem 1.36. The functions ϕM,h , h = 0, 1, 2, 3, have the form: . ϕM,0 (r) = (1 − r)s+ , . ϕM,1 (r) = (1 − r)s+1 + [(s + 1) r + 1] , � 2 � � . ϕM,2 (r) = (1 − r)s+2 s + 4s + 3 r2 + (3s + 6) r + 3 , + � 3 � . ϕM,3 (r) = (1 − r)s+3 s + 9s2 + 23s + 15 r3 + + 6s2 + 36s + 45 r2 + (15s + 45) r + 15 , �
�
Chapter 1. Preliminaries: RBF-PU interpolation
29
. where s = bM/2c + h + 1, and = denotes equality up to a positive constant factor. For the compactly supported Wendland’s functions ϕM,h , from (1.20), we have that h+1/2−|α|
|Dα f (x) − Dα R(x)| ≤ ChXN
||f ||NΦ (Ω) ,
provided |α| < h, hXN is sufficiently small and f ∈ NΦ (Ω). Then, we can consider some examples of Wendland’s functions along with their smoothness degree: . ϕ3,0 (r) = (1 − εr)2+ , C0 . C2 ϕ3,1 (r) = (1 − εr)4+ (4εr + 1) , (1.24) � . C4 ϕ3,2 (r) = (1 − εr)6+ 35(εr)2 + 18εr + 3 , � . C6 ϕ3,3 (r) = (1 − εr)8+ 32(εr)3 + 25(εr)2 + 8εr + 1 . The second class of compactly supported functions we analyze is the family of Wu’s functions [278]. Let us consider �
ψ(r) = 1 − r2
�s +
s ∈ N,
,
which is not strictly positive definite and radial on RM . Anyway, using convolution, we obtain the function ψs (r) = (ψ ∗ ψ)(2r) =
Z 1 �
1 − t2
�s h
−1
+
1 − (2r − t)2
is +
dt,
which is strictly positive definite and radial on R. By considering the operator D, a family of strictly positive definite radial functions is constructed. Definition 1.20. With ψs (r) = [(1 − ·2 )s+ ∗ (1 − ·2 )s+ ](2r) we define ψk,s = Dk ψs . The functions ψk,s are strictly positive definite and radial on RM for M ≤ 2k + 1 and are polynomials of degree 4s − 2k + 1 on their support. Note that in the interior of the support ψs ∈ C 2(s−k) , while on the boundary the smoothness increases and ψs ∈ C 2s−k . Here we list some of the most commonly used Wu’s functions along with their degree of smoothness: � . ψ3,3 (r) = (1 − εr)4+ 16 + 29εr + 20(εr)2 + 5(εr)3 , C0 . ψ2,3 (r) = (1 − εr)5+ 8 + 40εr + 48(εr)2 + 25(εr)3 C2 +5(εr)4 , . ψ1,3 (r) = (1 − εr)6+ 6 + 36εr + 82(εr)2 + 72(εr)3 �
+30(εr)4
C4
� 5
+ 5(εr) , . ψ0,3 (r) = (1 − εr)7+ 5 + 35εr + 101(εr)2 + 147(εr)3 +101(εr)4 + 35(εr)5 + 5(εr)
� 6
.
C6
(1.25)
Chapter 1. Preliminaries: RBF-PU interpolation
30
To conclude this subsection we illustrate how, starting from the Wendland’s functions and applying the turning bands operator [132], we can obtain the Gneiting’s functions. Let us consider a function ϕM that is strictly positive definite and radial on RM for M ≥ 3. By applying the turning bands operator (see [181]) we obtain the following function ϕM −2 (r) = ϕM (r) +
rϕ0M (r) , M −2
which is strictly positive definite and radial on RM −2 . In order to understand the process we give the following example (see [102]). Example 1.1. Starting from the Wendland’s function ϕ4,1 (r) = (1 − r)l+1 + [(l + 1)r + 1] , and applying the turning bands operator we obtain the functions τ2,l (r) = (1 −
r)l+
(l + 1)(l + 4) 2 1 + lr − r , 2
�
�
which are strictly positive definite and radial on R2 provided l ≥ 7/2. We list some functions from this family for various choices of l: . τ2,7/2 (r) = . τ2,5 (r) = . τ2,15/2 (r) = . τ2,12 (r) =
1.2.7
7/2
(1 − εr)+
1 + 7/2(εr) − 135/8(εr)2 ,
C2
�
(1 − εr)5+ (1 + 5εr − 27(εr)2 ), 15/2
(1 − εr)+
C2 � 2
1 + 15/2(εr) − 391/8(εr)
2 (1 − εr)12 + (1 + 12εr − 104(εr) ).
,
C2 C2
Trade-off principles
The interpolation method previously shown is stable, in the sense that the operator f 7−→ R is stable as an operator. However, if the interpolation matrix A is ill-conditioned, the approximation method could be highly unstable. Therefore, the concept of numerical stability is linked to the condition number of the interpolation matrix A, which is defined as cond(A) = ||A||2 ||A−1 ||2 =
σmax , σmin
(1.26)
where σmax and σmin are the largest and smallest singular values of A. If such matrix is positive definite, the quantity (1.26) can be computed as λmax /λmin , where λmax and λmin are the largest and smallest eigenvalues. Moreover, if Φ is a strictly positive definite translation-invariant function, we have λmax ≤ N Φ(0). (1.27)
Chapter 1. Preliminaries: RBF-PU interpolation
31
In fact, we know that [194] N X
|λmax − (A)ii | ≤
|(A)ik | ,
k=1,k6=i
for some i ∈ {1, . . . , N }. Therefore, λmax ≤ N
max
i,k=1,...,N
|(A)ik | = N
max
xi ,xk ∈XN
|Φ(xi − xk )| ,
but, since Φ is strictly positive definite, (1.27) holds. Therefore, if the data sites are quasi-uniform, λmax grows at most like −M hXN . Anyway, in order to estimate (1.26), we need to find a lower bound for λmin , or a correspondingly upper bound for ||A−1 ||2 . Several papers, such as [16, 201, 202, 203], deal with this topic. In particular, they use the following result which gives the smallest eigenvalue of a symmetric positive definite matrix as [15] cT Ac λmin = min . c∈RN \0 cT c This is used to prove the following bound for the norm of the inverse of A. Lemma 1.37. Let x1 , . . . , xN be distinct points in RM , A be the interpolation matrix and Φ : RM −→ R be either strictly positive definite, or strictly conditionally negative definite of order one with Φ(0) ≤ 0. If N N X X
ci ck (A)ik ≥ Θ||c||22 ,
i=1 k=1
is satisfied whenever the components of c satisfy
PN
i=1 ci
= 0, then
||A−1 ||2 ≤ Θ−1 . Note that for positive definite matrices we have Θ = λmin and this shows why lower bounds on the smallest eigenvalue correspond to upper bounds on the norm of the inverse of A. Further bounds for specific functions in terms of separation distance can be found in [228, 235, 266]. In particular, we need to define the following (space-dependent) quantity CM =
1 2Γ
�
�
M +2 2
�
SM √ 8
�M
,
where Γ is the well-known Γ function and
SM = 12
πΓ2
�
M +2 2
9
� 1/(M +1)
≤ 6.38M.
(1.28)
Chapter 1. Preliminaries: RBF-PU interpolation
32
Then, we can define specific bounds for different basis functions; for instance, for the Gaussian RBF φ1 (see (1.21)) we obtain √ 2 −M 2 λmin ≥ CM ( 2ε)−M e−40.71M /(qXN ε) qX . N Such bound confirms that, for a fixed shape parameter, the lower bound λmin goes exponentially to zero as the separation distance decreases. Moreover, we point out that, for RBFs with a finite regularity, usually, the quantity (1.28) also depends on their degree of smoothness. As example, for the compactly supported Wendland’s functions ϕM,h one obtains 2h+1 λmin ≥ CM,h qX . N
This lower bound goes to zero with the separation distance at a polynomial rate. The concept of condition number is linked to the first trade-off or uncertainty principle [233, 234], which consists in a conflict between theoretical accuracy and numerical stability. In fact, if a large number of interpolation nodes are involved, the RBF systems may suffer from ill-conditioning. It is linked to the order of the basis functions and to the node distribution. Therefore, the ill-conditioning grows primarily due to the decrease of the separation distance qXN and not necessarily due to the increase of data points. Note that if we reduce the value of the shape parameter, then the condition number grows again. This is consistent with the fact that for small values of ε the basis functions resemble a constant function. Therefore, even for well separated data points, the matrix is close to be singular. For this reason a value of the shape parameter that yields maximal accuracy and maintains numerical stability has been studied by several researchers [36, 37, 111, 119]. Moreover, to partially overcome this trade-off, one can use other bases that are stable and accurate; for a general overview about this topic refer to [105]. The second trade-off principle concerns accuracy and stability versus problem size. The problem of stably computing generalized IMQ and Gaussian interpolants, with ε −→ 0, has been investigated in many papers, see e.g. [93, 117, 171, 215]. However, these algorithms are rather expensive. More recently, considering a wider family of RBFs, several authors proposed new techniques which allow to stably interpolate for extreme values of the shape parameter and with a relatively low computational complexity [63, 81, 82]. The last trade-off principle deals with compactly supported functions and specifically accuracy and efficiency are considered. If we scale the support size of the basis functions proportionally to the fill distance, the resulting method is numerically stable, but there is essentially no convergence. This kind of approach is known as stationary approximation, while its counterpart is the so-called non-stationary approximation. In the latter case, i.e. with fixed support size, the error decreases, but the interpolation matrices become dense and thus ill-conditioned [232].
Chapter 1. Preliminaries: RBF-PU interpolation
33
Remark 1.2. In general, for many choices of the basis functions the RBF systems are guaranteed to be non-singular whenever nodes are distinct. Problems arise anyway if points are close to be singular. Precisely, if data sites are close to be singular then the condition number grows and, in such case, the use of more peaked RBFs is strongly advised. In fact, in agreement with the trade-off principles [102, 233, 234], for low density of data points, highorder basis functions, such as Gaussians and IMQ, are extremely advised. While for high density of interpolation points, we can use low-order basis functions, such as compactly supported Wendland’s functions. Since large interpolation matrices might suffer from ill-conditioning and moreover the computational cost associated to the solution of large linear systems is truly high, we now focus on the PU method.
1.3
Local radial basis function-based interpolation techniques
Local techniques, such as the PU scheme, have been used for interpolation since around 1960 [122, 186, 242]. Later, they have been coupled with RBFs [102, 268]. Moreover, the PU method for solving Partial Differential Equations (PDEs), first introduced in the mid 1990s in [13, 192], is nowadays a popular technique [224, 241].
1.3.1
The partition of unity method
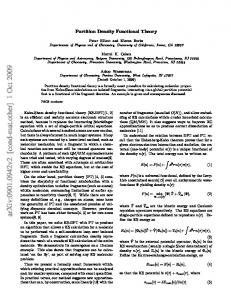
The basic idea of the PU method is to start with a partition of the open and bounded domain Ω into d subdomains or patches Ωj , such that Ω ⊆ ∪dj=1 Ωj , with some mild overlap among them. In other words, the subdomains must form a covering of the domain and moreover, the overlap must be sufficient so that each interior point x ∈ Ω is located in the interior of at least one patch Ωj . The overlap condition is illustrated in Figure 1.1. Specifically, a 2D view of a PU structure, covering a set of scattered data in the unit square and satisfying the above mentioned properties, is shown in the left frame. In this particular example we consider circular patches, but other shapes can be considered. In the right frame we plot a PU structure which does not satisfy the overlap condition. Furthermore, according to [268], some additional assumptions on the regularity of the covering {Ωj }dj=1 are required. Definition 1.21. Suppose that Ω ⊆ RM is bounded and XN = {xi , i = 1, . . . , N } ⊆ Ω is given. An open and bounded covering {Ωj }dj=1 is called regular for (Ω, XN ) if the following properties are satisfied: i. for each x ∈ Ω, the number of subdomains Ωj , with x ∈ Ωj , is bounded by a global constant C,
Chapter 1. Preliminaries: RBF-PU interpolation
0.8
0.8
0.6
0.6
x2
1
x2
1
34
0.4
0.4
0.2
0.2
0
0
0.2
0.4
0.6
0.8
0
1
0
0.2
0.4
x1
0.6
0.8
1
x1
Figure 1.1: An illustrative example of PU subdomains covering the domain Ω = [0, 1]2 and satisfying the overlap condition (left). In the right frame the covering does not satisfy the overlap condition; a critical point where no overlap occurs is marked with a green triangle. The blue dots represent a set of scattered data and the orange circles identify the PU subdomains. ii. each subdomain Ωj satisfies an interior cone condition, iii. the local fill distances hXNj are uniformly bounded by the global fill distance hXN , where XNj = XN ∩ Ωj . Associated to these subdomains, a partition of unity, i.e. a family of compactly supported, non-negative, continuous functions Wj , with supp (Wj ) ⊆ Ωj and such that d X
Wj (x) = 1,
x ∈ Ω,
j=1
is considered. In addition, according to [268], we suppose that {Wj }dj=1 is a k-stable partition of unity, i.e. for every β ∈ NM , with |β| ≤ k, there exists a constant Cβ > 0 such that
β
D Wj
L∞ (Ωj )
≤�
Cβ supx,y∈Ωj kx − yk2
�|β| ,
j = 1, . . . , d.
Among several weight functions, a possible choice is given by the Shepard’s weights [242], i.e. Wj (x) =
¯ j (x) W d X k=1
¯ k (x) W
,
j = 1, . . . , d,
Chapter 1. Preliminaries: RBF-PU interpolation
35
¯ j are compactly supported functions, with support on Ωj . Morewhere W over, such family {Wj }dj=1 forms a partition of unity. Once we choose the partition of unity {Wj }dj=1 , the global interpolant is formed by the weighted sum of d local approximants Rj , i.e. I (x) =
d X
Rj (x) Wj (x) ,
x ∈ Ω.
(1.29)
j=1
Remark 1.3. Note that the assumptions in Definition 1.21 lead to the requirement that the number of subdomains is proportional to the number of data. Furthermore, the first property ensures that the sum in (1.29) is actually a sum over at most C summands. The fact that C is independent of N , unlike d, is essential to avoid loss of convergence orders. Moreover, for an efficient evaluation of the global interpolant it is crucial that only a constant number of local approximants has to be evaluated. It means that it should be possible to locate those C indices in constant time. In particular here Rj denotes a RBF interpolant defined on a subdomain Ωj of the form (1.8) or (1.11), depending on whether φ is strictly positive definite or strictly conditionally positive definite. For instance, supposing to have a strictly positive definite function, the j-th local interpolant assumes the form Rj (x) =
Nj X j
ck φ(||x − xjk ||2 ),
(1.30)
k=1
where Nj indicates the number of points on Ωj and xjk ∈ XNj , with k = N
j 1, . . . , Nj . The coefficients {cjk }k=1 in (1.30) are determined by enforcing the Nj local interpolation conditions
Rj (xji ) = fij ,
i = 1, . . . , Nj .
Thus, in case of strictly positive definite functions, the problem of finding the PU interpolant (1.29) reduces to solving d linear systems of the form Aj c j = f j ,
(1.31)
j T where cj = (cj1 , . . . , cjNj )T , f j = (f1j , . . . , fN ) and Aj ∈ RNj ×Nj is j
φ(||xj1 − xj1 ||2 ) · · · .. .. Aj = . . j j φ(||xNj − x1 ||2 ) · · ·
φ(||xj1 − xjNj ||2 ) .. . . j j φ(||xNj − xNj ||2 )
Moreover, since the functions Wj , j = 1, . . . , d, form a partition of unity, if the local fits Rj , j = 1, . . . , d, satisfy the interpolation conditions then the global PU approximant inherits the interpolation property [102, 268].
Chapter 1. Preliminaries: RBF-PU interpolation
1.3.2
36
Error bounds for radial basis function partition of unity interpolants
In order to formulate error bounds, we need to define the space Cνk (RM ) of all functions f ∈ C k whose derivatives of order |β| = k satisfy Dβ f (x) = O (||x||ν2 ) for ||x||2 −→ 0. We are now able to give the following convergence result [268]. Theorem 1.38. Let Ω ⊆ RM be open and bounded and suppose that XN = {xi , i = 1, . . . , N } ⊆ Ω. Let φ ∈ Cνk (RM ) be a strictly conditionally positive definite function of order L. Let {Ωj }dj=1 be a regular covering for (Ω, XN ) and let {Wj }dj=1 be k-stable for {Ωj }dj=1 . Then the error between f ∈ Nφ (Ω), where Nφ is the native space of φ, and its PU interpolant (1.29), with Rj ∈ span{Φ(·, x), x ∈ XN ∩ Ωj } + ΠM L−1 , can be bounded by 0
(k+ν)/2−|β|
|Dβ f (x) − Dβ I (x) | ≤ C hXN
|f |Nφ (Ω) ,
for all x ∈ Ω and all |β| ≤ k/2. If φ ∈ Cνk (RM ) is strictly positive definite then ΠM L−1 = ∅. Remark 1.4. If we compare the result reported in Theorem 1.38 with the global error estimates shown in the previous sections [266], we can see that the PU interpolant preserves the local approximation order for the global fit. Hence, we can efficiently compute large RBF interpolants by solving small interpolation problems and then combine them together with the global partition of unity {Wj }dj=1 . Since such method is extremely suitable in case of large scattered data sets, an important application to CAGD will be considered in the next section.
1.4
Modeling 3D objects via partition of unity interpolation
A common problem in computer aided design and computer graphics is the reconstruction of surfaces defined in terms of point cloud data, i.e. a set of unorganized points in 3D. Such applications arise in computer graphics, modeling complicated 3D objects or in medical imaging (see e.g. [65, 70, 196, 267, 285]).
1.4.1
The implicit approach
An approach to obtain a surface that fits the given 3D point cloud data is based on the use of implicit surfaces defined in terms of some meshfree
Chapter 1. Preliminaries: RBF-PU interpolation
37
approximation methods, such as RBF interpolant [102, 267]. Further details can also be found in [38, 39, 207, 255, 284]. Given a point cloud data set XN = {xi ∈ R3 , i = 1, . . . , N }, belonging to an unknown two dimensional manifold M , namely a surface in R3 , we seek another surface M ∗ that approximates M . For the implicit approach, we think of M as the surface of all points x ∈ R3 satisfying the implicit equation f (x) = 0, (1.32) for some function f . So it implicitly defines the surface M ∗ . This means that the equation (1.32) is the zero iso-surface of the trivariate function f , and therefore this iso-surface coincides with M . The surface M can be constructed via PU interpolation. Unfortunately, the solution of this problem, by imposing the interpolation conditions (1.32), leads to the trivial solution, given by the identically zero function [70]. The key to finding the interpolant of the trivariate function f , from the given data points is to use additional significant interpolation conditions, i.e. to add an extra set of off-surface points. Once we define the augmented data set, we can then compute a three dimensional interpolant I, via the PU method, to the total set of points [102, 268]. Thus, the reconstruction of the surface leads to a method consisting of three steps: i. generate the extra off-surface points, ii. find the interpolant of the augmented data set, iii. render the iso-surface of the fit. Let us suppose that, for each point xi , the oriented normal ni ∈ R3 is given. We construct the extra off-surface points by taking a small step away along the surface normals, i.e. we obtain for each data point xi two additional off-surface points. One point lies outside the manifold M and is given by xN +i = xi + ∆ni , whereas the other point lies inside M and is given by x2N +i = xi − ∆ni , − + ∆ being the stepsize. The union of the sets X∆ = {xN +1 , . . . , x2N }, X∆ = {x2N +1 , . . . , x3N } and XN , namely X3N , gives the overall set of points on which the interpolation conditions are assigned. Note that if we have zero normals in the given normal data set, we must exclude such points. Finally, we construct the augmented set of function values F3N . It is defined as the
Chapter 1. Preliminaries: RBF-PU interpolation
38
union of the following sets: FN (xi ) = 0,
i = 1, . . . , N,
+ F∆ (xi ) − F∆ (xi )
= 1,
i = N + 1, . . . , 2N,
= −1,
i = 2N + 1, . . . , 3N.
Now, after creating the data set, we compute the interpolant I whose zero contour (iso-surface I = 0) interpolates the given point cloud data. The values +1 or −1 are arbitrary. Their precise value is not as critical as the choice of ∆. In fact the stepsize can be rather critical for a good surface fit [102]. Finally, we just render the resulting approximating surface M ∗ as the zero contour of the 3D interpolant [102]. If the normals are not explicitly given, we now illustrate some techniques to estimate them.
1.4.2
Normals estimation
To implement the implicit PU method, for each point xi , we need to find the oriented normal ni . To this aim, we follow the technique presented in [153, 154]. Of course, we have to assume that the surface is indeed orientable [267]. Given data of the form XN = {xi ∈ R3 , i = 1, . . . , N }, we fix a number K < N , and we find, for every point xi , the K nearest neighbors. The set of the neighbors of xi is denoted by K (xi ). The first step is to compute an oriented tangent plane for each data point [154]. The elements that describe the tangent plane Tp (xi ) are a point oi , called the centre, and a unit normal vector ni . The latter is computed so that the plane is the least squares best fitting plane to K (xi ). So, the centre oi is taken to be the centroid of K (xi ) and the normal ni is determined using Principal Component Analysis (PCA), see e.g. [21, 155, 161]. More precisely, we compute the centre of gravity of {xk , k ∈ K (xi )}, i.e. 1 X oi = xk , K k∈K (x ) i
and the associated covariance matrix Cov(xi ) =
X
(xk − oi )(xk − oi )T ,
k∈K (xi )
which is a symmetric 3 × 3 positive semi-definite matrix. The eigenvalues λi1 ≥ λi2 ≥ λi3 and the corresponding unit eigenvectors v i1 , v i2 , v i3 of this positive semi-definite matrix represent the plane and the normal to this plane. Specifically, let us suppose that two eigenvalues λi1 and λi2 are close together and the third one is significantly smaller, so the eigenvectors for the first two eigenvalues v i1 and v i2 determine the plane, while the eigenvector v i3 determines the normal to this plane.
Chapter 1. Preliminaries: RBF-PU interpolation
39
The second step is to orient the normal consistently, in fact ni is chosen to be either v i3 or −v i3 . Note that if two data points xi and xk are close, their associated normals ni and nk are nearly parallel, i.e. ni nTk ≈ ±1. Consequently, if ni nTk ≈ −1 either ni or nk should be flipped. The difficulty in finding a consistent global orientation is that this condition should hold between all pairs of sufficiently close data points. A common practice is to model this problem as graph optimization [154, 267]. At first, we build the Riemann graph G = {V, E}, with each node in V corresponding to one of the 3D data points. We remark that the Riemann graph is defined as the undirect graph among which there exists an edge eik in E if vk is one of the K nearest neighbors of vi and vice versa. In our case, the graph G has a vertex for every normal ni and an edge eik between the vertices of ni and nk if and only if i ∈ K (xk ) or k ∈ K (xi ). For example, to build a weighted graph, we could choose the weights w(eik ) = ni nTk . So the cost of the edge connecting the vertices ni and nk represents the deviation of the normals [267]. Hence, the normals are consistently oriented P if we find directions bi = {−1, 1}, so that eik bi bk w(eik ) is maximized. Unfortunately, this problem is NP-hard, i.e. no method can guarantee of finding its exact solution in a reasonable time, as shown in [153]. We propose the approximate solution described in [153]. The idea is simply to start with an arbitrary normal orientation and then to propagate it to neighboring normals. Intuitively, we would like to choose an order of propagation that favors propagation from Tp (xi ) to Tp (xk ) if the unoriented planes are nearly parallel. To assign orientation to an initial plane, the unit normal of the tangent plane whose centre has the third largest coordinate is made to point toward the positive x3 -axis. We assign to each edge eik the cost w(eik ) = 1 − |ni nTk |, as suggested in [267]. Note that w(eik ) is small if the unoriented tangent planes are nearly parallel. A favourable propagation order can therefore be achieved by traversing the minimal spanning tree of the Riemann graph. The advantage of this order consists in propagating the orientation along directions of low curvature in the data. To such scope, we need some preliminary definitions (see e.g. [20]) for further details. Definition 1.22. In any connected graph G, a spanning tree is a subgraph of G having the following two properties: i. the subgraph is a tree, ii. the subgraph contains every vertex of G. Definition 1.23. The weight of a tree is defined to be the sum of the weights of all edges in the tree. Definition 1.24. Given a connected weighted graph G the minimal spanning tree is the spanning tree having minimum weight among all spanning trees in the graph.
Chapter 1. Preliminaries: RBF-PU interpolation
40
We now want to determine how to construct a minimum weight spanning tree. As suggested by [267], we use the Kruskal’s algorithm (e.g. refer to [141] for further details). Precisely, we begin by choosing an edge of minimum weight in the graph and then we continue by selecting from the remaining edges an edge of minimum weight until a spanning tree is formed. For the Matlab implementation we have taken inspiration by [184].1 We now give an illustration of the implicit PU technique in a 2D setting [102]. Example 1.2. Let us consider the following data set xi = ([2 + sin (ti )] cos (ti ) , [2 + cos (ti )] sin (ti )) ,
i = 1, . . . , N,
where ti is a Halton sequence2 [147] (see also Appendix A for further details). Even if the normals can be analytically computed, in what follows we suppose that they are unknown. Let us fix N = 75, see Figure 1.2. 3 2
x2
1 0 −1 −2 −3 −3
−2
−1
0
1
2
3
x1
Figure 1.2: The point cloud data set. To approximate the normals we use K = 6 nearest neighbors and then we propagate the orientation by traversing the minimal spanning tree of the Riemann graph, as shown in Figure 1.3 (left) and (right), respectively. Next, to obtain the set of off-surface points, we add the function values. Specifically, we assign the value 0 to each original data point and the value 1 or −1 to outside or inside points (obtained by marching a small distance 1 Specifically, the functions involved in the normals estimation are kNearestNeighbors.m provided by Ani, pcloud_normal_estimate.m provided by A. Tagliasacchi, kd_buildtree.m and kd_knn.m both provided by P. Vemulapalli and normnd.m provided by J. Wells. 2 The Halton points are generated using the Matlab function haltonseq.m, provided by D. Dougherty, available at [184].
3
3
2
2
1
1
x2
x2
Chapter 1. Preliminaries: RBF-PU interpolation
0
0
−1
−1
−2
−2
−3 −3
−2
−1
0
1
2
3
x1
41
−3 −3
−2
−1
0
1
2
3
x1
Figure 1.3: Inconsistent normals estimation (left) and consistent set of normals (right). ∆ along the normals), see Figure 1.4 (left). The step size is taken to be 1% of the size of the data set. Now the problem is turned into a full 2D interpolation problem. Thus, in order to reconstruct the surface interpolating the augmented data set, we use the PU method with the Wendland’s C 2 function ϕ3,1 (see (1.24)). Moreover, the same function is used for the PU weights. We point out that in this dissertation the Wendland’s C 2 function will be always used for the computation of the PU weights. The result, choosing the shape parameter ε equal to 0.6, is shown in Figure 1.4 (right). The interpolant curve, shown in Figure 1.5, is the zero contour of the interpolant surface.3
1.5
Concluding remarks
In this chapter we gave the basic knowledge for the incoming topics. Specifically, after establishing the general framework concerning the scattered data interpolation problem, we focused on its solution via RBFs. For the resulting interpolant we provided error bounds and we briefly studied its stability. Even if we concentrated the discussion for strictly positive definite functions, we also mentioned few results for strictly conditionally positive kernels. Furthermore, we gave examples of these two major classes. We concluded the chapter by introducing the main features of the PU method. This strategy will be studied in the next chapters from different points of view. 3 For rendering the resulting approximating manifold we use the Matlab functions contour.m or isosurface.m, for 2D and 3D cases, respectively.
Chapter 1. Preliminaries: RBF-PU interpolation
42
Figure 1.4: The augmented data set (left) and the surface interpolating the augmented data set (right).
3 2
x2
1 0 −1 −2 −3 −3
−2
−1
0
1
2
3
x1
Figure 1.5: The interpolant curve, i.e. the zero contour of the interpolant surface.
Chapter 2
On the efficiency of the partition of unity method In this chapter we deal with an efficient computation of the PU interpolant. As stressed in Chapter 1, one of the main disadvantages of radial kernelbased method is the computational cost associated with the solution of large linear systems. Therefore, recent researches have been directed towards a change of the basis, either rendering them more stable, or considering a local method involving RBFs [81, 106, 210]. Here we focus on the localized RBF-based PU approximation. As the name of the PU method suggests, in such local approach, the efficient organization of scattered data is the crucial step. Precisely, in literature, techniques as kd-trees, which allow to partition data in a k-dimensional space, and related searching procedures have already been designed [8, 77]. Even if such techniques work with high dimensions, they are not specifically implemented for the PU method, see Appendix B for further details. Here, we present a versatile software for bivariate and trivariate interpolation which makes use of the so-called Sorting-based Partitioning Structure (S-PS) and a related searching procedure [55]. It strictly depends on the size of the PU subdomains and allows to deal with a truly large number of data with a relatively low computational complexity. Such procedure follows from the results shown in [1, 49, 51, 52], where efficient searching procedures based on the partition of the underlying domains in strips or crossed strips are considered. More precisely, the S-PS for bivariate and trivariate interpolation consists in covering, at first, the domain with several non-overlapping small squares or cubes, named blocks. Then, the usually large scattered data set is distributed among the different blocks by recursive calls to a sorting routine. Once the scattered data are stored in such blocks, an optimized searching procedure is performed enabling us to solve the local interpolation problems arising from the domain decomposition. 43
Chapter 2. On the efficiency of the PU method
44
Specifically, such structure, built ad hoc for the PU method, allows to run the searching procedure in constant time complexity, independently of the initial number of nodes. This is supported by an extensive complexity analysis. Moreover, comparisons with other common techniques, as kd-trees, are carried out. Interpolating large scattered data sets using procedures competitive with the most advanced techniques is thus the main task of the S-PS. A second meaningful feature of the presented procedures is the flexibility with respect to the problem geometry. In general, in literature the scattered data interpolation problem is considered in very simple and regular domains, such as squares or cubes [101, 102, 204]. This approach is limiting in the context of meshfree methods because of the versatility of the meshless technique with respect to domains having different shapes. Instead in this chapter, we provide an algorithm that allows to solve scattered data interpolation problems in generic domains. In what follows, in order to point out the versatility of the software, we investigate the problem of modeling implicit surfaces via PU interpolation (see e.g. [267] or Section 1.4). It is known that the reconstruction of 3D objects is computationally expensive because of the large amount of data. Thus, the importance of having an efficient partitioning structure in such framework follows. The outline of the chapter is as follows. In Section 2.1 we describe the PU algorithms for bivariate and trivariate interpolation, which are based on the use of the sorting-based partitioning and searching procedures. The performances of such scheme are supported by a complexity analysis presented in Section 2.2 and by extensive numerical experiments outlined in Section 2.3. In Section 2.4 we consider an application to the reconstruction of 3D objects. Section 2.5 deals with conclusions and future work. We point out that the Matlab software is made available to the scientific community in a downloadable free package http://hdl.handle.net/2318/158790.
2.1
Computation of the sorting-based partitioning structure
This section is devoted to the presentation of the PU algorithms for bivariate and trivariate interpolation, which make use of the S-PS and related optimized searching procedure. They allow to efficiently find all the points belonging to a given subdomain Ωj , which, as in [41, 48, 102], consists of a circular or spherical patch (depending on whether M = 2 or 3). Here, since the main target is the interpolation of large scattered data, in the PU scheme, we compute the local interpolants by means of CSRBFs.
Chapter 2. On the efficiency of the PU method
45
However, as it will be pointed out, this approach turns out to be very flexible and different choices of local approximants, either globally or compactly supported, are allowed. Moreover, for easiness of the reader, the steps of the bivariate (M = 2) and trivariate (M = 3) PU method, which makes use of the S-PS and employs CSRBFs, are shown as pseudo-code in the CSRBF-PU Algorithm. In order to construct a flexible procedure, at first, we need to focus on the problem geometry, i.e. we need a sort of data pre-processing, enabling us to consider scattered data sites arbitrarily distributed in a domain Ω ⊆ RM , with M = 2 or 3.
2.1.1
Definition of the partition of unity framework
Here we refer to the Steps 1-5 of the CSRBF-PU Algorithm. Given a set of scattered data XN = {xi , i = 1, . . . , N } ⊆ Ω, we need to define several auxiliary structures, meaningful to construct a robust partitioning data structure. Thus, we define a rectangular bounding R of the domain Ω as M � Y
R=
m=1
�
min xim , max xim .
i=1,...,N
(2.1)
i=1,...,N
As evident from (2.1), R consists of a rectangle or of a rectangular prism, depending on whether M = 2 or 3. Moreover, in the problem geometry we consider a second auxiliary structure, known as bounding box. This is a square or a cube (for M = 2 or 3 respectively) and is given by �
L=
�
min
m=1,...,M
min xim ,
i=1,...,N
��M
�
�
max
m=1,...,M
max xim
i=1,...,N
.
(2.2)
In order to fix the idea in a 2D framework refer to Figure 2.1. The auxiliary structures previously defined are useful to generate both the set of evaluation points Es = {˜ xi , i = 1, . . . , s} ⊆ Ω and the set of PU centres Cd = {¯ xi , j = 1, . . . , d} ⊆ Ω. These sets are respectively obtained by generating sR and dR points as grids on R. Then, they are reduced by taking only those s evaluation points and d subdomain centres lying on Ω.1 As stated in Section 1.3, we require that the subdomains {Ωj }dj=1 form an open, bounded and regular covering for Ω. These assumptions affect the choice of the number of PU centres and the one of the PU radius δ. Specifically, from Remark 1.3, we know that the number of patches should be proportional to N . In particular, assuming to have a nearly uniform node 1
The points can be automatically reduced by using the Matlab function inpolygon.m available at [92]. Eventually, also the Matlab function inpoly.m, provided by A. Semechko [184], can be employed.
Chapter 2. On the efficiency of the PU method
46
1
0.8
x2
0.6
0.4
0.2
0
0
0.2
0.4
0.6
0.8
1
x1
Figure 2.1: An example of the problem geometry in a 2D framework: the set of data sites XN (blue dots), the domain Ω (dashed black line), the rectangle R containing Ω (dotted magenta line) and the bounding box L (orange solid line).
distribution, d is a suitable number of PU subdomains on Ω if [41, 102] N ≈ 2M . d
(2.3)
Thus, denoting by AΩ the area or the volume (for M = 2 or 3 respectively) of Ω, from a simple proportion we find a suitable number of PU subdomains initially generated on R 1 N dR = L 2 AΩ �
�
�1/M �M
,
(2.4)
where L denotes the edge length of the bounding box. So, the initial number of patches dR is later reduced by taking only those d centres lying on Ω and, in this way, (2.3) is satisfied. Also the PU radius δ must be carefully chosen. In fact, the patches must be a covering of the domain Ω and must satisfy the overlap condition (see Section 1.3). For instance, the required property can be fulfilled taking the radius rL δ= , (2.5) (dR )1/M √ with r ∈ R, r ≥ 1. Here we take r = 2. Moreover, we have to define the set of CSRBF centres Yc = {ˆ xi , i = 1, . . . , c}, which here, as in [102], coincides with the set of data sites, i.e. Yc ≡ XN .
Chapter 2. On the efficiency of the PU method
47
Remark 2.1. We point out that, to solve interpolation problems in domains which are, in general, a priori unknown, i.e. problems arising from applications (see e.g. [60, 223]), the most appropriate way to act is to settle Ω as the convex hull2 defined by the data set [57, 58]. Since the aim is to provide an automatic algorithm, in the free Matlab package we propose this implementation.
2.1.2
The sorting-based data structure
Here we refer to the Steps 6-7 of the CSRBF-PU Algorithm. Once the PU subdomains are generated, the whole problem reduces to solving, for each patch, a local interpolation problem. Specifically, in the j-th local interpolation problem, only those data sites and evaluation points belonging to Ωj are involved. Consequently, a partitioning data structure and a related searching procedure must be employed to efficiently find the points located in each subdomain. In literature, to this scope the kd-tree partitioning structures are commonly and widely used [8, 77]. A kd-tree, short for k-dimensional tree, is a space partitioning data structure for organizing points in a k-dimensional space. Here, since we have a M -dimensional space we should refer to such trees as Md-trees. But, in order to keep common notations, we will go on calling them kd-trees. Following such approach, after building the tree structures for both data sites and evaluation points, the problem of finding all the points belonging to a given subdomain can be easily solved (see [41, 102] for details). In this chapter, we present an alternative partitioning structure which is built ad hoc for the interpolation purpose. This technique, besides being flexible as kd-trees, allows to find all the points belonging to a given subdomain Ωj and turns out to be competitive in terms of computational time and cost. Such procedure is a partitioning data scheme based on storing points into different blocks, which are obtained from the subdivision of the bounding box auxiliary structure L into several squares or cubes. The number q of blocks along one side of L is strictly linked to the PU radius δ and is given by � � L q= . (2.6) δ From (2.6) we can deduce that the S-PS depends on the construction of the PU subdomains. In such framework we will be able to get an efficient procedure to find the nearest points. Thus, after defining the width of the blocks as in (2.6), we number blocks from 1 to q M . In a 2D context they are numbered from bottom to top, left 2
The convex hull and its area or volume can be computed with the convhull.m Matlab function. Moreover, the points can be automatically reduced by the inhull.m function, provided by J. D’Errico, available at [184].
Chapter 2. On the efficiency of the PU method
48
to right, see Figure 2.2. For trivariate data sets, starting from the order shown in Figure 2.2, we continue numbering blocks along the quote as well. The S-PS allows to store both data sites and evaluation points in each of the q M blocks. At first, in such routine a sorting procedure is performed to order data sites along the first coordinate. Then, recursive calls to the sorting routine are used to order data along the remaining coordinates enabling us to store points into the different blocks, i.e.: i. the set XN is partitioned by the S-PS into q M subsets XNk , k = 1, . . . , q M , where XNk are the points stored in the k-th block, ii. the set Es is partitioned by the S-PS into q M subsets Esk , k = 1, . . . , q M , where Esk are the points stored in the k-th block. Remark 2.2. In the S-PS, a sorting routine on the indices is needed. To this aim an optimized sorting procedure for integers is performed.3 Remark 2.3. Even if in principle such structures could work for dimensions higher than M = 3, the computation of the data structures would be rather complex and expensive. Indeed, the recursive calls to a sorting routine would render the algorithm truly slow. This is the reason why such data structures are built ad hoc for M = 2 or M = 3 and in this sense they do not work in higher dimensions.
2.1.3
The sorting-based searching procedure
Here we refer to the Step 8 of the CSRBF-PU Algorithm. After organizing in blocks data sites and evaluation points, in order to compute local fits, i.e. interpolants on each subdomain, we need to perform several procedures enabling us to answer the following queries, respectively known as containing query and range search: ¯ j ∈ Ω, return the k-th block containing x ¯j, i. given a PU centre x ii. given a set of data points xi ∈ XN and a subdomain Ωj , find all points located in that patch, i.e. xi ∈ XNj . Thus, we perform a containing query and a range search routines, based on the S-PS. To this aim, it is convenient to point out that in bivariate interpolation, blocks are generated by the intersection of two families of orthogonal strips. The former (numbered from 1 to q) are parallel to the x2 -axis, whereas the latter (again numbered from 1 to q) are parallel to the x1 -axis. For 3D data sets blocks are generated by the intersection of three orthogonal rectangular prisms. In what follows, for simplicity, with abuse of 3
The Matlab function countingsort.m is a routine of the package called Sorting Methods, provided by B. Moore, available at [184].
Chapter 2. On the efficiency of the PU method
49
notation we will continue to denote such rectangular prisms with the term strips. Consistent with the bivariate case, the three families of strips are all numbered from 1 to q. Moreover, the first family of strips is parallel to the (x2 , x3 )-plane, the second one is parallel to the (x1 , x3 )-plane and the last one is parallel to the (x1 , x2 )-plane. The sorting-based containing query, given a PU centre, returns the index of the block containing such centre. Thus, given a PU centre x ¯j , if km is the index of the strip parallel to the subspace of dimension M − 1 generated by xp , p = 1, . . . , M , and p 6= m, containing the m-th coordinate of x ¯j , then the index of the k-th block containing the PU centre is k=
M −1 X
(km − 1) q M −m + kM .
(2.7)
m=1
As example in a 2D framework, the PU centre plotted in Figure 2.2 belongs to the k-th block, with k = 4q + 3; in fact here k1 = 5 and k2 = 3. Remark 2.4. The containing query routine is built to be a versatile tool usable for domains of any shape. Indeed, it can be used for generic domains and not only for squares or cubes. After answering the first query, given a subdomain Ωj , the searching routine allows to: i. find all data sites belonging to the subdomain Ωj , ii. determine all evaluation points belonging to the subdomain Ωj . Specifically, supposing that the j-th PU centre belongs to the k-th block, the sorting-based searching procedure searches for all data lying in the j-th subdomain among those lying on the k-th neighborhood, i.e. in the k-th block and in its 3M − 1 neighboring blocks, see Figure 2.2. In particular, the partitioning structure based on blocks enables us to examine in the searching process at most 3M − 1 blocks. In fact, when a block lies on the boundary of the bounding box, we reduce the number of neighboring blocks to be considered.
2.1.4
The computation of local distance matrices
Here we refer to the Steps 8a-10 of the CSRBF-PU Algorithm. The data sites and evaluation points belonging to the subdomain Ωj are used to compute the local interpolation and evaluation matrices. In order to calculate them, we have at first to compute the so-called distance matrices. So, after computing the local distance matrices, the CSRBF is applied to the entire matrices, obtaining in this way the interpolation and evaluation matrices. In brief, this stage can be summarized as follows:
Chapter 2. On the efficiency of the PU method 1
50 q2
q 2q 0.8
x2
0.6
0.4
0.2 2 0
(q−1)q+1
1 q+1 0
0.2
0.4
0.6
0.8
1
x1
Figure 2.2: An example of a 2D partitioning structure: the k-th block (red solid line), a subdomain centre belonging to the k-th block (magenta circle) and the neighborhood set (green dashed line).
i. solving the local RBF linear system (1.31), ii. evaluating the local RBF interpolant (see the notation introduced in Section 1.2) Rj (x) = φTj (x)cj , where the index j denotes the problem related to the j-th patch, while φj is the corresponding evaluation matrix, see (1.13). Since we focus on CSRBFs, by properly scaling the support of the function, the local interpolation systems become sparse. Thus again, the S-PS is used to efficiently find, for each CSRBF centre, all data sites and evaluation points located within its support. As a consequence, we compute only few entries of the distance matrices. Finally, the local fits are accumulated into the global interpolant (1.29). On the opposite, in case of globally supported RBFs, since the entries of the distance matrices must be computed for each pair of points, building any partitioning structure is wasteful. Hence, in the CSRBF-PU Algorithm, Steps 8a-8b should be skipped.
2.2
Complexity analysis
In this section we point out the efficiency of the S-PS. It will be proved that for bivariate interpolation storing data sites and evaluation points requires O(3/2N log N ) and O(3/2s log s) time complexity, respectively. While, for 3D data sets the running times are O(2N log N ) and O(2s log s) for storing
Chapter 2. On the efficiency of the PU method
51
INPUTS: N , number of data; XN = {xi , i = 1, . . . , N } ⊆ Ω, set of data points; FN = {fi , i = 1, . . . , N }, set of data values; dR , number of PU subdomains in R; sR , number of evaluation points in R; φ, the basis function; ε, the shape parameter. OUTPUTS: As = {I(˜ xi ), i = 1, . . . , s}, set of approximated values. Step 1: Compute R and L (see (2.1) and (2.2)). Step 2: A set Cd = {¯ xj , j = 1, . . . , d} ⊆ Ω of PU centres is constructed. Step 3: A set Es = {˜ xi , i = 1, . . . , s} ⊆ Ω of evaluation points is generated. Step 4: Define the set of CSRBF centres Yc = {ˆ xi , i = 1, . . . , c} ⊆ Ω. Here Yc ≡ X N . ¯ j , j = 1, . . . , d, a patch whose radius is given by (2.5) Step 5: For each PU centre x is constructed. Step 6: Compute the number q of blocks as in (2.6). Step 7: The S-PSs are built for the set XN of data points and the set Es of evaluation points. Step 8: For each patch Ωj , j = 1, . . . , d, the sorting-based containing query and the range search routines are performed allowing to find: i. all data points XNj belonging to the subdomain Ωj , ii. all evaluation points Esj belonging to the patch Ωj . Step 8a: The S-PSs are built for the set of data points XNj and the set of evaluation points Esj . Step 8b: For each centre (of the basis function) xji ∈ XNj , i = 1, . . . , Nj , the sorting-based containing query and the range search routines are performed allowing to find: i. all data points XNji , ii. all evaluation points Esji belonging to the support of the CSRBF centered at xji . Step 9: The interpolation and evaluation matrices are computed and a local interpolant Rj is formed as in (1.30). Step 10: The local fits are accumulated into the global interpolant (1.29).
The CSRBF-PU Algorithm. Routine performing the PU method, using CSRBFs and employing the S-PS and the related searching procedure. data sites and evaluation points, respectively. Moreover, when points are organized in blocks, for both 2D and 3D data sets the searching procedure can be computed in O(1) time complexity. This allows to perform a searching routine in a constant time, independently of the initial number of points. A comparison with kd-trees is carried out (see Table 2.2).
Chapter 2. On the efficiency of the PU method
2.2.1
52
The sorting-based data structure
The first part of the algorithm for PU interpolation is a sort of data preprocessing which is not involved in complexity cost. Let us now focus on the partitioning structures used to organize the N data sites in blocks. We remark that in the assessment of the total computational cost, analyzed in what follows in case of nodes, it must be added up the same cost for storing the s evaluation points. The S-PS employs the quicksort routine which requires O(n log n) time complexity and O(log n) space, where n is the number of elements to be sorted. Specifically, the S-PS is based on recursive calls to a quicksort routine4 for ordering the nodes among the M dimensions. To analyze the complexity of both the bivariate and trivariate S-PSs, we introduce the following notations, i.e. (1)
Nk
: number of data sites belonging to q strips,
(2) Nk
: number of data sites belonging to q 2 strips.
Thus, the computational cost depending on the space dimension M is
O N log N +
qm M −1 X X
(m) (m) Nk log Nk .
(2.8)
m=1 k=1
Denoting by N/q m the average number of points lying on q m strips, (2.8) can be estimated by M −1 X
N O N log N + N log m q m=1
!
≈ O N log N +
M −1 X
�
N log N
m=1
� �m �!
δ L
.
Now, from the definition of the PU subdomains and neglecting the constant terms, we obtain that (2.8) is approximately �
O N log N +
M −1 X m=1
M −m N log N . M �
(2.9)
Moreover, in the partitioning scheme a sorting procedure on indices is employed to order them. Such routine is performed with an optimized procedure for integers requiring O(n) time complexity, where n is the number of elements to be sorted. Therefore, in the “big O” notation such cost turns out to be negligible in (2.9). 4
Precisely, we use the Matlab function sortrows.m.
Chapter 2. On the efficiency of the PU method
2.2.2
53
The sorting-based searching procedure
To analyze the complexity of the 2D and 3D searching procedures, let Nk be the number of data sites belonging to the k-th neighborhood. Then, since for each PU subdomain a quicksort procedure is used to order distances, the routine requires O(Nk log Nk ) time complexity. Observing that the data sites in a neighborhood are about N/(3q)M , the complexity can be estimated by ! ! N N 2M/2 N N 2M/2 O log M log =O . (2.10) (3q)M (3q)M 3M dR 3 dR Finally, substituting the definition of dR in (2.10), it is proved that �
O AΩ
2r 3L
�M
�
log AΩ
2r 3L
�M !
≈ O(1).
(2.11)
The estimate (2.11) follows from the fact that we built a partitioning structure strictly related to the size of the PU subdomains. For this reason, on each PU subdomain, the number of points is about constant, independently of the initial value N . Remark 2.5. The same computational cost (2.9) and (2.11), in case of CSRBFs, must be considered locally for each patch, to build the sparse interpolation and evaluation matrices. In such steps we usually have a relatively small number of nodes Nj , with Nj � N , and evaluation points sj , with sj � s, where the index j identifies the j-th subdomain. The complexity analysis of the S-PS is supported by numerical experiments shown in Figure 2.3. Tests have been carried out on a Intel(R) Core(TM) i3 CPU M330 2.13 GHz processor. In Table 2.2, we sum up the the total computational cost of the sortingbased partitioning and searching procedures, compared with kd-trees. M
sorting-based structure
kd-tree structure
sorting-based search
kd-tree search
2
O(3/2N log N )+ O(3/2s log s)
O(2N log N )+ O(2s log s)
O(1)
O(log N )+ O(log s)
3
O(2N log N )+ O(2s log s)
O(3N log N )+ O(3s log s)
O(1)
O(log N )+ O(log s)
Table 2.2: Computational costs concerning sorting-based and the kd-tree routines.
Chapter 2. On the efficiency of the PU method
54
−3
5
x 10
0.9 0.8
rs
0.6
t
tds
0.7
0.5
0
0.4 0.3 0.2 0.1 1
2
3
4
5
6
N
7
−5
1
2
3
4
4
5
6
N
x 10
7 4
x 10
4
2
3.5
t(N−1) /t(N) (empirical) ds ds
1.5
t(N−1) /t(N) (empirical) rs rs
3
predicted value
2.5
predicted value
2
1
1.5 0.5
1 0.5
0
1
2
3
4
N
5
6
7 4
x 10
0
1
2
3
4
N
5
6
7 4
x 10
Figure 2.3: The running times for different values of N for the sorting-based data structure (tds ) and for the range search procedure (trs ) (top left and right, respectively). The ratio between empirical times sampled at different consecutive values of N compared with the ratio of theoretical complexity costs, for the sorting-based data structure and for the range search procedure (bottom left and right, respectively).
2.2.3
The computation of local distance matrices
Since from Definition 1.21, the number of centres in each PU subdomain is bounded by a constant, we need O(1) space and time for each patch to solve the local RBF interpolation problems. In fact, to get the local interpolants, we have to solve d linear systems of size Nj × Nj , with Nj � N , thus requiring a running time O(Nj3 ), j = 1, . . . , d, for each patch. Besides reporting the points in each patch in O(1), as the number d of PU subdomains is bounded by O(N ), this leads to O(N ) space and time for solving all of them. Finally, we have to add up a constant number of local RBF interpolants to get the value of the global fit (1.29). This can be computed
Chapter 2. On the efficiency of the PU method
55
in O(1) time.
2.3
Numerical experiments
In this section we report the errors obtained by running the algorithm on large scattered data sets located in convex hulls Ω ⊆ [0, 1]M , for M = 2, 3. As interpolation points, we take Halton data (see Appendix A) on the unit square or cube and then suitably reduced to Ω. This choice allows to make the tests repeatable. Moreover, since we want to point out the efficiency of the S-PS, we also report the CPU times. They are compared with the only full Matlab implemented package for kd-trees, called Kdtree implementation in Matlab, written by P. Vemulapalli, available at [184]. Unfortunately, such package is not the most efficient kd-tree implementation, but since at present none other Matlab package is available all the numerical experiments are compared with that existing package. Furthermore, the construction of trees is also quite common in the Statistics and Machine Learning Matlab toolbox. Anyway, as for as we know, there are no kd-tree range search routines implemented in that toolbox. Moreover, for completeness, we have to mention another package for kd-trees, written by G. Shechter, available at [184]. It consists of dynamic libraries which are not executable in the recent versions of Matlab [101, 162]. It is trivial to note that we cannot compare full implemented Matlab routines with Mex files. Indeed, the compiling times of dynamic libraries are significantly reduced for their nature. In the numerical tests, to point out the accuracy, we refer to the Maximum Absolute Error (MAE) and the Root Mean Square Error (RMSE), whose formulas are MAE = max |f (˜ xi ) − I(˜ xi )| ,
(2.12)
v u s u1 X RMSE = t |f (˜ xi ) − I(˜ xi )|2 .
(2.13)
i=1,...,s
s
i=1
Furthermore, we also investigate two conditioning estimates, named the maximum condition number and the average condition number MaxCond = max cond(Aj ),
(2.14)
d 1X AvCond = cond(Aj ), d j=1
(2.15)
j=1,...,d
where Aj denotes the j-th matrix associated with the subdomain Ωj . More precisely, since the PU method leads to solving d linear systems, to obtain
Chapter 2. On the efficiency of the PU method
56
a good conditioning estimate, we make an average among the condition numbers of the d matrices. Since in the tests we deal with a large amount of data, we focus on CSRBFs, because they might lead to sparse linear systems. In particular, we consider the compactly supported Wendland’s C 2 function ϕ3,1 , see (1.24), with shape parameter ε = 0.5. The same function is also used for the PU weights. The choice of the shape parameter made in this chapter is arbitrary. Nevertheless, further investigations about how to select a shape parameter that yields accuracy and stability will be carried out in Chapters 3 and 5.
2.3.1
Results for bivariate interpolation
In this subsection we focus on bivariate interpolation, showing the numerical results obtained by considering five sets of Halton data points. These tests are carried out considering different domains, i.e. a triangle and a pentagon, see Figure 2.4. In the various experiments we investigate the accuracy of the interpolation algorithm taking the data values by the well-known 2D Franke’s function, see [121] f1 (x1 , x2 ) = + −
3 −[(9x1 −2)2 +(9x2 −2)2 ]/4 3 −(9x1 +1)2 /49−(9x2 +1)/10 e + e 4 4 1 −[(9x1 −7)2 +(9x2 −3)2 ]/4 e (2.16) 2 1 −(9x1 −4)2 −(9x2 −7)2 e , 5
and by the test function f2 (x1 , x2 ) =
1.25 + cos (5.4x2 ) . 6 + 6(3x1 − 1)2
In Tables 2.3 and 2.4, we show the accuracy indicators of the algorithm considering several sets of points for pentagon and triangle, using f1 and f2 as test functions, respectively. These results are obtained taking the shape parameter ε of ϕ3,1 equal to 0.5 and a uniform grid of 40 × 40 evaluation points on R. Furthermore we also calculate the fill distance (1.17) and we estimate the empirical convergence rate via the formula λk =
log(RMSEk−1 /RMSEk ) , log(hXNk−1 /hXNk )
k = 2, 3, . . .
where RMSEk is the error for the k-th numerical experiment, and hXNk is the fill distance of the k-th computational mesh. From the results shown in Tables 2.3 and 2.4, we can see that, consistently with Remark 1.2, the ill-conditioning grows in correspondence of a
Chapter 2. On the efficiency of the PU method 1
0.8
0.8
0.6
0.6
x2
x2
1
57
0.4
0.4
0.2
0.2
0
0 0
0.2
0.4
0.6
0.8
1
0
0.2
0.4
0.6
0.8
1
x1
x1
Figure 2.4: Examples of points in 2D: 622 nodes in a pentagonal region Ω (left) and 501 nodes in a triangular region Ω (right). decrease of the separation distance and of the errors. Furthermore, comparing the convergence rates reported in Tables 2.3 and 2.4, with the ones obtained for a global interpolant shown in [102], we observe that the local convergence rates are carried over to the PU interpolant. Hence, by means of the PU method, together with the partitioning structure here presented, we can efficiently and accurately decompose a large interpolation problem into many small ones (see Remark 1.4). N
MAE
RMSE
MaxCond
AvCond
λ
622
1.65E − 03
1.40E − 04
1.30E + 07
7.12E + 06
2499
5.02E − 04
3.30E − 05
1.72E + 08
4.82E + 07
2.29
9999
4.33E − 05
6.33E − 06
1.92E + 09
5.46E + 08
2.50
39991
9.86E − 06
1.25E − 06
1.96E + 10
3.99E + 09
1.86
159994
1.67E − 06
3.05E − 07
1.74E + 11
3.56E + 10
2.19
Table 2.3: MAEs, RMSEs, MaxConds, AvConds and convergence rates for f1 computed on the pentagon with the Wendland’s C 2 kernel as local approximant. Moreover, Tables 2.5 and 2.6 show the CPU times obtained by running the sorting-based algorithm and the kd-tree one for several sets of Halton data on the pentagon and triangle, respectively. As we can note, the S-PS reduces the CPU times needed to run the only full Matlab implemented package for kd-trees. Finally, in Figure 2.5 we represent the two different test functions (left)
Chapter 2. On the efficiency of the PU method
58
N
MAE
RMSE
MaxCond
AvCond
λ
501
2.04E − 04
2.60E − 05
1.24E + 07
6.98E + 06
2008
3.55E − 05
5.41E − 06
1.77E + 08
4.76E + 07
2.24
7995
2.32E − 05
1.56E − 06
1.77E + 09
5.47E + 08
1.91
31999
7.52E − 06
4.59E − 07
1.88E + 10
3.96E + 09
1.63
128010
5.75E − 07
8.67E − 08
1.67E + 11
3.55E + 10
2.32
Table 2.4: MAEs, RMSEs, MaxConds, AvConds and convergence rates for f2 computed on the triangle with the Wendland’s C 2 kernel as local approximant. N
622
2499
9999
39991
159994
tS−P S
1.0
3.7
9.1
34.1
142.3
tkd−tree
15.3
42.3
134.0
494.1
2013.88
Table 2.5: CPU times (in seconds) obtained by running the sorting-based algorithm (tS−P S ) and the kd-tree-based structure (tkd−tree ) for pentagon. N
501
2008
7995
31999
128010
tS−P S
0.8
2.2
7.2
28.4
114.3
tkd−tree
11.8
29.6
103.7
396.7
1548.4
Table 2.6: CPU times (in seconds) obtained by running the sorting-based algorithm (tS−P S ) and the kd-tree-based structure (tkd−tree ) for the triangle. and the absolute errors (right). This study shows that the maximum errors are mainly equally distributed on Ω.
2.3.2
Results for trivariate interpolation
In this subsection we instead report numerical results concerning trivariate interpolation. We analyze accuracy and efficiency of the CSRBF-PU algorithm, taking also in this case some sets of Halton scattered data points. Such points are located in a cylinder and in a pyramid. The trivariate test functions we consider in this subsection are the 3D
Chapter 2. On the efficiency of the PU method
59
Figure 2.5: The function f1 (top left) and absolute errors (top right) defined on the pentagon (with 159994 nodes); the function f2 (bottom left) and absolute errors (bottom right) defined on the triangle (with 128010 nodes). Franke’s function f3 (x1 , x2 , x3 ) = + + −
3 −[(9x1 −2)2 +(9x2 −2)2 +(9x3 −2)2 ]/4 e 4 3 −(9x1 +1)2 /49−(9x2 +1)/10−(9x3 +1)/10 e 4 1 −[(9x1 −7)2 +(9x2 −3)2 +(9x3 −5)2 ]/4 e 2 1 −(9x1 −4)2 −(9x2 −7)2 −(9x3 −5)2 e , 5
Chapter 2. On the efficiency of the PU method
60
and the function f4 f4 (x1 , x2 , x3 ) = 43 x1 (1 − x1 )x2 (1 − x2 )x3 (1 − x3 ). Tables 2.7 and 2.8 show the accuracy indicators of the algorithm considering several sets of Halton points for cylinder and pyramid, using f3 and f4 as test functions, respectively. As earlier, these results are obtained taking the shape parameter ε of ϕ3,1 equal to 0.5 and a uniform grid of 40 × 40 × 40 evaluation points on R. Also in the trivariate case, we register the pattern already discovered about ill-conditioning and accuracy. We can note that the ill-conditioning grows as the number of points increases, while the error decreases with N . From this fact we can deduce that we have convergence. However, in this case we left out the computation of the convergence rates because the matrices become increasingly dense and computation requires lots of system memory. N
MAE
RMSE
MaxCond
AvCond
3134
5.94E − 03
2.71E − 04
7.65E + 06
3.74E + 06
12551
1.67E − 03
6.00E − 05
4.38E + 07
2.07E + 07
50184
4.67E − 04
2.27E − 05
1.73E + 08
6.03E + 07
200734
1.22E − 04
7.49E − 06
9.86E + 08
3.35E + 08
802865
3.81E − 05
2.91E − 06
3.10E + 09
1.07E + 09
Table 2.7: MAEs, RMSEs, MaxConds and AvConds for f3 computed on the cylinder with the Wendland’s C 2 kernel as local approximant.
N
MAE
RMSE
MaxCond
AvCond
2998
1.23E − 02
6.40E − 04
7.54E + 06
3.62E + 06
12004
3.38E − 03
1.47E − 04
4.49E + 07
2.06E + 07
47997
7.33E − 04
3.57E − 05
1.73E + 08
6.03E + 07
191981
1.10E − 04
9.93E − 06
9.85E + 08
3.34E + 08
767970
4.63E − 05
3.48E − 06
3.10E + 09
1.07E + 09
Table 2.8: MAEs, RMSEs, MaxConds and AvConds for f4 computed on the pyramid with the Wendland’s C 2 kernel as local approximant. In Table 2.9 we report the CPU times obtained by running the sortingbased algorithm and the kd-tree-based structure for several sets of Halton data in the cylinder. In order to show reasonable times, the results in Table
Chapter 2. On the efficiency of the PU method
61
2.9 are obtained by considering a reduced grid of 20 × 20 × 20 evaluation points on R. Here, we omit the table concerning CPU times by varying N for the pyramid because the behavior is similar to that outlined in Table 2.9. In particular, we observe that the difference in terms of CPU times between the S-PS and kd-tree-based structure is particularly remarkable for trivariate data sets. N
3134
12551
50184
200734
tS−P S
14.8
53.1
184.5
1758.1
tkd−tree
266.9
892.7
3141.4
14693.4
Table 2.9: CPU times (in seconds) obtained by running the sorting-based algorithm (tS−P S ) and the kd-tree-based structure (tkd−tree ) for the cylinder.
2.4
Application to reconstruction of 3D objects
In this section we analyze an application of the flexible and fast trivariate SPS. For 3D data sets it will be pointed out that the flexibility with respect to the domain of the partitioning procedure leads to an important application, i.e. modeling implicit surfaces. In the approximation of 3D objects a large number of points is generally involved. The method used to reconstruct the implicit surfaces is described in Section 1.4. We remark that it consists in building an augmented data set so that the problem turns in a full 3D interpolation problem. In other words, the CSRBF-PU Algorithm is applied with the augmented data sets X3N and F3N . Thus, the large data set is significantly augmented by the extra set of off-surface points. Moreover, for the approximation of 3D objects, we need to compute the normals, see Section 1.4. This consists in calculating the minimal spanning tree of a weighted graph using the Kruscal’s algorithm which requires O(KN log N ) time, where KN is the number of edges of the graph having N vertices. From such considerations, it is evident the importance of having a versatile tool which leads to a fast computation of 3D objects, especially in case adaptive methods are developed in the approximation of implicit surfaces, as in [207]. Here we show with some numerical experiments the flexibility and high efficiency of the trivariate S-PS in the reconstruction of 3D objects. The data sets used in the following examples correspond to various point cloud data set of the Stanford Bunny.5 5
The data sets of the Stanford bunny are available at http://graphics.stanford.edu/data/3Dscanrep/.
Chapter 2. On the efficiency of the PU method
62
The RBF used to approximate the 3D object is the Wu’s C 4 function ψ3,2 , see (1.25). In the reconstruction of 3D objects, since a large number of nodes is involved in the interpolation process, an efficient partitioning structure is therefore essential. In Table 2.10 we report the CPU times obtained by running the sorting-based algorithm and the kd-tree-based structure for four different sets of point cloud data. Once more, we observe the efficiency of the S-PS. As earlier, the results shown in Table 2.10 are obtained by taking 20 × 20 × 20 evaluation points on R. The results of the approximation algorithm, for two data sets, are shown in Figure 2.6. They are obtained by taking the shape parameter ε of the Wu’s function equal to 0.1 and a uniform grid of evaluation points in the bounding box of size 100 × 100 × 100 on R. N
453
1889
8171
35947
tS−P S
9.7
39.8
318.4
3881.9
tkd−tree
144.8
589.5
3141.4
64909.8
Table 2.10: CPU times (in seconds) obtained by running the sorting-based algorithm (tS−P S ) and the kd-tree-based structure (tkd−tree ) for different point cloud data sets.
Figure 2.6: The Stanford Bunny with 8171 (left) and 35947 (right) data points.
Chapter 2. On the efficiency of the PU method
2.5
63
Concluding remarks
We presented an efficient construction of the PU interpolant. In fact, the search of the nearest points in the localized process, taking advantage of the S-PS, can be performed in a constant time. This is supported by a complexity analysis and it is mainly due to the fact that the partitioning routine is strictly related to the PU subdomains. Finally, we have to point out that the main drawback of the S-PS is that it only works in low dimensions. Therefore, in the next chapter we present another partitioning scheme which efficiently works in any dimension and moreover it allows to consider subdomains having variable radii. This turns out to be meaningful especially when strongly non-uniform data are considered.
Chapter 3
On the accuracy of the partition of unity method Dealing with applications, one often faces the problem of approximating large and irregular data sets, i.e. data which are far from being uniform. In these cases, since problems as lack of information or ill-conditioning arise, the fitting process becomes a challenging computational issue. Because of the above mentioned problems, recently, the approximation theory has driven its attention on local techniques. Specifically, the approximation of irregularly distributed data via local schemes has gained much attention in both meshfree and mesh-dependent methods. For the latter, the problem results particularly hard and the choice of the mesh turns out to be crucial. As example, in [75], in order to build the local approximating fits, the authors consider spline functions on a uniform triangulation with C 1 or C 2 continuity. While, in [28], polyharmonic splines are effectively used to fit irregular and truly large data sets. Instead, concerning meshfree methods, a local hybrid approximation technique for data with non-homogeneous density, obtained by means of both splines and RBFs, is presented in [74]. But, since bivariate spline functions are involved, the method again strongly depends on the mesh. To avoid this drawback, we focus on purely meshless methods. In this context, the scattered data problem of huge and irregular sets of points is usually performed by means of least squares approximation [229, 269]. Here instead, we focus on PU interpolation. When the PU method is applied in the context of interpolation, except for particular cases [224], the PU subdomains are always supposed to be hyperspheres of a fixed size (see e.g. [47, 48, 102]). But, in case of irregular data this might lead to inaccurate approximations. In [224] variable subdomains are used for an ad hoc 2D problem in finance; specifically, even if data 64
Chapter 3. On the accuracy of the PU method
65
are not quasi-uniform, they have a precise and well-known structure. Thus, the PU subdomains are constructed following exactly their distribution. On the opposite, we here present a method which enables us to select, independently of the node distribution, suitable sizes of the different PU subdomains. Furthermore, we also take into account the critical choice of the shape parameter of the basis function. In fact, it can greatly influence the accuracy of final fit. To such scope, we compute subsequent a priori error estimates depending on both the shape parameter and the size of the PU subdomain [53, 54]. Then, for each patch we select the optimal couple of values, i.e. the subdomain size and the shape parameter, used to solve the local interpolation problem. The error estimates are found out via a modified Leave One Out Cross Validation (LOOCV) scheme [105, 134, 221]. More precisely, since the problem depends on two quantities, for each patch we perform a Bivariate LOOCV (BLOOCV). The resulting method, named BLOOCV-PU, turns out to be extremely accurate compared with the classical PU technique. This improvement, in terms of accuracy, becomes particularly evident when data with non-homogeneous density are considered. The complexity of the algorithm is also taken into account. Specifically, the computational issue consisting in finding all the points belonging to a given subdomain is performed with the use of a novel data structure, the so-called Integer-based Partitioning Structure (I-PS) [88]. It leads to a considerable saving in terms of computational time with respect to the searching technique presented in the previous chapter [47, 48, 55]. Numerical experiments show the good performances of the BLOOCVPU method in case of quasi-uniform data and underline the benefits of such a flexible approach with irregular points. Moreover, we investigate two applications with real world data, including a benchmark glacier data set and points with highly varying densities describing a terrain. The guidelines of the chapter are as follows. In Section 3.1 we introduce the BLOOCV-PU interpolant. The computational aspects of such algorithm and its complexity are described in Sections 3.2 and 3.3, respectively. Extensive numerical experiments and applications with real world data, carried out in Sections 3.4 and 3.5 respectively, are devoted to test the accuracy and the flexibility of the BLOOCV-PU approximant. Finally, in Section 3.6, we deal with conclusions and work in progress. Moreover, all the Matlab codes are made available to the scientific community in a downloadable free software package http://hdl.handle.net/2318/1527447.
Chapter 3. On the accuracy of the PU method
3.1
66
Formulation of the bivariate LOOCV partition of unity method
In the context of the PU method, both the shape parameter and the size of the PU subdomains play a crucial role for the accuracy of the final fit, especially when data with highly varying densities are considered. Thus, here always considering hyperspherical patches, we present a method that allows to suitably select both the radius δj and the shape parameter εj for each PU subdomain Ωj . To this aim, we need to introduce a priori error estimates.
3.1.1
Error estimates
We have to point out that techniques allowing to select a predicted optimal shape parameter via error estimates have already been designed. Precisely, if the function is supposed to be known, the error can be exactly evaluated and thus the optimal shape parameter can be found without uncertainty. Otherwise, all the techniques based on error estimates give an approximated optimal value. Anyway, with abuse of notation, in what follows we will use the term optimal in the sense that such approximation of the optimal value is close to the one that can be found via trials and errors, for which the knowledge of the exact solution is supposed to be provided [102]. Several error estimates are reported in Chapter 1. Specifically, focusing on the PU approach, from Theroem 1.26 the following upper bound for the j-th local approximant holds |f|Ωj (x) − Rj (x)| ≤ PΦ,XNj (x)||f|Ωj ||NΦ (Ωj ) , where f|Ωj ∈ NΦ (Ωj ). Following such strategy, the error is decomposed into two components. The power function can be computed as in (1.15). Therefore, we are able to minimize the power function with respect to the shape parameter. Anyway, this is not an optimal approach since the second component of the error bound also depends on the basis function via the native space norm. In order to avoid this problem, we focus on the so-called cross-validation algorithm, see [102, 133], properly modified for a bivariate optimization problem. It has been introduced in [3, 134] and further developed in [136]. A variant of such method, known in literature as LOOCV, is detailed in [221]. Recent modifications of the cross-validation scheme can be found in [107], where LOOCV is interpreted in the context of PDEs, and in [254]. We point out that all these approaches are always used in order to find the optimal value of the shape parameter for a global interpolation problem. Here instead, we are interested in selecting, for each PU subdomain, the optimal couple (δj , εj ). Carefully choosing for each hypersherical patch
Chapter 3. On the accuracy of the PU method
67
such couple leads to an accurate computation of the PU interpolant. In fact, consistent with Remark 1.4, the PU method preserves the local approximation order for the global fit and thus the problem truly reduces in finding accurate local interpolants. In other words, if we improve the accuracy of the local fits, then also the one of the PU interpolant has benefits. This is even more evident from the following simple upper bound |f (x) − I(x)| ≤
d
X
, f|Ωj (x) − Rj (x) Wj (x) ≤ max f|Ωj − Rj L∞ (Ωj ) j=1,...,d
j=1
which shows that the PU approximation error is governed by the worst local error. Thus, in order to compute an accurate PU interpolant, one can use the method explained in the next subsection.
3.1.2
The bivariate LOOCV error estimate
Let us consider an interpolation problem on Ωj of the form (1.30) and, for a fixed i ∈ {1, . . . , Nj }, let (i)
Rj (x) =
Nj X
cjk φ(||x − xjk ||2 ),
k=1,k6=i
be the j-th interpolant obtained leaving out the i-th data on Ωj . Moreover, let (i) (3.1) eji = fij − Rj (xji ), be the error at the i-th point. Then, the quality of the local fit is determined by some norm of the vector of errors ej = (ej1 , . . . , ejNj )T , obtained by removing in turn one of the data points and comparing the resulting fit with the known value at the removed point. Following [102, 221], we can simplify the computation to a single formula by calculating eji =
cji , (Aj )−1 ii
(3.2)
where cji is the i-th coefficient of the RBF interpolant Rj based on the full data set and (Aj )−1 ii is the i-th diagonal element of the inverse of the corresponding local interpolation matrix. Precisely, in order to obtain an error estimate, we compute the following vector j j � � c c N j 1 . ,..., (3.3) ej1 , . . . , ejNj = −1 (Aj )−1 (A ) j Nj Nj 11
Chapter 3. On the accuracy of the PU method
68
To select the optimal couple (δj , εj ) for each PU subdomain, we calculate (3.3) for several values of the radius (δj1 , . . . , δjP ) and of the shape parameter (εj1 , . . . , εjQ ). In (3.3), the dependence of the errors on the cardinality of the PU subdomain Nj , i.e. on the PU radius, is evident. Moreover, to stress the dependence of (3.3) also on the shape parameter, for a fixed p ∈ {1, . . . , P } and a fixed q ∈ {1, . . . , Q}, we use the notation �
ej δjp , εjq = ej1 δjp , εjq , . . . , ejNj δjp , εjq �
�
��
.
Furthermore, we explicitly indicate the dependence of the RBF on the shape parameter by writing φ = φε . Thus, focusing on the maximum norm, we compute ||ej (δj1 , εj1 )||∞ · · · ||ej (δj1 , εjQ )||∞ .. .. .. (3.4) Ej = . . . . ||ej (δjP , εj1 )||∞ · · ·
||ej (δjP , εjQ )||∞
Note that (3.4) provides an error estimate for several values of the PU radius and of the shape parameter. Therefore, the j-th local approximant is computed considering the couple (δj , εj ) if �
||ej (δj , εj )||∞ = min
p=1,...,P
�
min (Ej )pq .
q=1,...,Q
(3.5)
In other words, the BLOOCV-PU interpolant assumes the form ˜ I(x) =
d X
˜ j (x)Wj (x), R
x ∈ Ω,
(3.6)
j=1
˜ j is given by where, for each subdomain Ωj , R Nj (δj )
˜ j (x) = R
X
cjk φεj (||x − xjk ||2 ),
(3.7)
k=1
and Nj (δj ) indicates the number of points on Ωj of radius δj . Observe that, consistent with Definition 1.21 and Remark 1.3, if the number of patches is proportional to N and if the subdomains form a covering of Ω, then such covering is also regular. This trivially follows from the fact that a hypersphere of radius δj always satisfies an interior cone condition with constants independent of the space dimension; precisely, γ = δj and θ = π/3 [266]. Therefore, all the considerations made in Chapter 1 also hold for the BLOOCV-PU interpolant. This approach obviously leads to a benefit in terms of accuracy, especially when irregular data are considered. However, we have to point out that the computation of the inverse for each couple (δjp , εjq ) is particularly costly for
Chapter 3. On the accuracy of the PU method
69
large δjp . Therefore, for each Ωj we need to carefully choose the extreme values of the discrete searching range for the radius, i.e. the interval [δj1 , δjP ]. Precisely, for each PU subdomain, we have at first to fix the intervals [δj1 , δjP ] and [εj1 , εjQ ], used to find out (δj , εj ). Many researchers already worked on the problem of finding suitable values for the shape parameter in order to increase the accuracy and, at the same time, avoid problems of instability. Thus, one can easily guess how to select a good range for the shape parameter (see e.g. [81, 93, 102, 105, 112]). In other words, for what concerns the shape parameter the notation simplifies; in fact, for each subdomain we can consider the same discrete values, namely (ε1 , . . . , εQ ). On the opposite, fixing for all the subdomains the same discretization (δ1 , . . . , δP ) can lead to inaccurate solutions. More specifically: Problem 3.1. Arbitrarily fixing, for all the subdomains, the same searching interval [δ1 , δP ] can lead to the following issues: i. the union of the PU subdomains might not form a covering of the domain, ii. in regions characterized by a low density of points, δ1 can be too small to avoid empty patches or subdomains containing very few points, iii. in regions characterized by a high density of points, δP can be too large and, in this case, both complexity and ill-conditioning grow. In the subsequent section we detail a feasible scheme useful to determine the discrete interval [δ1 , δP ], in which we can search for the j-th suitable radius, avoiding the above mentioned problems. To reach this aim, we first need an efficient and multidimensional partitioning structure to organize the points among the different subdomains.
3.2
Computation of the bivariate LOOCV partition of unity method
In this section we illustrate the computational aspects of the BLOOCV-PU method. Therefore, the steps of such scheme, which makes use of the I-PS, are shown as pseudo-code in the BLOOCV-PU Algorithm. As already pointed out in Problem 3.1, the searching interval [δ1 , δP ] must be properly selected. Essentially, in order to obtain reliable error estimates, we want to make sure of having a reasonable number of points on each patch. Such consideration suggests the use of a K-nearest neighbor procedure. As example, in [90], suitable supports of CSRBFs have been selected detecting, via a triangulation, the K-nearest neighbor set. This turns out to be expensive and moreover fixing an arbitrary K does not guarantee a good approximation. Thus, we will use a similar procedure
Chapter 3. On the accuracy of the PU method
70
to [90] only to determine the initial reasonable searching range [δ1 , δP ] for the radius of the j-th patch and then such interval will be used in the computation of (3.4). The complexity needed to construct the BLOOCV-PU interpolant will be taken into account. Specifically, we will not perform a K-nearest neighbor procedure, but we will use the multidimensional I-PS. It turns out to be faster than the procedures presented in Chapter 2 and, unlike them, it can be applied in any space dimension M (and not only for M = 2, 3).
3.2.1
Definition of the bivariate LOOCV partition of unity framework
Here we refer to the Steps 1-6 of the BLOOCV-PU Algorithm. In order to describe the procedure, we need to recall some definitions and generalize in a multidimensional context the notation introduced in the previous chapter for the S-PS. We treat the problem in the most general setting. Thus, let us consider a set of data XN = {xi , i = 1, . . . , N } ⊆ Ω. In order to perform the method, we need again to define the hyperrectangle R containing the scattered data and the bounding box L, see (2.1) and (2.2), respectively. Then, we define the PU centres as a grid1 of points on Ω such that (2.3) is satisfied. More precisely, we consider a similar proportion to (2.4), where here AΩ denotes the hypervolume of Ω. As in the previous chapter, we take only those PU centres lying on Ω. Furthermore, in the same way we also define the set Es = {˜ xi , i = 1, . . . , s} of evaluation points on Ω. Then, in order to organize points into the different patches, we consider the partitioning structure described in the next subsection.
3.2.2
The integer-based data structure
Here we refer to the Steps 7-8 of the BLOOCV-PU Algorithm. To make simpler the presentation, we first suppose to have hyperspherical patches all having the same radius δ, defined in (2.5). Specifically, in (2.5), we fix r = 1. Starting from the S-PS procedure [47, 48, 55], in which points are stored into q M blocks, where q is defined as in (2.6), we now describe how to extend such procedure in a double way. Precisely, we present a multidimensional procedure which allows to consider variable radii δj . As in the S-PS, in the I-PS we number blocks from 1 to q M , starting from the subspace of dimension M − 1, obtained projecting along the first coordinate and thus parallel to the remaining ones. 1
To generate a multidimensional grid, we use the Matlab function MakeSDGrid.m available at [102].
Chapter 3. On the accuracy of the PU method
71
¯ j , the index of the k-th block containing the Then, given a PU centre x subdomain centre is given by (2.7). To find the indices km , m = 1, . . . , M , in (2.7), we use an integer-based procedure consisting in rounding off to an integer value. Specifically, for each PU centre x ¯j = (¯ xj1 , . . . , x ¯jM ), we have that � � x ¯jm km = . (3.8) δ Exactly the same procedure is adopted in order to store both the scattered data and the evaluation points into the different blocks. Here the radius is supposed to be variable for each patch and thus, if the radius δj is such that δj > αδ, α ∈ N, given the centre x ¯, we search for the neighboring points in the k-th block and in its (3 + 2α )M − 1 neighboring blocks. In the previous chapter, nodes and evaluation points are organized in blocks by using recursive calls to a sorting routine, while here this step is replaced by (3.8). Such approach improves three aspects of the partitioning structure previously presented. Precisely, the I-PS: i. works in any dimension, while the S-PS only works for bivariate and trivariate interpolation, ii. allows to work with variable radii, while the S-PS strictly depends on a fixed size of the subdomains, iii. reduces the complexity of the S-PS (see Section 3.3).
3.2.3
Selection of a searching interval for the partition of unity radius
Here we refer to the Step 9 of the BLOOCV-PU Algorithm. When we deal with quasi-uniform or grid data, the number of points on each subdomain of radius δ is about constant. On the opposite, in case of irregular nodes, the number of points lying on the different patches is far from being constant or, even worse, we can have empty subdomains. This consideration turns out to be useful to determine the lower bound of the interval [δ1 , δP ] for the j-th subdomain. In fact, given the number N of scattered data in Ω and its hypervolume AΩ , from a simple proportion we have that a suitable number K of points belonging to Ωj of radius (2.5) is K≈
N B(δ) , AΩ
(3.9)
where B(δ) is the hypervolume of the hypersphere of radius δ. The value found in (3.9) represents the number of points we expect on average on each patch supposing to have a uniform node distribution.
Chapter 3. On the accuracy of the PU method
72
Therefore, given the j-th subdomain of radius δj1 = δ, we compute its cardinality via the I-PS. Then, if such cardinality is less than the one given by (3.9), δj1 is updated as follows δj1 = δj1 + tδ, where 0 < t < 1. The procedure continues in this way until (3.9) is satisfied, i.e. δj1 is determined with recursive calls to the I-SP so that Card(Ωj ) ≥
N B(δj1 ) . AΩ
Acting in this way, we solve the second computational aspect outlined in Problem 3.1. In other words, there are few enough points for each patch. Then, in order to avoid also the third issue of Problem 3.1, the simplest strategy, which takes into account the density of points and turns out to be effective, is to choose P discrete values in an interval of the form [δj1 , hδj1 ],
h ∈ R+ ,
h > 1.
(3.10)
Roughly speaking, since the upper bound of the searching interval is proportional to the lower bound and since this lower bound is large only if the density of points is low, we effectively avoid problems arising from high density of points, i.e. systems are not too large and the ill-conditioning is kept under control.
3.2.4
The bivariate LOOCV local computation
Here we refer to the Steps 10-15 of the BLOOCV-PU Algorithm. Once the searching interval for the radius is calculated, we can compute (3.4) and form the local interpolants with (3.5). Finally, such local RBF approximants are accumulated, by means of the PU weights, into the BLOOCV-PU interpolant (3.6). Obviously, doing in this way, we expect an improvement in terms of accuracy, with respect to the classical implementation of the PU approach. In particular, depending on the distribution of the data set, we expect the following behavior classes: i. with quasi-uniform points: both the BLOOCV-PU and classical PU methods give accurate approximations, ii. with strongly non-uniform points: the classical PU method fails, while the BLOOCV-PU maintains a good accuracy. We end up this subsection with the illustrative Figure 3.1, devoted to show how the classical PU structure, shown in Figure 1.1, is modified by means of the BLOOCV-PU algorithm.
Chapter 3. On the accuracy of the PU method
73
1
0.8
x2
0.6
0.4
0.2
0
0
0.2
0.4
0.6
0.8
1
x1
Figure 3.1: An illustrative example of PU subdomains covering the domain Ω = [0, 1]2 and obtained via the BLOOCV-PU algorithm.
3.3
Complexity analysis
In this section we analyze the computational cost of the BLOOCV-PU method. It will be pointed out that the main cost is due to the computation of the error estimates, while the I-PS turns out to be really cheap.
3.3.1
The integer-based data structure
The I-PS, after organizing the scattered data into the different blocks, given a subdomain Ωj searches for all the points lying on Ωj in a reduced number of blocks. Specifically, in order to store the scattered data among the different blocks, it makes use of an integer-based procedure that assigns to each node xi , i = 1, . . . , N , the corresponding block. This step requires O(N ) time. Then, we apply the optimized searching routine already used in Chapter 2. Such procedure is performed in a constant time. Observe that the I-PS turns out to be more efficient than the S-PS; in fact the latter, to store the points among the different blocks, needs O(N log N ) operations. These findings are supported by the results shown in Table 3.2 and in Figure 3.2. Specifically, we consider in a 2D framework different sets of Halton data (see Appendix A). Tests have been carried out on a Intel(R) Core(TM) i7 CPU 4712MQ 2.13 GHz processor.
3.3.2
The bivariate LOOCV local computation
For each PU subdomain, several error estimates are calculated via (3.2). Such computation needs O(Nj3 ) operations. Thus, simplifying the calculation via (3.2) is the key step which enables us to maintain a reasonable
Chapter 3. On the accuracy of the PU method
74
INPUTS: N , number of data; XN = {xi , i = 1, . . . , N } ⊆ Ω, set of data points; FN = {fi , i = 1, . . . , N }, set of data values; dR , number of PU subdomains in R; sR , number of evaluation points in R; φ, the basis function; (ε1 , . . . , εQ ), the discretization of the searching interval for the shape parameter; h, the upper bound for the discetization of the searching interval for the radius; P , the number of discrete values for the radius. ˜ xi ), i = 1, . . . , s}, set of approximated values. OUTPUTS: A˜s = {I(˜ Steps 1-6: Refer to the CSRBF-PU Algorithm (Section 2.1). Step 7: The I-PSs are built for the set XN of data points and the set Es of evaluation points. Step 8: For each patch Ωj , j = 1, . . . , d, the integer-based containing query and the range search routines are performed allowing to find: i. all data points XNj belonging to the subdomain Ωj , ii. all evaluation points Esj belonging to the patch Ωj . Step 9: Compute δj1 with a recursive use of the I-PS. Step 10: For each δjp , p = 1, . . . , P , with δjP = hδj1 Step 11: For each εq , q = 1, . . . , Q Step 12: the integer-based containing query and the range search routines are performed allowing to store the points into the subdomains. Step 13: Update Ej , see (3.4). Step 14: The interpolation and evaluation matrices are computed and an ˜ j is formed as in (3.7). accurate local interpolant R Step 15: The local fits are accumulated into the global interpolant (3.6).
The BLOOCV-PU Algorithm. Routine performing the BLOOCV-PU method, using the I-PS and related searching procedure. N
25000
50000
100000
200000
tI−P S tS−P S
5.13 5.21
10.68 12.40
21.99 28.77
45.00 71.55
Table 3.2: CPU times (in seconds) obtained by running the sorting-based procedure (tS−P S ) and the integer-based one (tI−P S ). complexity cost. Indeed, evaluating the error via (3.1) is computationally expensive. In particular, the matrix inverse, which requires O(Nj3 ) operations, must be computed for each node. This step needs a total computational cost of O(Nj4 ) operations, j = 1, . . . , d, but using (3.2), the complexity
Chapter 3. On the accuracy of the PU method
75
1 0.95
tI−PS/tS−PS
0.9 0.85 0.8 0.75 0.7 0.65 0.6
0.5
1
1.5
N
2 5
x 10
Figure 3.2: CPU time ratios tI−P S /tS−P S by varying N .
cost significantly decreases. Anyway, the complexity of the BLOOCV-PU algorithm is quite high. The error estimate (3.2) needs to be computed for each subdomain Ωj and for each δji , i = 1, . . . , P , and εi , i = 1, . . . , Q. Remark 3.1. The computation of the error estimate can be slightly speeded up by using a multivariate optimization algorithm. However, in the free software package we use the standard implementation as in (3.4). Finally, we remark that in the assessment of the total computational cost, we have to add up the complexity needed to construct the global interpolant (see Section 2.2).
3.4
Numerical experiments
This section is devoted to showing, by means of extensive numerical simulations the flexibility and the accuracy of the BLOOCV-PU method. It is applied by fixing the initial intervals for the radii as in (3.10), with h = 2 and P = 6. These values are chosen so that we ensure to have enough points on each subdomain and a sufficient number of radii to test the accuracy of the interpolants. Tests are carried out considering the so-called product and valley functions [28, 205], respectively defined as f1 (x1 , x2 ) = 16x1 x2 (1 − x1 )(1 − x2 ), and i4 1 h f2 (x1 , x2 ) = x2 cos(4x21 + x22 − 1) . 2
Chapter 3. On the accuracy of the PU method
76
To point out the accuracy of the tests, we consider a grid of sR = 40M evaluation points and we refer to the MAE and RMSE, defined in (2.12) and (2.13), respectively. Moreover, we also investigate the two conditioning estimates reported in (2.14) and (2.15). Then, in order to test the method with particularly hard nodes, we consider points coming from a Schwarz-Christoffel transformation (refer to [92, 94, 150] for further details). More precisely, we focus on a special case of conformal map from the unit disk onto a polygon. Thus, at first we define nodes in the unit disk and then we map them into a chosen polygon (see Appendix A for further details). Specifically, we consider the following points defined on the unit disk 2(j − 1)π 2ηk π 2(j − 1)π 2ηk π Rk cos , Rk sin + + n n n n
�
�
�
�
��
,
(3.11)
where j = 1, . . . , n, k = 1, . . . , m, and i = 1, . . . , N , with N = nm, R1 < · · · < Rm , and 0 ≤ ηk ≤ 1. Figure 3.3 shows the result of conformally mapping 289 points of the form (3.11) onto a known polygonal region. The points plotted in Figure 3.3 are the ones used in the numerical simulations. We consider such data because they are far from being quasi-uniform, but at the same time they are built up with a specific rule and thus tests are repeatable. Moreover, they simulate practical situations, as it will be evident in Section 3.5, where we will deal with data coming from real life. 1
0.8
x2
0.6
0.4
0.2
0 0
0.2
0.4
0.6
0.8
1
x1
Figure 3.3: An example of 289 points on concentric circles mapped onto a polygonal region.
The BLOOCV-PU approach will be compared with the classical PU method, i.e. the PU scheme is applied with a fixed radius and a fixed shape parameter. Thus, such classical approach requires to fix these two parameters. Concerning the radius, the classical PU method is generally
Chapter 3. On the accuracy of the PU method
77
applied considering a fixed size of the patches as in (2.5), while for the shape parameter, in literature, the choice is almost arbitrary. In fact, even if techniques allowing to obtain stable approximations when ε → 0 have already been developed [81, 112], there is not an a priori good value for the latter. We will later discuss this concept providing several tests.
3.4.1
Results for quasi-uniform data
In this subsection we consider Halton points and, because of their regularity, we take a smooth RBF as local approximant, specifically the IMQ C ∞ kernel φ3 , see (1.22). Therefore, choosing 30 values for the shape parameter in the interval [0.1, 10] is reasonable (see e.g. [44, 102]). Results, obtained by means of the BLOOCV-PU interpolant with the functions f1 and f2 , are shown in Tables 3.3 and 3.4, respectively. We also report the errors of the standard PU method, obtained by fixing the radius as in (2.5) (with r = 1) and the shape parameter ε = 0.6. For sure the approximation changes if ε varies and therefore we investigate other cases in the sequel. For a graphical representation of the distribution of the absolute errors, refer to Figure 3.4. Such figure shows that the error for both test functions is larger close to the boundary. Moreover, for f2 it also increases in correspondence of the oscillations of the test function. From Tables 3.3 and 3.4, we can easily note that the results obtained with the BLOOCV-PU interpolant are more accurate than the ones carried out with the standard PU. However, in order to get such accurate approximation, we have to pay in terms of efficiency. For instance, with 289 and 1089 points the BLOOCV-PU can be computed in 5.48 s and 20.08 s, respectively, while the classical PU interpolation only requires 0.21 s and 0.60 s.
Figure 3.4: The false-colored absolute errors computed on 1089 Halton points and obtained by applying the BLOOCV-PU method with the IMQ C ∞ kernel as local approximant for f1 (left) and f2 (right).
Chapter 3. On the accuracy of the PU method
78
N
method
MAE
RMSE
289
PU BLOOCV-PU
5.66E − 02 2.36E − 04
3.64E − 03 1.03E − 05
1089
PU BLOOCV-PU
1.52E − 02 7.89E − 05
7.57E − 04 2.88E − 06
4225
PU BLOOCV-PU
1.01E − 02 1.39E − 05
3.88E − 04 3.84E − 07
16641
PU BLOOCV-PU
3.27E − 02 3.15E − 06
8.27E − 04 9.67E − 08
66049
PU BLOOCV-PU
1.09E − 04 6.80E − 07
1.08E − 05 2.68E − 08
Table 3.3: MAEs and RMSEs for f1 computed on Halton points with the IMQ C ∞ kernel as local approximant. N
method
MAE
RMSE
289
PU BLOOCV-PU
4.30E − 01 2.76E − 01
2.59E − 02 1.32E − 02
1089
PU BLOOCV-PU
6.20E − 02 8.93E − 03
3.51E − 03 2.11E − 04
4225
PU BLOOCV-PU
2.00E − 02 1.12E − 04
8.63E − 04 3.88E − 06
16641
PU BLOOCV-PU
1.18E − 02 2.80E − 06
4.07E − 04 8.26E − 08
66049
PU BLOOCV-PU
4.19E − 03 1.76E − 06
1.23E − 04 5.10E − 08
Table 3.4: MAEs and RMSEs for f2 computed on Halton points with the IMQ C ∞ kernel as local approximant. Finally in Table 3.5, we investigate the condition numbers of the two methods. Observe that the condition numbers for the BLOOCV-PU are characterized by a slower growth than the ones obtained with the standard PU method. We registered similar results in all the considered cases and thus, for shortness, it will be no longer shown in other examples. The growing of ill-conditioning, registered applying the classical approach, is due to the fact that a wrong choice of the shape parameter, especially when smooth RBFs are considered, can lead to problems of instability. Therefore,
Chapter 3. On the accuracy of the PU method
79
N
method
MaxCond
AvCond
289
PU BLOOCV-PU
4.39E + 14 3.19E + 19
2.54E + 13 1.48E + 18
1089
PU BLOOCV-PU
4.30E + 18 4.18E + 19
3.16E + 16 9.78E + 17
4225
PU BLOOCV-PU
1.90E + 19 5.20E + 20
3.44E + 17 2.24E + 18
16641
PU BLOOCV-PU
1.96E + 22 6.23E + 21
6.98E + 18 5.12E + 18
66049
PU BLOOCV-PU
2.88E + 23 7.24E + 21
2.11E + 19 3.34E + 18
Table 3.5: MaxConds and AvConds for f1 computed on Halton points with the IMQ C ∞ kernel as local approximant. one may argue that the results of the PU method might truly improve by varying the shape parameter. This is trivially true, but at the same time automatically choosing a safe shape parameter, which also avoids problems of ill-conditioning, is one of the main advantages of the BLOOCV-PU method. Anyway, in order to clarify this concept, we report in Table 3.6 the results obtained by choosing in the standard PU algorithm the optimal shape parameter, but not the optimal radius, for each subdomain. Note that this is only a particular case of the BLOOCV-PU algorithm and thus no longer investigated. N
MAE
RMSE
289
3.35E − 02
3.00E − 03
1089
1.25E − 02
8.88E − 04
4225
7.50E − 03
2.48E − 04
16641
2.49E − 03
1.11E − 04
66049
1.61E − 04
8.64E − 06
Table 3.6: MAEs and RMSEs for f1 computed on Halton points and obtained by applying the BLOOCV-PU method with optimal εj (but δj = δ).
Chapter 3. On the accuracy of the PU method
3.4.2
80
Results for non-conformal data
Let us now turn into the more complex case of irregular data. We use as data distribution the one shown in Figure 3.3. In order to have a better understanding of their distribution, we report in Table 3.7 the two indicators of data regularity, i.e. the fill distance (1.17) and the separation distance (1.16) of the non-conformal points and we compare them with those of Halton data. The last column gives an idea of the quasi-uniformity constant, see Remark 1.1. As evident, points coming from a Schwarz-Christoffel transformation are really far from being quasi-uniform. In this case, the interpolation process results particularly hard. In fact, we remark that the ill-conditioning primarily grows due to the decrease of the separation distance. N
data set
hXN
qXN
hXN / qXN
289
Halton non-conformal
7.46E − 02 1.87E − 01
1.03E − 02 4.90E − 03
7.20E + 00 3.81E + 01
1089
Halton non-conformal
3.93E − 02 1.39E − 01
4.33E − 03 1.31E − 03
9.07E + 00 1.06E + 02
4225
Halton non-conformal
2.19E − 02 9.94E − 02
2.19E − 03 6.84E − 04
9.97E + 00 1.45E + 02
Table 3.7: Fill and separation distances of different sets of Halton data and non-conformal points. Since points are not well-distributed and ill-conditioning is expected, we choose as local approximant a CSRBF, specifically the Wendland’s C 6 kernel ϕ3,3 , see (1.24). The standard PU approach is applied by fixing the shape parameter ε = 0.5 and the radius as in (2.5). The results are shown in Tables 3.8 and 3.9. In this case the classical PU method with a fixed size of the subdomains gives inaccurate approximations. We verify with numerical experiments that it does not depend on the shape parameter; specifically, neither the optimal one changes the order of the approximation errors. The BLOOCV-PU reveals its robustness in both cases. In fact such method turns out to be meaningful when irregular data sets are considered.
3.5
Application to Earth’s topography
This section is devoted to test the BLOOCV-PU scheme with two real world data sets. The first one is the so-called glacier data set. It consists of 8345 points representing digitized height contours of a glacier [73, 229, 269]. The
Chapter 3. On the accuracy of the PU method
81
N
method
MAE
RMSE
289
PU BLOOCV-PU
1.90E − 01 4.15E − 02
3.28E − 02 3.64E − 03
1089
PU BLOOCV-PU
2.01E − 01 9.11E − 03
1.12E − 02 5.40E − 04
4225
PU BLOOCV-PU
2.23E − 01 3.34E − 03
1.44E − 02 1.24E − 04
16641
PU BLOOCV-PU
1.92E − 01 7.05E − 04
1.12E − 02 3.21E − 05
66049
PU BLOOCV-PU
2.45E − 01 3.70E − 04
1.26E − 02 1.14E − 05
Table 3.8: MAEs and RMSEs for f1 computed on non-conformal points with the Wendland’s C 6 kernel as local approximant. N
method
RMSE
MAE
289
PU BLOOCV-PU
5.00E − 01 3.13E − 01
5.30E − 02 3.47E − 02
1089
PU BLOOCV-PU
5.00E − 01 8.38E − 02
3.90E − 02 7.11E − 03
4225
PU BLOOCV-PU
4.99E − 01 4.77E − 02
4.63E − 02 2.39E − 03
16641
PU BLOOCV-PU
5.00E − 01 8.10E − 03
4.34E − 02 7.51E − 04
66049
PU BLOOCV-PU
5.00E − 01 1.27E − 03
4.03E − 02 8.28E − 05
Table 3.9: MAEs and RMSEs for f2 computed on non-conformal points with the Wendland’s C 6 kernel as local approximant. difference between the highest and the lowest point is 800 m. As second example, we consider the so-called black forest data set [74, 75]. It consists of 15885 points representing a terrain in the neighborhood of Freiburg, Germany. In this case, the difference between the maximal and minimal heights is 1214 m. The 2D and 3D views of the rescaled data sets in [0, 1]2 are plotted in Figure 3.5. Because of the high variability of the points, we use as local approximant
Chapter 3. On the accuracy of the PU method
82
in both cases the Matérn C 2 kernel φ5 , see (1.23). Figure 3.6 shows the reconstruction of the surfaces defined by the two data sets. It has been obtained evaluating the BLOOCV-PU interpolant on a grid of 80 × 80 points. 1
0.8
2200 2000
0.6
x3
x2
1800 0.4
1600 1400
0.2
1 1200 0
0.5
0
0.5 0
0.2
0.4
0.6
0.8
1
1
x1
0
x2
x1
1
1500 0.8
1000
x3
x2
0.6
0.4
500
0.2
0 0 0.5
0 0
0.2
0.4
0.6
x1
0.8
0.5
1
1
x1
0
x2
Figure 3.5: A 2D and 3D view of glacier (left) and black forest (right) data sets.
To test the accuracy we use, as validation set, 90 and 170 points of the glacier and black forest data sets, respectively. Such data are plotted in orange in Figure 3.5. The errors obtained in these cases are shown in Table 3.10. The ones obtained with the standard PU algorithm are not shown. Indeed, with both data sets the use of a fixed size of the subdomains does not give acceptable approximations.
Chapter 3. On the accuracy of the PU method
83
Figure 3.6: Graphical representation of glacier (left) and black forest (right) data sets.
Data set
MAE
RMSE
Glacier
3.31 m
0.65 m
Black forest
26.0 m
5.73 m
Table 3.10: MAEs and RMSEs computed on the glacier and black forest data sets and obtained by using the BLOOCV-PU method with the Matérn C 2 as local RBF interpolant.
3.6
Concluding remarks
In this chapter we presented a robust tool enabling us to safely select, for each PU subdomain, both its size and shape parameter. Numerical evidence and applications with real world measurements show that the BLOOCVPU method accurately fits data with highly varying densities. Moreover, the BLOOCV-PU implementation is carried out with a multidimensional searching procedure which has been proved to be extremely fast. Work in progress consists in varying the shape of the PU subdomains, which here are supposed to be hyperspherical patches. This is not trivial since several requirements for the covering might be not easily satisfied. Moreover, looking deeply at the approximating surface of f2 plotted in Figure 3.4 (right), we can note that the PU interpolant does not preserve the non-negativity of the function values, i.e. the fit of non-negative data is negative. In applications this can cause the violations of some physical constraints. Such problem concerns the PU method in its classical formulation, but it becomes evident with the use of the BLOOCV-PU method. In fact,
Chapter 3. On the accuracy of the PU method
84
improving the accuracy of the interpolant might lead to smooth oscillations of the approximant and this, in turn, might lead to the above mentioned problem. Further studies in this direction are presented in Chapter 4.
Chapter 4
On the positivity of the partition of unity method In this chapter, we discuss the problem of constructing RBF-based PU interpolants that are non-negative if data values are non-negative [87]. Since such property is known as positivity-preserving property, to keep a common notation with existing literature, we use the term positive (instead of non-negative) function values or interpolants. More specifically, we compute positive local approximants by adding up several constraints to the interpolation conditions. This approach, considering a global approximation problem and CSRBFs, has been previously proposed in [283]. Here however, the use of the PU technique enables us to intervene only locally and as a consequence to reach a better accuracy. This is also due to the fact that we select the optimal number of positive constraints and we do not restrict to the use of CSRBFs. Such approach turns out to meaningful in applied sciences; indeed dealing with applications, given a set of data, we often have additional properties, such as the positivity of the measurements, which we wish to be preserved during the interpolation process. For this reason, mostly considering rational spline functions with C 1 or 2 C continuity, the recent research studied techniques devoted to construct approximants that preserve the positivity of the measurements. As example, the conditions under which the positivity of a cubic piece may be lost are investigated in [238]. Moreover, in order to preserve the positivity, the use of bicubic splines, coupled with a technique based on adding extra knots, has been investigated in [9, 33]. A positive fit is instead obtained by means of rational cubic splines in [157, 158]. The same authors also developed a positive surface construction scheme for positive scattered data arranged over triangular grids [156]. Note that all the above mentioned methods depend on a mesh. However, the positivity-preserving problem is also well-known in the field of meshfree 85
Chapter 4. On the positivity of the PU method
86
methods. In fact, the positivity-preserving problem has been investigated for the Shepard-type methods [242] and for the Modified Quadratic Shepard’s (MQS) approximant [218, 219, 220], see e.g. [10, 30]. Here we focus on RBF interpolation. In fact, even if such meshfree approach has been extensively studied in the recent years, especially focusing on the stability of the interpolant, not a lot of effort has been addressed to construct positivity-preserving approximants. Such problem has been studied only in particular and well-known cases; for instance, in [257] it is analyzed for TPSs. Other methods, which follow from the quasi-interpolation formula given in [280], have been proposed and effectively performed to construct positive approximants of positive measurements [263, 279]. Focusing on RBFs, we present a method which preserves the positivity of the PU interpolant for a wider family of kernels. In [283] a global positive RBF approximant is constructed by adding up to the interpolation conditions several positive constraints and considering CSRBFs. Even if the optimal number of constraints and their suitable location are not considered, the results are promising and show that this technique has a better accuracy than the Constrained MQS (CMQS) approximant. However, since a global interpolant is used, adding up other constraints to preserve the positivity implies that the shape of the curve or of the surface is consequently globally modified. As pointed out in [283], this might lead to a considerable decrease of the quality of the approximating function in comparison with the unconstrained CSRBF interpolation. Thus here, in order to avoid such drawback, focusing on 2D data sets, the PU method is performed by imposing positive constraints on the local RBF interpolants. Such approach enables us to consider constrained interpolation problems only in those PU subdomains that do not preserve the required property. This leads to an accurate method compared with existing techniques [10, 30, 279, 283]. Moreover, in contrast with [279, 283], we can consider truly large data sets. In order to construct the so-called Positive Constrained PU (PC-PU) approximant, following [283], we locally impose several positive constraints and we reduce to solve an optimization problem. The number of constraints is properly selected by means of the LOOCV approach. This is a fundamental step to maintain a good accuracy of the fit. Moreover, differently from [283], a wider family of RBFs (not only compactly supported) is considered. The main disadvantage of using CSRBFs is that they introduce large errors in the area in which the interpolant is negative. This is due to the fact that the shape of the fit is modified only within the support of the CSRBF and thus neighbouring points are not taken into account. Numerical evidence and a clinical application show that the use of infinitely smooth globally defined RBFs leads to an improvement in this direction. Finally, we point out that the Matlab codes for the PC-PU method show strong similarities with the ones presented in the previous chapters.
Chapter 4. On the positivity of the PU method
87
Therefore, there is no need to release any free software package. However, we will clearly point out all the informations that are meaningful for the implementation purpose. The guidelines of the chapter are as follows. In Section 4.1 we investigate the positivity of the PU approximant by considering extra positive constraints. The computational aspects are analyzed in Section 4.2. Section 4.3 is devoted to the complexity analysis. Numerical experiments are shown in Section 4.4. Moreover, in Section 4.5 we investigate a clinical application consisting in simulating the prostate cancer dynamics. Finally, Section 4.6 deals with conclusions and future work.
4.1
Formulation of the positive constrained partition of unity method
In addition to the assigned interpolation conditions, we consider several positive constraints. This allows to preserve the positivity of the measurements. Therefore, the PC-PU approach turns out to be meaningful especially in applications, indeed in order to avoid the violation of biological or physical measurements, a positive fit is often necessary.
4.1.1
The positivity property
We already pointed out that the PU interpolant preserves the local approximation order for the global fit, see Remark 1.4. In particular, the PU method can be thought as the Shepard’s method where Rj are used instead of the data values fj . Even if the Shepard’s approximant [242] in its original formulation is overcome, it possesses a useful property; specifically, it lies within the range of the data. As a consequence, the interpolant is positive if the data values are positive. This is stated more formally below (see [139]). Theorem 4.1. Given XN = {xi , i = 1, . . . , N } ⊆ Ω a set of distinct data points with Ω ⊆ RM and FN = {fi = f (xi ), i = 1, . . . , N } the associated function values, if S(x) is the Shepard’s approximant then min fi ≤ S(x) ≤ max fi ,
i=1,...,N
i=1,...,N
x ∈ Ω.
Theorem 4.1 and in particular the positivity-preserving property do not hold in the quadratic formulation of the Shepard’s method nor for the PU approximant. In order to avoid such drawback for the PU method, we can directly act on the local RBF interpolants, following the strategy proposed in [283]. In such paper, a scheme devoted to construct a positive global fit is performed by defining several constraints. Extensive results show the good performances of such approach. In fact, the fit of positive function values
Chapter 4. On the positivity of the PU method
88
is always positive, but, in comparison with the original unconstrained interpolation, a degrade of the quality of the approximation is observed. This is mainly due to the fact that a global method is considered and thus the shape of the surface is consequently globally modified (and not only in the area in which the interpolant is negative). Therefore, here we present an alternative formulation for a positive fit considering (1.29).
4.1.2
A positive partition of unity fit
Since we consider strictly positive definite functions, sufficient condition to have positive approximants on each subdomain Ωj is that the coefficients cjk of (1.30) are all positive. To such scope, following [283], at first we choose ˆj added data a set of N ˆj }, XNˆj = {ˆ xji , i = Nj + 1, . . . , Nj + N on the subdomain Ωj . Of course, if the RBF can become negative, the above criterion is not useful. However, also in this chapter, we continue to consider only strictly positive definite RBFs. Then, as in the previous chapter, after explicitly indicating the dependence of the RBF on its shape parameter, the j-th approximation problem ˆ j of the form consists in finding a function R ˆ j (x) = R
Nj X j
ck φε (||x −
ˆj Nj +N
xjk ||2 )
+
X ˆ k=N j +1
k=1
cjkˆ φˆεkˆ (||x − x ˆjkˆ ||2 ),
(4.1)
ˆj , i = 1, . . . , Nj + N
(4.2)
such that ˆ j (xj ) = f j , R i i
i = 1, . . . , Nj ,
cji ≥ 0,
where xji ∈ XNj , x ˆjkˆ ∈ XNˆj and φˆεkˆ are CSRBFs. The reason why in (4.1) we consider different supports for the CSRBFs follows from the fact that, if they are properly chosen, we can ensure that the problem (4.1) subject to (4.2) admits solution (in the special case for ˆj = Nj ). This is proved in [283] by using the following theorem which N [27, 138]. Theorem 4.2 (Gordan). Let {ai }N i=1 be M -dimensional vectors. There does not exist a vector v such that aTi v < 0 if and only if there exist nonPN negative real numbers {ri }N i=1 ri ai = 0. i=1 , such that The theorem ensuring the existence of a solution of the constrained probˆj = Nj and its proof are given in [283]. lem if N ˆ ji is added on Ωj in a neighborhood of a In particular, if a constraint x point, namely xji , we select εˆi such that only xji belongs to the support of
Chapter 4. On the positivity of the PU method
89
the CSRBF. This choice is due to the fact that, doing in this way, at least ˆj = Nj , the problem (4.1) subject to (4.2) admits solution. In fact, when N let us define on Ωj �
(ajk )T = − φε (||xji − xjk ||2 ) �N j
�
(ajkˆ )T = − φˆεkˆ (||xji − x ˆjk ||2 ) (aj2Nj +1 )T =
�Nj i=1
,
= (0, . . . , −bjkˆ , . . . , 0),
i=1 j j (f1 , . . . , fN ), j
where bjkˆ , kˆ = Nj + 1, . . . , 2Nj , are positive real numbers and k = 1, . . . , Nj .
Then, since a vector v such that (aji )T v < 0, i = 1, . . . , 2Nj + 1, does not exist, from Theorem 4.2 we know that there exist non-negative real numbers 2N +1 {cji }i=1j such that 2Nj +1
X
cji aji = 0 and
cj2Nj +1 > 0,
i=1
and thus a solution to (4.1) subject to (4.2) exists. In practical use, the aim is to add as few data as possible. Therefore, P2N according to [283], one can find the minimum of i=Nj j +1 sign(ci ), such that (4.2) is satisfied. However, this approach does not guarantee an optimal solution in terms of accuracy. Thus, with a technique described in the next ˆj which yields maximal section, we select the optimal number of added data N accuracy. Nevertheless, the aim is to perturb (1.30) with small quantities. A feasible way is to find
min
ˆj ci ,i=Nj +1,...,Nj +N
1/2
ˆj N j +N
X
c2i
,
(4.3)
i=Nj +1
such that (4.2) is satisfied. The local approach enables us to modify the shape of the surface only if a negative local approximant is found. Indeed, if the j-th original local fit of the form (1.30) is positive, we do not need to add other data and in ˆ j = Rj on Ωj . Therefore, for each subdomain we select a suitable this case R ˆj , which can also be 0, and the PC-PU approximant number of constraints N assumes the form P ˆ j (x) Wj (x) = Pd Iˆ (x) = dj=1 R j=1
+
PNj +Nˆj ˆ k=N j
�
�
PNj
j k=1 ck φε (||x
− xjk ||2 ) (4.4)
cjˆ φˆεkˆ (||x − x ˆjkˆ ||2 ) Wj (x). +1 k
ˆj will be selected with a technique The optimal number of added data N described in the next section.
Chapter 4. On the positivity of the PU method
90
Remark 4.1. In [283] authors limit their attention to CSRBFs. Here instead, we couple them with globally defined RBFs. In fact, even if specific supports of compactly supported kernels must be associated to the added constraints, see the second term in the right-hand side of (4.1), we do not have any restrictions on the first term in the right-hand side of (4.1). Thus, we can use different types of RBFs. In what follows, we will point out that coupling RBFs and CSRBFs leads to a benefit in terms of accuracy.
4.2
Computation of the positive constrained partition of unity method
This section is devoted to describe the PC-PU approach (the steps of this scheme are summarized in the PC-PU Algorithm). In particular, we focus on a suitable choice of the number of positive constraints and their location.
4.2.1
Definition of the positive constrained partition of unity framework
Here we refer to the Steps 1-9 of the PC-PU Algorithm. Given a data set XN = {xi , i = 1, . . . , N } ⊆ Ω, we can define R and L as in (2.1) and (2.2), respectively. Then, with the technique described in Chapter 2, we construct the set of subdomains centres Cd = {¯ xi , j = 1, . . . , d} ⊆ Ω and the set of evaluation points Es = {˜ xi , i = 1, . . . , s} ⊆ Ω. The d PU subdomains are circular patches of radius (2.5) (in (2.5) we fix r = 1). After that, we construct the local interpolants and if one of the local fit is negative, we use the procedure described in the next subsection which enables us to construct a positive approximant. Note that, in order to test if the fit is positive, we only evaluate the resulting interpolant on a discrete set of points that therefore should be large enough. Remark 4.2. For implementation purposes, we point out that, to organize the scattered data among the subdomains and to perform the LOOCV, one can use the software package described in Chapter 3. Moreover, to solve the optimization problem arising when a negative fit is observed, the Matlab Optimization Toolbox offers many routines for different kinds of computational issues1 . Finally, we stress that the CSRBF must be applied to the distance matrices (see Subsection 2.1.4) with an accurate choice of the shape parameters, as described in Subsection 4.1.2. 1 The solution of the optimization problem can be computed by using the Matlab routine fmincon.m.
Chapter 4. On the positivity of the PU method
4.2.2
91
Selection of the positive constraints
Here we refer to the Steps 10-12 of the PC-PU Algorithm. Acting as explained in the previous section, we can ensure the positivity of the PU approximant. However, depending on the number of positive constraints, this might lead to a low accuracy. In [283], for a global RBFbased interpolant, h constraints are selected randomly, if fh is the minimum among all values fi , i = 1, . . . , N . This criterion does not guarantee a good accuracy and thus we design an alternative approach enabling us to select a suitable number of positive constraints by means of the LOOCV algorithm. Specifically, given a PU subdomain exhibiting a negative fit, the LOOCV ˆj . scheme is used in order to select a suitable number of constraints N Following this method, the error estimate can be computed as in (3.2). But here, in order to guarantee a positive fit, we deal with an augmented local problem and therefore, as error estimate, we compute �
eˆj1 , . . . , eˆjN
�
=
ˆ
j +Nj
cj1 (Aˆj )−1 11
,...,
cjN
ˆ j +Nj
(Aˆj )−1 ˆ N +N j
, ˆ
j Nj +Nj
where the symmetric matrix Aˆj is defined as
φˆεN
j
··· φε (||xj1 − xj1 ||2 ) .. .. . . j j ˆN +Nˆ ||2 ) · · · (||x1 − x ˆ +N j
j
j
φˆεN φˆεN
ˆjN +Nˆ ||2 ) (||xj1 − x j j .. . . j j ˆN +Nˆ ||2 ) (||ˆ xN +Nˆ − x
ˆ j +Nj
ˆ j +Nj
j
j
j
j
ˆj , we use the Moreover, in order to stress the dependence of the error on N notation �
�
ˆj ) = eˆj , . . . , eˆj e ˆj (N 1 N
ˆ
j +Nj
.
(4.5)
Note that in our case, the coefficients are not determined by directly computing the solution of a linear system, but they are found out by solving (4.3), subject to (4.2). Thus, to be more precise, we should refer to this criterion as LOOCV-like method, but in order to keep common notations, we will go on calling it simply LOOCV. Indeed, we are able to fix a criterion which enables us to select a suitable number of positive constraints. Focusˆj = 1, . . . , Nj . Thus, if ing on the maximum norm, we compute (4.5) for N ˆj positive constraints if on Ωj a negative fit is observed, we add N ˆj )||∞ = ||ˆ ej (N
min
k=1,...,Nj
||ˆ ej (k)||∞ ,
(4.6)
and the fit is positive. It is easy to see that we automatically ensure that the ˆj = Nj . conditions (4.2) are satisfied; in fact they are fulfilled at least for N
Chapter 4. On the positivity of the PU method
92
ˆj added data can be placed randomly within the j-th patch, but The N numerically we observe that selecting well distributed points in Ωj leads to ¯ j and radius δ, a better accuracy. Thus, on the subdomain Ωj of centre x ˆ we consider Nj positive constraints, distributed as the seeds on a sunflower head, i.e. defined as [250, 260] (¯ x1j + uk cos ηk , x ¯2j + uk sin ηk ) ,
(4.7)
ˆj , where k = 1, . . . , N k − 1/2 uk = δ q ˆj − 1/2 N
and
ηk =
4kπ √ . 1+ 5
We conclude this subsection with the illustrative Figure 4.1, devoted to show the particular distribution of the points computed via (4.7). 1
x2
0.75
0.5
0.25
0
0
0.25
0.5
0.75
1
x1
Figure 4.1: An illustrative example of points computed using (4.7) (left) and the sunflower seeds (right).
4.2.3
The positive constrained local computation
Here we refer to the Step 13 of the PC-PU Algorithm. Once the number of positive constraints is chosen via LOOCV, we can compute positive and accurate local fits. Finally, such local RBF approximants are stored into the PC-PU interpolant (4.4) via the PU weights. In [283], the authors propose a global CSRBF constrained method which leads to a considerable decrease in term of accuracy compared to the unconstrained interpolation. This is mainly due to the fact that, even if only a small portion of the fit is negative, the approximant is globally modified by the constraints. On the opposite here, thanks to the local approach, we
Chapter 4. On the positivity of the PU method
93
expect that the PC-PU scheme maintains almost the same accuracy than the unconstrained PU technique. Moreover, we point out that with the global CSRBF constrained method large scattered data sets cannot be handled so efficiently as with the PU method. Furthermore, here we extend the work presented in [283] by considering also globally defined RBFs that, as we will point out, are truly performing. INPUTS: N , number of data; XN = {xi , i = 1, . . . , N } ⊆ Ω, set of data points; FN = {fi , i = 1, . . . , N }, set of data values; dR , number of PU ˆ the subdomains in R; sR , number of evaluation points in R; φ and φ, basis functions; ε, the shape parameter. ˆ ˆ xi ), i = 1, . . . , s}, set of approximated values. OUTPUTS: As = {I(˜ Steps 1-8: Refer to the CSRBF-PU Algorithm (Section 2.1) or to the BLOOCV-PU Algorithm (Section 3.2). Step 9: Solve the unconstrained interpolation problem and a local interpolant Rj is formed as in (1.30). ˆj = 0 and R ˆ j = Rj , Step 10: If the local fit is positive N else ˆj = 1, . . . , Nj , compute the constraints as in (4.7) Step 11: For N and calculate (4.5). ˆj constraints, if N ˆj satisfies (4.6) and (4.2). Consider N Step 12: Solve the constrained approximation problem and form a ˆ j , see (4.1). positive local approximant R Step 13: The interpolant (4.4) is formed by the weighted sum of the local fits.
The PC-PU Algorithm. Routine performing the PC-PU method.
4.3
Complexity analysis
This section is devoted to assess the computational complexity of the PCPU. For a general overview about the costs of the PU method and related searching procedures refer to Chapters 2 and 3. Here we focus on the complexity cost of the optimization procedure. Usually, dealing with this kind of computational issues, the initial problem is transformed into an easier one that can be used as the basis of an iterative process. More precisely, the initial constrained problem is generally computed by means of a sequence of parametrized unconstrained optimization problems, which in the limit converges to the original one. Since these methods are considered relatively inefficient, we use approaches that focus on the solution of the so-called Karush-Kuhn-Tucker (KKT) equations [206].
Chapter 4. On the positivity of the PU method
94
In the implementation of the PC-PU method, if in a given subdomain ˆj positive constraints. The N ˆj Ωj a negative fit is registered, we add N constraints are selected via the LOOCV scheme. Its complexity is analyzed in Subsection 3.3.2. Then, to solve the associate constrained optimization problem, we apply the so-called interior-point or barrier method. It consists in solving a sequence of approximated minimization problems, constructed with the use of slack variables. Specifically, if on Ωj the approximant is negative, ˆj slack variables σ j are introduced and, for each given p > 0, the Nj + N k approximation problem is 1/2 ˆj ˆj Nj +N Nj +N X X 2 j , c − p log σ min i i ˆj , ci ,i=Nj +1,...,Nj +N i=1 i=Nj +1 ˆj σi ,i=1,...,Nj +N
subject to ˆ j (xj ) = f j , R i i −cji
+
σij
xji ∈ XNj ,
= 0,
i = 1, . . . , Nj , ˆj . i = 1, . . . , Nj + N
In particular, solving the KKT equations leads to the computation of a ˆj + 2Nj equations that can be solved via a matrix factorizasystem of 3N tion [34, 35]. Thus, the computation of the optimization problem requires ˆj + 2Nj )3 ) operations. O((3N We point out that, to solve such optimization problem, one can also use techniques belonging to the class of the so-called active-set methods. Usually, even if with these methods the search direction is relatively inexpensive, the interior-point scheme takes a smaller number of steps to converge.
4.4
Numerical experiments
This section is devoted to show, by means of extensive numerical simulations, the performances of the PC-PU approximant. In [283] the authors point out that the global CSRBF constrained method possesses a better approximation behavior than the CMQS approximant [10, 30]. Here, we compare the PC-PU fit with the original Shepard’s method. In fact, for this method the positivity-preserving property holds, while it is lost in the modified quadratic version [139]. Then, comparisons with the global method proposed in [283] and with the classical PU interpolant will be carried out. Obviously, since we perform a PU approximation, large data sets are considered. On the opposite, a global interpolant, such as the one outlined in [283], cannot handle large sets.
Chapter 4. On the positivity of the PU method
95
Experiments are performed considering several sets of random nodes2 (see Appendix A), a grid of subdomain centres as in (2.3) and a grid of sR = 80 × 80 evaluation points on R. Note that here R = L = Ω = [0, 1]2 . In order to test the accuracy of the PC-PU method, we compute the MAE and the RMSE, defined in (2.12) and (2.13), respectively. The errors are computed using as test functions f1 (x1 , x2 ) = (x1 − 0.5)2 + (x2 − 0.4)2 , and f2 (x1 , x2 ) = [3(x2 − 0.4) sin(x1 − 0.5)]2 (x2 + 0.5)1/3 . Experiments are carried out considering the Wendland’s C 2 function ϕ3,1 for the second term in the right-hand side of (4.1). While, for the first term in the right-hand side of (4.1) we use both compactly supported and globally defined RBFs.
4.4.1
Results for compactly supported radial basis functions
Here we test the method using CSRBFs, precisely we consider the Wendland’s C 2 kernel, see (1.24), and we fix its shape parameter ε = 0.1. The results of Table 4.2, carried out with the test function f1 , show a direct comparison between the classical PU interpolant, which leads to a negative fit, and the PC-PU approximant. We can observe that the unconstrained PU method turns out to be more accurate that the PC-PU. In the next subsection we will see that this decrease of the accuracy can be partially overcome with the use of smooth globally defined RBFs. In particular, with the use of CSRBFs large errors are introduced in the region where a negative fit is observed. In order to have a graphical proof, refer to Figure 4.2 in which we consider N = 3500 nodes and the test function f1 . Then, in Table 4.3 we show the errors obtained considering f2 for the CSRBF-based global method proposed in [283] and for the PC-PU approximant. As evident from Figure 4.3, in which we consider N = 3500 random nodes and the test function f2 , the local scheme reaches a better accuracy than the global one.
4.4.2
Results for globally supported radial basis functions
Here we perform the method considering globally defined RBFs. In particular, we take the IMQ C ∞ φ3 function, see (1.22), with shape parameter ε equal to 1. The choice of ε is due to the fact that we compare the use of CSRBFs and RBFs when they give similar results (in terms of accuracy). 2
The random points are generated using the Matlab function rand.m.
Chapter 4. On the positivity of the PU method
96
N
method
MAE
RMSE
300
PU PC-PU
1.50E − 01 1.50E − 01
1.52E − 02 2.03E − 02
1000
PU PC-PU
7.36E − 02 7.96E − 02
3.08E − 03 6.44E − 03
3500
PU PC-PU
6.34E − 02 8.40E − 02
1.47E − 03 2.86E − 03
8000
PU PC-PU
2.43E − 02 5.99E − 02
4.17E − 04 1.03E − 03
Table 4.2: MAEs and RMSEs for f1 computed with the Wendland’s C 2 kernel as local approximant.
Figure 4.2: The false-colored absolute errors computed on 3500 random data and obtained by applying the PU (left) and the PC-PU (right) methods with the Wendland’s C 2 kernel as local approximant for f1 .
With a large number of numerical experiments, we found the above suitable value for ε. Table 4.4 shows the results of the PC-PU fit and of the classical PU method for the test function f1 . From such table and from Figure 4.4, we can observe a better behavior of the PC-PU approximant when globally supported RBFs are used instead of CSRBFs. Roughly speaking, using globally defined RBFs, the errors of the classical PU method and of the PC-PU approach are close to each other. On the opposite, by means of CSRBFs, the PC-PU approximant preserves the positivity property with an error which is about two times the one of the unconstrained interpolant. Finally, in Table 4.5 and in Figure 4.5 we compare the PC-PU method with the Shepard’s approximant. In doing so, we take the test function f2 .
Chapter 4. On the positivity of the PU method
97
N
method
MAE
RMSE
300
CSRBF global PC-PU
3.36E − 01 2.76E − 01
2.77E − 01 1.91E − 02
1000
CSRBF global PC-PU
4.31E − 01 8.84E − 02
2.59E − 02 5.95E − 03
3500
CSRBF global PC-PU
1.16E − 01 8.48E − 02
6.67E − 02 2.61E − 03
Table 4.3: MAEs and RMSEs of the CSRBF-based global method and of the PC-PU approximant computed with the Wendland’s C 2 kernel as local approximant for f2 .
Figure 4.3: The false-colored absolute errors computed on 3500 random data and obtained by applying the PC-PU method with the Wendland’s C 2 kernel as local approximant (left) and the CSRBF-based global method (right) for f2 .
Such table confirms that the PC-PU approach maintains a better accuracy than other existing techniques. Moreover, from Figure 4.5, we can again observe a better behavior of the PC-PU method coupled with C ∞ globally defined RBFs rather than with CSRBFs. This behavior, is also due to the fact that with CSRBFs we need to add more constraints. In particular, if on ˆj constraints, Ωj a negative fit is observed, the PC-PU technique selects N such that the positivity of the local interpolant is ensured. In general, we ˆj is so that note that when globally defined RBFs are used the number N ˆ ˆ Nj � Nj . On the opposite with CSRBFs, Nj is usually closer to Nj . In other words, we need to add more constraints in case of CSRBFs and, as stressed in [283], this causes a decrease of the fit accuracy. To better explain this concept, we can compare the average of points lying on each subdomain NjA , which from our choices we know it is about
Chapter 4. On the positivity of the PU method
98
ˆ A , i.e. the average of points that the PC-PU algorithm needs to 12, with N j add on each subdomain presenting a negative local interpolant. For instance, ˆ A is about 6 and 3 for CSRBFs with 1000 data and the test function f1 , N j and globally defined RBFs, respectively. Similar results also hold for the ˆ A is respectively about 8 and test function f2 . Indeed, with 1000 points N j 5 for compactly and globally supported RBFs. Even if these two averages, as evident, depend on the specific numerical experiment, i.e. on the basis function and related shape parameter, we register an analogous behavior in all the considered cases. Moreover, we can note that, both with the use of CSRBFs and globally defined RBFs there are spikes when the solution approaches zero, i.e. when constraints are used. This cannot be overcome by taking larger supports of the CSRBFs for the added nodes because otherwise a positive fit is not guaranteed, indeed they must be chosen as explained in Section 4.1. N
method
MAE
RMSE
300
PU PC-PU
1.39E − 01 1.39E − 01
1.04E − 02 1.44E − 02
1000
PU PC-PU
7.02E − 02 7.02E − 02
2.88E − 03 3.49E − 03
3500
PU PC-PU
5.89E − 02 5.89E − 02
1.50E − 03 1.66E − 03
8000
PU PC-PU
2.33E − 02 2.33E − 02
3.46E − 04 3.68E − 04
Table 4.4: MAEs and RMSEs for f1 computed with the IMQ C ∞ kernel as local approximant.
4.5
Application to prostate cancer
In this section we investigate an application of the PC-PU approximant with real world data. Specifically, without loss of generality we consider a univariate data set describing the evolution of the relapse of the prostate cancer. It is one of the most common tumor affecting mainly men over sixty years old. Luckily, this disease can be easily diagnosed by the Prostate Specific Antigen (PSA) test and by the digital rectal exam. In the majority of cases, it grows very slowly and it is completely removed by Radical Prostatectomy (RP). However, in case of surgery, about 25% of patients have a relapse in a period which ranges between few months to ten years. Clinical data of prostatectomized patients are available in [125]. They
Chapter 4. On the positivity of the PU method
99
Figure 4.4: The false-colored absolute errors computed on 3500 random data and obtained by applying the PU (left) and the PC-PU (right) methods with the IMQ C ∞ kernel as local approximant for f1 .
N
method
MAE
RMSE
300
Shepard PC-PU
8.38E − 01 1.32E − 01
3.21E − 01 1.48E − 02
1000
Shepard PC-PU
5.71E − 01 8.62E − 02
7.75E − 02 4.31E − 03
3500
Shepard PC-PU
1.87E − 01 2.89E − 02
1.42E − 02 9.73E − 04
Table 4.5: MAEs and RMSEs of the Shepard’s method and of the PC-PU approximant computed with the IMQ C ∞ kernel as local approximant for f2 . are used to investigate the evolution of the relapse by means of mathematical models [40, 143, 248]. To validate such models, i.e. estimating the parameters governing the cancer growth via an optimization method, a data fitting that does not violate biological constraints results therefore essential. In order to understand the problem, let us briefly review several aspects concerning the tumor and the associated mathematical model. Prostate cancer is characterized by a slow growth and, in case of RP, its relapse can be diagnosed in an early stage by the PSA, which turns out to be a reliable biomarker. In fact, only prostate cells produce the PSA and after the surgery there should be no prostate cells in the body. Hence, the PSA value should be very small, close to zero. If its value is larger than 0.2 ng/mL, PSA-producer cells are present, i.e. a relapse (a local or distal metastasis) occurs. However, different growth characteristics of the new tumor are observed.
Chapter 4. On the positivity of the PU method
100
Figure 4.5: The false-colored absolute errors computed on 3500 random data and obtained by applying the PC-PU method with the IMQ C ∞ kernel as local approximant (left) and the Shepard’s method (right) for f2 .
In order to get a better understanding of the phenomenon, an Ordinary Differential Equation (ODE) involving several parameters is considered. Specifically, the so-called phenomenological universalities growth law can be applied to model the tumor dynamics [143]. In the last mentioned paper, the authors show that the tumor follows a universal growth law governed by the physical meaning of the model parameters. In this section, considering challenging real data, we show how we can validate such model with the PC-PU approximant. To model the prostate cancer, we choose the Gompertzian function, characterized by an initial exponential growth, a progressive velocity decrease and finally the achievement of the carrying capacity, due to physical barriers (i.e. organ tissues or membranes) and/or to lack of nutrients. Thus the model reads as follows y(t) = c0 eβt y(t), dt whose solution is c0 βt (e −1) y(t) = y0 e β , (4.8) where c0 is the growth rate and β is somehow inversely proportional to the carrying capacity. Depending on the patients, different values of c0 and β are expected. Thus, we need to approximate such parameters via an optimization method. Because of the high variability of the data set, a stochastic method is particularly advisable. Stochastic methods have been designed by considering analogies with natural phenomena. The most popular are evolution strategy and genetic algorithm, both based on competition among individuals. On the opposite, other methods proposed in the last decades mainly focus on cooperation.
Chapter 4. On the positivity of the PU method
101
Among cooperative methods, Particle Swarm Optimization (PSO) and ant colony are widely used techniques. They are based on the mutual interaction and exchange of information between individuals. Here we focus on PSO. It has been introduced by J. Kennedy (social psychologist) and R.C. Eberhart (electrical engineer) [167] and further developed by other researchers, see e.g. [209, 211, 243, 282]. In what follows, we recall some basic concepts of this method. Given a function g : RD −→ R, the general statement of the problem consists in finding min g(p), p ∈ D ⊆ RD , p
where D is the so-called feasibility region eventually subject to linear or nonlinear constraints. In order to describe the PSO approach, let us consider a group of particles or birds, which are represented as points in the space D. Once we model the way of flying of the flock, taking into account that the target of birds consists in looking for the maximum availability of food, i.e. the minimum of g, we can easily find the minimum of g. Thus, the main objective is to simulate trajectories of all single bird by considering their selfish behavior (which is the ability of a bird of randomly flying away from the flock to reach the food) and the social behavior (which is the ability of a bird of staying in the group). With this simple consideration and taking also into account that particles avoid collisions, it is possible to simulate the way of moving of a group of birds. To explain the idea, let us suppose that a bird discovers some food. Then, if a good trade-off between the two behaviors is reached, other birds can change their directions towards the same place. Acting in this way, the flock changes gradually its direction until the best place is reached. In the PSO method the n particles are randomly initialized in the search(1) space D, with random initial velocities v i . Consequently, the direction of a single particle and its velocity gradually change so that it will start to move in the direction of the best previous position of itself or of other birds, searching in a neighborhood even a better position with respect to the fitness measure g. Specifically, at first we fix the maximum number of iterations Nmax . Then, in order to update velocities and positions of birds, we need to remark that the attributes of a single bird at the j-th iteration are the current (j) (j) position pi , the related velocity v i and the local best position visited by (j) the single bird li , i = 1, . . . , n. At the j-th iteration the best position (k) among all li , i = 1, . . . , n, k = 1, . . . , j, is called global best position b(j) . Thus, we have that [209, 211, 243] (j)
vi
(j−1)
= ω (j) v i
(j) (j)
+ rl ϕl
�
(j−1)
li
(j−1)
− pi
�
(j)
(j) (j)
+ rb ϕb (j)
with i = 1, . . . , n, j = 2, . . . , Nmax , and rl , rb
�
(j−1)
bi
(j−1)
− pi
�
,
randomly fixed. Then,
Chapter 4. On the positivity of the PU method
102
the position of each bird is computed by adding the velocity to its current position, i.e. (j) (j−1) (j) pi = pi + vi . (4.9) Note that (4.9) forces the particle to move towards another position, regardless of any improvement to its fitness. (j) (j) The parameters ϕl and ϕb , involved respectively in the so-called cognitive and social component, are acceleration coefficients and ω (j) is the inertia (j) (j) weight. A common practice is to fix ϕl and ϕb equal at each iteration of the loop. It is equivalent to remove the dependence of ϕl and ϕb on j. While ω (j) is updated as follows ω (j) = ω (j) − (ωmax − ωmin )
�
j
�2
,
Nmax
with ωmax and ωmin between 0 and 1. Equation (4.9) sums up the PSO main features, i.e. the selfish and collective behavior and the interaction with the environment. We remark that the aim consists in finding the best values of c0 and β for which (4.8) accurately fits a given PSA series composed by N data. Therefore, the objective function is g(c0 , β) =
N h X
c0
yi − y0 e β
i (eβti −1) 2
,
i=1
where (ti , yi ), i = 1, . . . , N , are the real PSA data. Such data are highly variable and thus to improve the performance of the PSO method, at first we reconstruct the PSA curve via an interpolation tool. For such scope, one can reconstruct the PSA curve with the standard PU interpolant. But in many cases, the positivity of the PSA values is not preserved through the interpolation process, violating the biological constraint. In order to avoid this drawback, the PC-PU approximant, results particularly meaningful, see Figure 4.6. In this example we consider the Mat´ern C 2 function φ5 , see (1.23), with shape parameter ε = 0.5. Concerning the parameter estimation, we consider 404 patients who relapsed after radical prostatectomy. The estimated parameters turn out to be coherent with respect to their physical meaning and give information about the evolution of the cancer, see [212, 213, 214] for further details.
4.6
Concluding remarks
In this chapter we presented a robust technique devoted to preserve the positivity of the fit via a local RBF-based method. Extensive numerical simulations have been carried out to show the effectiveness of the method.
Chapter 4. On the positivity of the PU method
10
PSA (ng/mL)
20
PSA (ng/mL)
103
15
10
5
8 6 4 2 0
0 0
10
20
30
t (months)
40
50
0
10
20
30
40
50
t (months)
Figure 4.6: Examples of curves fitting PSA values (plotted with blue dots). The classical PU interpolant is plotted in orange and the PC-PU approximant in blue.
Work in progress consists in extending the PC-PU method in higher dimensions. Moreover, we can easily note that in this context CSRBFs are less performing than C ∞ globally defined RBFs. Anyway, we remark that the use of smooth RBFs might lead to problems of ill-conditioning and thus further studies concerning the use of stable local approximants are presented in Chapter 5.
Chapter 5
On the stability of the partition of unity method In this chapter, considering the state of the art [47, 48, 81, 82, 210], we present an approximation technique for the PU method which is extremely effective for interpolating large scattered data sets [44, 46]. In some cases, the local approximants and consequently also the global one may suffer from instability due to ill-conditioning of the interpolation matrices. This depends on both the order of smoothness of the basis function and the node distribution. More specifically, if one keeps the number of nodes fixed and considers smooth basis functions, then the problem of instability becomes evident for small values of the shape parameter. Of course, a basis function with a finite order of smoothness can be used to improve the conditioning, but the accuracy of the fit gets worse. For this reason, the recent research moved towards the study of stable bases (see, for instance, [112, 116, 117]). For particular RBFs, techniques allowing to stably compute the interpolant, also in the flat limit ε −→ 0, have been designed. These algorithms, named RBF-QR methods, are all rooted on a particular decomposition of the kernel and they have been developed so far to treat the Gaussian and the IMQ kernels. Refer to [106, 117, 171] for further details on these methods. More recently, an other approach, namely Hilbert-Schmidt Singular Value Decomposition (HS-SVD) has been developed to stably compute the RBF interpolants [63, 105]. Such technique in principle can be applied to any kernel, provided that the HS eigenvalues and eigenvectors are known. However, these quantities are far from being easy to compute. A more general approach, consisting in computing via a SVD stable bases, namely Weighted SVD (WSVD) bases, is presented in [82]. We remark that, in the cases where the RBF-QR algorithms can be applied, they produce a far more stable solution of the interpolation problem. Nevertheless, the present technique applies to any RBF. 104
Chapter 5. On the stability of the PU method
105
Here, a stable approach via the PU method, named WSVD-PU, which makes use of local WSVD bases and uses compactly supported weight functions, is presented. Thus, following [81], for each PU subdomain a stable RBF basis is computed to solve the local interpolation problem. Consequently, since the local approximation order is preserved for the global fit, the interpolant comes out more stable and accurate. Concerning the stability, we can surely expect a more significant improvement, in the stabilization process, with infinitely smooth functions than with functions characterized by a finite order of regularity. Moreover, in terms of accuracy, the benefits coming from the use of such stable bases are more significant in a local approach than in a global one. Indeed, generally, while in the global case a large number of truncated terms of the SVD must be dropped to preserve stability, a local technique requires only few terms are eliminated, thus enabling the method to be much more accurate. Concerning the computational complexity of the algorithm, for each patch a local RBF problem is solved with the use of a stable basis. The main and truly high cost involved in this step is the computation of the SVD. To avoid this drawback, techniques based on Krylov space methods are performed. More specifically, we consider the Lanczos approach (see e.g. [18, 81, 108]). The chapter is organized as follows. In Section 5.1, we present the WSVD bases. The computational aspects, related to the PU method and to the Lanczos procedure, are illustrated in Section 5.2. A complexity analysis is shown in Section 5.3. In Section 5.4 extensive numerical experiments carried out with both globally and compactly supported RBFs of different orders of smoothness are provided. Then, in Section 5.5, we investigate an application to the solution of elliptic PDEs. Finally, Section 5.6 deals with conclusions and final remarks. Moreover, all the Matlab codes are made available to the scientific community in a downloadable free software package http://hdl.handle.net/2318/1527447.
5.1
Formulation of the weighted SVD partition of unity method
In order to perform a stable computation of the PU interpolant, the main idea consists in stably calculating each local approximant Rj , j = 1, . . . , d, see (1.30). For convenience of the reader, we initially present the use of the stable bases in the general context of global interpolation. Moreover, since the notation introduced here could appear different from the one employed in the previous chapters, we remark that, following the notation introduced in
Chapter 5. On the stability of the PU method
106
Subsection 1.2.3, the global RBF interpolant can be expressed as R(x) =
N X
ck Φ(x, xk ),
x ∈ Ω,
k=1
where Φ : Ω × Ω −→ R is a positive definite and symmetric radial kernel. The interpolation matrix, also so-called kernel matrix is given by (1.14). The so constructed solution R is a function of the native Hilbert space NΦ (Ω) uniquely associated with the kernel, and, if f ∈ NΦ (Ω), it is in particular the NΦ (Ω)-projection of f into the subspace NΦ (XN ) = span{Φ(·, x), x ∈ XN }. We point out that the historical foundation of what we study in this chapter lies in the work of J. Mercer [193] and in the so-called KarhunenLoève expansion (KLE) [166, 176]. Such techniques are also known as Proper Orthogonal Decomposition (POD) in mechanical computation [12], PCA in statistics [21, 161] and SVD in linear algebra [135]. In particular, there is a growing interest towards the POD method (see e.g. [198]); this is due to the fact that it is a very general information compression technique which finds its natural applications in a wide variety of fields, such as in digital image compression, bioinformatics, signal processing and resolution of PDEs (see e.g. [14, 23, 170, 256]).
5.1.1
The weighted SVD basis
Although the RBF-based interpolation method is known to be highly unstable in most cases being the matrix A severely ill-conditioned, it has been proved that the interpolation operator f 7−→ R is stable as an operator in the function space NΦ (Ω) [83]. This gap has been widely recognized to be caused by the use of the standard basis and a lot of efforts have been made in recent years to introduce a better conditioned basis (see [199, 210] for a general theoretical treatment of this topic and [106, 116, 117] for particular instances of stable basis). We are interested here in the use of the WSVD basis introduced in [82], thanks to its flexibility with respect to the choice of the kernel Φ. In what follows, we briefly review some relevant properties of this basis. For the proofs of such properties, refer to [81, 82]. To construct a basis U = {uk }N k=1 of NΦ (XN ) it is enough to assign an invertible coefficient matrix DU of entries (DU )ik = dik , i, k = 1, . . . , N , such that uk (x) =
N X
dik Φ(x, xi ),
i=1
or, equivalently, an invertible value matrix VU of entries (VU )ik = uk (xi ), i, k = 1, . . . , N . The two matrices are related as A = VU DU−1 and in our situation they are defined as follows [82].
Chapter 5. On the stability of the PU method
107
Definition 5.1. A WSVD basis U is a basis for NΦ (XN ) characterized by the matrices DU = where
p
˜ · Q · Σ−1/2 and VU = W p
˜ ·A· W
p
˜ −1 · Q · Σ1/2 , W
p
˜ = Q · Σ · QT , W √ √ ˜ ·A· W ˜ and W ˜ ij = δij w is a SVD of the scaled kernel matrix AW W ˜i ˜ = is a diagonal matrix of positive weights. Note that the definition uses a set of positive weights that was employed to construct the basis in the original formulation. Nevertheless, these weights do not change the numerical behavior of the basis, hence we assume from now on w ˜i = 1/N , i = 1, . . . , N . Moreover, for notational convenience, the diagonal elements of Σ are denoted as σ1 ≥ · · · ≥ σN . This basis has been introduced to mimic in a discrete sense the properties of the eigenbasis that is constructed starting from the operator T : L2 (Ω) −→ L2 (Ω) defined as Z
(T f )(x) =
Φ(x, y)f (y)dy, Ω
through the following theorem (see [193] or also [210, 216, 266]). Theorem 5.1 (Mercer). If the kernel Φ is continuous and positive definite on a bounded set Ω ⊆ RM , the operator T has a countable set of eigenfunctions {ϕk }k∈N and eigenvalues {λk }k∈N . The eigenfunctions are orthonormal in L2 (Ω) and orthogonal in NΦ (Ω) with kϕk k2NΦ (Ω) = λ−1 k . Moreover, the kernel can be expressed in terms of the eigencouples as Φ(x, y) =
X
λk ϕk (x)ϕk (y),
x, y ∈ Ω,
k∈N
where the series converges uniformly and absolutely. √ For its use in interpolation in NΦ (Ω), it is convenient to use the basis { λk ϕk }k∈N , that is normalized in NΦ (Ω). With this normalization, we have the following result. √ Property 5.2. The eigenbasis { λk ϕk }k∈N has the following properties: i. it is NΦ (Ω)-orthonormal, ii. it is L2 (Ω)-orthogonal with squared norm λk , √ √ iii. ( λk ϕk , f )L2 (Ω) = λk ( λk ϕk , f )NΦ (Ω) , ∀f ∈ NΦ (Ω), iv. λk ≥ λk+1 and λk −→ 0 as k −→ ∞,
Chapter 5. On the stability of the PU method v.
P
k∈N λk
108
= φ(0) meas(Ω).
We can then define the discrete form of the inner product in L2 (Ω) as follows. Definition 5.2. The discrete form of the L2 (Ω)-inner product, i.e. `2 (XN ), is given by N X
(f, g)`2 (XN ) =
f (xi )g(xi ),
f, g ∈ NΦ (Ω).
i=1
As proved in [82], the WSVD basis enjoys the same properties when the inner product of L2 (Ω) is replaced with its discrete version `2 (XN ). Property 5.3. The WSVD basis {uk }N k=1 has the following properties: i. it is NΦ (Ω)-orthonormal, ii. it is `2 (XN )-orthogonal with norm σk , iii. (uk , f )`2 (XN ) = σk (uk , f )NΦ (Ω) , ∀f ∈ NΦ (Ω), iv. σ1 ≥ · · · ≥ σN > 0, v.
PN
k=1 σk
= φ(0) meas(Ω).
Since the interpolation is a NΦ (Ω)-projection, we can rewrite the interpolant R in terms of the NΦ (Ω)-orthonormal WSVD basis as R(x) =
N X
(f, uk )NΦ (Ω) uk (x),
k=1
where f ∈ NΦ (Ω). Moreover, thanks to Property 5.3 (point iii.), this can be further rewritten as R(x) =
N X
σk−1 (f, uk )`2 (XN ) uk (x).
k=1
The latter form of the interpolant shows that R is also the solution of the discrete least-squares approximation problem min
g∈NΦ (XN )
||f − g||`2 (XN ) .
If we instead solve the problem over span{u1 , . . . , um }, m ≤ N , we find a solution Rm given by the truncation of the interpolant, i.e. Rm (x) =
m X k=1
σk−1 (f, uk )`2 (XN ) uk (x).
(5.1)
Chapter 5. On the stability of the PU method
109
Therefore, it is equivalent to the use of a low-rank approximation of the matrix A. Moreover, (5.1) allows to overcome the problem of instability by solving a small subproblem of the original one. On the other hand, this method has some disadvantages. First, it is required to compute a SVD of the (possibly large) kernel matrix and at the end only a few elements of the decomposition are used. This is computationally expensive, but in the next subsection we explain how to overcome this problem. Second, this method requires to neglect part of the information to reduce instability, and, in some cases, this removal is too large to obtain a meaningful approximant. A solution to this problem is provided by coupling such technique with a local method. Selecting the first m terms turns out to be really effective since the singular values of the kernel matrix A, provided that it is not severely illconditioned, accumulate to zero very fast. Anyway, the effectiveness of the method, shown in a brief stability analysis in what follows, strictly depends on the particular problem as on the rate of decay of the singular values. m Precisely, let us define the analogous of the power function PΦ,X as N m |f (x) − Rm (x)| ≤ PΦ,X (x)||f ||NΦ(Ω) , N
x ∈ Ω. Then, from the characterization of the approximant we have given in (5.1), the following explicit formula holds i2
h
m PΦ,X (x) N
= φ(0) −
m X
uk (x)2 ,
x ∈ Ω.
k=1
Concerning the stability, we have that [81, 82, 210] m
|R (x)| ≤
m X
!1/2
uk (x)
2
||f ||NΦ(Ω) ≤ φ(0)1/2 ||f ||NΦ(Ω) ,
x ∈ Ω.
k=1
The main disadvantage of the WSVD technique is the computational aspect. Indeed, in order to compute the basis, a SVD needs to be performed and, only after such calculation, we can truncate at the first m terms, leaving out the N −m last terms which are less than or equal to τ , with τ a prescribed tolerance. Thus, in the next subsection, a modified way to compute the WSVD basis is presented [81].
5.1.2
Krylov space methods
The procedure shown in this subsection, used to find the solution of a linear system of the form (1.12), makes use of the Krylov space methods. We remark that here for simplicity we describe the method for global interpolation. However, since we will apply such method coupled with the PU approach, instead of the above mentioned system, we will solve several systems of small sizes, see (1.31).
Chapter 5. On the stability of the PU method
110
Let Km (A, f ) = span{f , Af , . . . , Am−1 f } be the Krylov subspace of order m generated by A and f . The Lanczos method computes an orthonormal basis {pi }m i=1 of Km (A, f ) through a Gram-Schmidt orthonormalization. Letting Pm ∈ RN ×m the matrix having the vectors pi as columns, we can give the following matrix formulation of the algorithm !
APm
¯ m, = Pm+1 H
¯m = H
Hm , ¯ heTm
where Hm is a (m + 1) × m tridiagonal matrix (because of the symmetry of ¯ is a scalar value. the kernel), em ∈ Rm is the unit vector and h The computation of the Lanczos procedure will be pointed out later. We now focus on how we can find a basis by using the Lanczos algorithm. To be precise, once we compute the matrices, the solution of the initial system can ¯ m y = ||f ||2 e1 . be approximated as c = Pm y, where y ∈ Rm is such that H Since A is a good low-rank approximation, an approximate solution can be found with m � N . ¯ m to construct the basis. SpecifThe idea in [81] is to use the matrix H T ¯ ¯ ¯ ically, Hm = Um Σm Vm is a SVD of Hm , with Um ∈ R(m+1)×(m+1) and Vm ∈ Rm×m unitary matrices and !
¯m = Σ
Σm , 0
where the diagonal entries of Σm are the singular values. ¯ m is the zero vector, the decomposition does not Since the last row of Σ change if we remove this row and the last column of Um . Thus, to simplify the notation we denote by Um the matrix without the last column, so that ¯ m = Um Σm VmT . the decomposition becomes H Before moving to the construction of the basis, let us consider the computational tasks concerning the Lanczos procedure [66, 245, 264]. The Lanczos basis {pi }m i=1 , is computed via the following recurrence formula βi+1 pi+1 = Api − αi pi − βi pi−1 , with β1 p0 = 0. The coefficients αi and βi are calculated so as to ensure the orthonormality of the basis. Thus, the tridiagonal matrix
Hm
α1 β 2 . = .. 0
0 is formed [66].
β2 α2 .. .
··· ··· .. .
··· ···
βm−1 0
0 0
βm−1 , αm βm
Chapter 5. On the stability of the PU method
111
In what follows, by virtue of the Lanczos method, we will define an approximate basis which shows similarities with the WSVD basis [81]. However, at first, we stress that it is not a basis; indeed the basis functions do not span NΦ (XN ). Anyway, with abuse of notation, we call again this set of functions a basis. Moreover, as it will become evident, the basis strongly depends on the particular function f ∈ NΦ (Ω). Definition 5.3. The approximate WSVD basis is characterized by the matrices 1/2 DU¯m = Pm · Vm · Σ−1/2 and VU¯m = Pm+1 · Um · Σm . m ¯ m is the Lanczos decomposition of A of order m and where APm = Pm+1 H T ¯ ¯ m. Hm = Um Σm Vm is a SVD of H Property 5.4. The approximate WSVD basis {¯ uk }m k=1 has the following properties: i. it is near NΦ (Ω)-orthonormal, meaning that its NΦ (Ω)-Gramian is the identity matrix plus a rank one matrix, ii. it is `2 (XN )-orthogonal with norm σk , iii. (¯ uk , f )`2 (XN ) = σk (¯ uk , f )NΦ (Ω) if f is the function used to construct the basis, iv. σ1 ≥ · · · ≥ σm > 0, v. it coincides with the WSVD basis if m = N . This basis allows to solve again the least square approximation problem. Namely, if f ∈ NΦ (Ω) is the function used for the Lanczos algorithm, the ¯ m , defined as approximant R ¯ m (x) = R
m X
σk−1 (f, u ¯k )`2 (XN ) u ¯k (x),
k=1
minimizes the distance kf − gk`2 (XN ) for g ∈ span{¯ u1 , . . . , u ¯m }, m ≤ N . m ¯ Moreover, thanks to Property 5.4 (point iii.), R can be written in terms of NΦ (Ω)-inner product as ¯ m (x) = R
m X
(f, u ¯k )NΦ (Ω) u ¯k (x).
(5.2)
k=1
¯ N = RN = R. Moreover, Note that Property 5.4 (point v.) proves that R m ¯ m solves efficiently the approximating R with its fast computable version R problem.
Chapter 5. On the stability of the PU method
112
The fast computation of the WSVD basis can be successfully coupled with the PU techniques. This allows to stably solve large approximation problems. To this aim, for each PU subdomain, following (5.2), we define a local stable approximant of the form mj X
¯ mj (x) = R j
(σkj )−1 (f|Ωj , u ¯jk )`2 (XN ) u ¯jk (x). j
(5.3)
k=1
Consequently, the WSVD-PU approximant assumes the form ¯ I(x) =
d X
¯ mj (x)Wj (x), R j
x ∈ Ω.
(5.4)
j=1
5.2
Computation of the weighted SVD partition of unity method
This section deals with the computation of the WSVD-PU scheme. The steps of such method are displayed in the WSVD-PU Algorithm.
5.2.1
Definition of the weighted SVD partition of unity framework
Here we refer to the Steps 1-8 of the WSVD-PU Algorithm. Given the scattered points XN = {xi , i = 1, . . . , N } ⊆ Ω, we define, as in Section 2.1, the auxiliary structures R and L (see (2.1) and (2.2), respectively). Then, following the strategy defined in Chapter 2, we construct the PU subdomains, i.e. circular patches centred at Cd = √ {¯ xi , j = 1, . . . , d} ⊆ Ω of radius (2.5) (in particular here in (2.5) we fix r = 2). Remark 5.1. The codes of the Matlab software are implemented for Ω = [0, 1]2 . However, any extension is possible and straightforward. Moreover, even if in the free software package we employ the S-PS, we recommend the use of the I-PS, because of its efficiency.
5.2.2
The weighted SVD partition of unity method via the Lanczos procedure
Here we refer to the Steps 9-11 of the WSVD-PU Algorithm. For each PU subdomain, in order to generate the local stable approximation matrix, the Lanczos method is applied to Aj ∈ RNj ×Nj and to the function values f j ∈ RNj , associated to the patch Ωj . In this way, the mamj trix Hmj and the Lanczos basis {pji }i=1 are computed for each patch. Then, for each interpolation problem a local stable basis is formed.
Chapter 5. On the stability of the PU method
113
By using a different stopping criterion in the Lanczos algorithm, with respect to the one employed in [81], we can compute stable bases for a wider family of RBFs, both globally defined and compactly supported. The main problem in the Lanczos procedure concerns the stopping criterion. From Property 5.3 (point v.) a reliable one is mj 1 X j αk < τ, φ(0) − Nj
(5.5)
k=1
for a certain fixed tolerance τ , which is supposed to be equal for all the PU subdomains. We point out that, even if τ is fixed among the subdomains, the left-hand side of (5.5) depends on the specific patch. Moreover, supposing to have a quasi-uniform node distribution, there are no restrictions in selecting the same tolerance for all the subdomains. On the opposite, if the points are more clustered in several subdomains, one can always keep a fixed tolerance, but techniques enabling us to select suitable sizes of the different subdomains are recommended. From Property 5.4 (point v.), the fact that we impose as maximum number of iterations in the Lanczos algorithm exactly the number of nodes in Ωj , i.e. Nj , naturally follows.
5.2.3
The weighted SVD local computation
Here we refer to the Steps 12-13 of the WSVD-PU Algorithm. Once we apply the Lanczos procedure, we are able to compute a local stable approximant which is then plugged in (5.4). This step obviously provides a stable PU approximant. Moreover, by decomposing the initial problem into many small ones, the use of stable bases leads to a larger benefit in terms of accuracy with respect to a global approach. Indeed, if one uses a global method the approximant results stable, but a large number of terms in the Lanczos procedure are neglected. This surely leads to a decrease of the accuracy. Whereas, the local method turns out to be really accurate since, dealing with small problems, less terms in the computation of the basis are eliminated to preserve stability. Remark 5.2. Consistently with Remark 1.2, we expect three kinds of behavior depending on different RBF regularity classes. Specifically, the features of such classes, which differ in terms of stability and accuracy from the standard basis, can be summarized as: i. for C ∞ kernels: improvement of stability and of the optimal accuracy, ii. for C k kernels, with k ≥ 1: improvement of stability and same optimal accuracy, iii. for C 0 kernels: same stability and same optimal accuracy.
Chapter 5. On the stability of the PU method
114
INPUTS: N , number of data; XN = {xi , i = 1, . . . , N } ⊆ Ω, set of data points; FN = {fi , i = 1, . . . , N }, set of data values; dR , number of PU subdomains in R; sR , number of evaluation points in R; φ, the basis function; ε, the shape parameter; τ , a prescribed tolerance. ¯ xi ), i = 1, . . . , s}, set of approximated values. OUTPUTS: A¯s = {I(˜ Steps 1-8: Refer to the CSRBF-PU Algorithm (Section 2.1) or to the BLOOCV-PU Algorithm (Section 3.2). Step 9: Perform Lanczos scheme. Set β1j = 0, pj0 = 0 and pj1 = f j /||f j ||2 . Step 10: For each i, i = 1, . . . , Nj p ˜ji = Aj pji − βi pji−1 , αij = (p ˜ji , pji ), p ˜ji = p ˜ji − αij pji , j βi+1 = ||p ˜ji ||2 . j Step 11: If βi+1 = 0 or |φ(0) −
1 Nj
Pi k=1
αkj | < τ
break pji+1
j =p ˜ji /βi+1 Step 12: The interpolation and evaluation matrices are computed and a stable local approximant is formed as in (5.3).
Step 13: The local fits are accumulated into the global interpolant (5.4).
The WSVD-PU Algorithm. Routine performing the WSVD-PU method.
5.3
Complexity analysis
Here we focus on the costs of the Lanczos procedure, while for the complexity of the partitioning structure and of the construction of the PU interpolant see Chapter 2. Performing the Lanczos procedure on a matrix B ∈ Rn×n requires O(kn2 ), where k is the number of vectors computed by the algorithm, i.e. k is the good low rank approximation (a priori unknown) [66]. Given Aj ∈ RNj ×Nj the interpolation matrix defined on Ωj , the Lanczos method forms the matrix Hmj for Ωj after mj iterations. Usually we have mj � Nj , but in some cases the maximum number of iterations Nj can be reached and so, in a more general setting mj ≤ Nj . This routine requires O(mj Nj2 ) ≤ O(Nj3 ),
(5.6)
time complexity. Thus, for each patch the upper bound for the computational time of the Lanczos procedure is given by the right-hand side of (5.6). In case of sparse matrices, such as the ones arising from the use of CSRBFs, the Lanczos procedure can be performed in O(mj (Nj + n ˜ )), time complexity, where n ˜ is the number of non-zero entries.
Chapter 5. On the stability of the PU method
115
Then, a SVD is applied to the matrix Hmj . We remark that performing a SVD on a matrix B ∈ Rn×k requires O(4n2 k+8nk 2 +9k 3 ) time complexity. The SVD is applied for each patch to the matrix Hmj ; once more we stress that mj � Nj . Thus, for each subdomain the SVD can be performed in O(4m2j mj + 8mj m2j + 9m3j ) ≈ O(m3j ), operations.
5.4
Numerical experiments
This section is devoted to point out, by means of extensive numerical simulations, stability and accuracy of the WSVD-PU interpolant. To this aim, comparisons with the standard PU interpolant are carried out. Experiments are performed considering several sets of Halton nodes (see Appendix A) in the unit square and a grid of sR = 40 × 40 evaluation points on R. In order to show the high stability of the WSVD-PU method, we compute the RMSE, as in (2.13), for different values of the shape parameter ε in the range [10−3 , 102 ]. Moreover, in order to point out the versatility of the WSVD-PU scheme, different kernels with different orders of smoothness are considered. The error (2.13) is computed using as test function the well-known Franke’s function defined in (2.16). Moreover, as tolerance value in (5.5) we set 10−14 .
5.4.1
Results for high-order radial basis functions
In Figure 5.1 we consider high-order RBFs. Specifically, we compare the RMSEs obtained by means of the WSVD-PU interpolant (solid line) with the ones obtained performing the classical PU method (dashed line) using different kernels. From this figure we can note that the use of the WSVD-PU local approach reveals a larger stability than the standard PU interpolant. Moreover, as evident from from Tables 5.2–5.5, the use of a local method enables us to improve the RMSE for the optimal shape parameter in case of flat kernels. This is consistent with Remark 5.2. In particular, this improvement is always registered with infinitely smooth kernels, while with C 6 functions is remarkable only for large data sets.
5.4.2
Results for low-order radial basis functions
In this subsection we test the method with RBFs characterized by a lower regularity. In Figure 5.2 we show the RMSEs obtained via the WSVD-PU interpolant (solid line) and the ones obtained by means of the classical PU
Chapter 5. On the stability of the PU method 6
6
10
10 N = 4225 N = 16641 N = 66049
4
10
2
10
2
10
0
RMSE
RMSE
0
−2
10
−4
10
10
−2
10
−4
10
−6
−6
10
10
−8
−8
10
10
−10
−10
10
−3
10
−2
10
−1
10
0
ε
10
1
10
10
2
10
−3
10
6
−2
10
−1
10
0
ε
10
1
2
10
10
6
10
10
N = 4225 N = 16641 N = 66049
4
10
2
10
N = 4225 N = 16641 N = 66049
4
10
2
10
0
0
10
10
RMSE
RMSE
N = 4225 N = 16641 N = 66049
4
10
10
−2
10
−4
10
−2
10
−4
10
−6
−6
10
10
−8
−8
10
10
−10
10
116
−10
−3
10
−2
10
−1
10
0
ε
10
1
10
2
10
10
−3
10
−2
10
−1
10
0
ε
10
1
10
2
10
Figure 5.1: RMSEs obtained by varying ε for C ∞ and C 6 kernels. The classical PU interpolant is plotted with dashed line and the WSVD-PU approximant with solid line. From left to right top to bottom, we consider the Gaussian C ∞ φ1 , IMQ C ∞ φ3 , Mat´ern C 6 φ7 and Wendland’s C 6 ϕ3,3 kernels (for C ∞ functions see (1.21) and (1.22), while refer to (1.23) and (1.24) for C 6 kernels).
method (dashed line) using different kernels. We can note that, according to Remark 5.2, the WSVD-PU method turns out to be more effective with flat kernels, while for more peaked bases the improvement of using stable bases becomes negligible as the order of bases function decreases. In particular, with C 0 kernels, which are stable for their nature, the WSVD-PU is pointless as stabilization tool. Moreover, for low-order RBFs, we can graphically note that the optimal RMSE is equal for both the WSVD-PU and classical PU methods. Thus, differently from the previous subsection, we here omit to report the tables showing the RMSEs for the optimal shape parameters.
Chapter 5. On the stability of the PU method
117
N
method
RMSE
εopt
4225
PU WSVD-PU
1.16E − 5 6.20E − 7
2.95 2.95
16641
PU WSVD-PU
9.70E − 7 1.25E − 7
3.73 2.95
66049
PU WSVD-PU
1.64E − 7 2.09E − 8
4.71 2.95
Table 5.2: RMSEs for the optimal values of ε computed with the Gaussian C ∞ kernel as local approximant. N
method
RMSE
εopt
4225
PU WSVD-PU
8.20E − 7 5.98E − 7
2.33 1.84
16641
PU WSVD-PU
2.94E − 7 6.78E − 8
2.33 1.84
66049
PU WSVD-PU
1.78E − 7 1.54E − 8
2.94 2.33
Table 5.3: RMSEs for the optimal values of ε computed with the IMQ C ∞ kernel as local approximant. N
method
RMSE
εopt
4225
PU WSVD-PU
9.34E − 7 9.34E − 7
5.96 5.96
16641
PU WSVD-PU
6.18E − 8 6.20E − 8
4.71 4.71
66049
PU WSVD-PU
1.28E − 8 5.10E − 9
7.54 5.96
Table 5.4: RMSEs for the optimal values of ε computed with the Mat´ern C 6 kernel as local approximant.
Chapter 5. On the stability of the PU method
118
N
method
RMSE
εopt
4225
PU WSVD-PU
6.64E − 7 6.64E − 7
0.72 0.72
16641
PU WSVD-PU
6.44E − 8 6.44E − 8
0.57 0.57
66049
PU WSVD-PU
2.03E − 8 5.70E − 9
0.91 0.72
Table 5.5: RMSEs for the optimal values of ε computed with the Wendland’s C 6 kernel as local approximant.
5.5
Application to elliptic partial differential equations
In this section we develop a stable computation of the solution of elliptic boundary value problems via a collocation method. Such approach, which originally consisted of a non-symmetric scheme based on the multiquadric function, has been introduced by E.J. Kansa in [165] (see also [163, 164, 172]). A theoretical analysis of the convergence of this collocation method has been proposed in [175, 226, 227]. Its efficiency has been later improved by considering the relation with Finite Difference (FD) methods. Indeed, the resulting RBF-FD approach takes advantage of forming sparse matrices [114, 244, 277]. Further developments can be found in [64], where the authors propose a RBF solver that has an optimized set of centres chosen through a reduced basis type greedy algorithm. More precisely, we here focus on the stability of a RBF-based PU collocation method [151, 224, 241]. While with a global RBF-based approach the computational cost is prohibitive for large problems, the PU method leads to sparse matrices and thus solves the computational cost issue. Moreover, it allows to study algorithms that enable the local adaptivity. However, for several choices of the shape parameter the solution of an elliptic PDE via PU collocation might be inaccurate. In this case, one can perform wellestablished numerical tools, such as RBF-QR methods [115, 173]. We stress once more that when RBF-QR methods can be employed, they produce a far more stable solution than the WSVD basis. However, the latter properly works for any kernel. Thus, here the aim consists in using the WSVD basis to stably compute approximate solutions of elliptic PDEs. To this scope, let us consider a linear elliptic differential operator L and define the following problem with Dirichlet boundary conditions
Chapter 5. On the stability of the PU method 6
6
10
10
N = 4225 N = 16641 N = 66049
4
10
2
10
2
10
0
RMSE
RMSE
0
−2
10
−4
−6
−2
10
−4
−6
10
10
−8
−8
10
10
−10
−10
10
−3
10
−2
10
−1
10
0
ε
10
1
10
10
2
−3
10
10
6
−2
10
−1
10
0
ε
10
1
2
10
10
6
10
10 N = 4225 N = 16641 N = 66049
4
10
2
10
N = 4225 N = 16641 N = 66049
4
10
2
10
0
0
10
10
RMSE
RMSE
10
10
10
−2
10
−4
10
−6
−2
10
−4
10
−6
10
10
−8
−8
10
10
−10
−10
10
10 −3
10
−2
10
−1
10
0
ε
10
1
2
10
−3
10
10
−2
10
−1
10
0
ε
10
1
10
2
10
6
6
10
10
N = 4225 N = 16641 N = 66049
4
10
2
10
N = 4225 N = 16641 N = 66049
4
10
2
10
0
0
10
RMSE
RMSE
N = 4225 N = 16641 N = 66049
4
10
10
−2
10
−4
10
10
−2
10
−4
10
−6
−6
10
10
−8
−8
10
10
−10
10
119
−10
−3
10
−2
10
−1
10
0
ε
10
1
10
2
10
10
−3
10
−2
10
−1
10
0
ε
10
1
10
2
10
Figure 5.2: RMSEs obtained by varying ε for C 4 , C 2 and C 0 kernels. The classical PU interpolant is plotted with dashed line and the WSVD-PU approximant with solid line. From left to right top to bottom, we consider the Mat´ern C 4 φ6 , Wendland’s C 4 ϕ3,2 , Mat´ern C 2 φ5 , Wendland’s C 2 ϕ3,1 , Mat´ern C 0 φ4 and Wendland’s C 0 ϕ3,0 kernels (see (1.23) and (1.24)).
Chapter 5. On the stability of the PU method
L f (x) = g1 (x), f (x) = g2 (x),
120
for x ∈ Ω,
(5.7)
for x ∈ ∂Ω.
The PDE (5.7) is then discretized on a global set of collocation points. To use a uniform notation, we denote this set by XN = {xi , i = 1, . . . , N } ⊆ Ω. j T Moreover, always to keep common notation, let f j = (f1j , . . . , fN ) be the j vector of local nodal values. Once we suppose that (5.7) admits a solution of the form (1.29), we require that the PDE is satisfied at interior and boundary nodes, i.e. L f (xi ) = f (xi ) =
j=1 L (Wj (xi ) Rj (xi )) Pd j=1 Wj (xi ) Rj (xi )
Pd
= g1 (xi ),
for xi ∈ Ω,
= g2 (xi ),
for xi ∈ ∂Ω.
In what follows, we mainly concentrate on the Poisson problem. In this particular case, the local operator L = −∆ can be expanded to give (see [151]) L (Wj (xi )Rj (xi )) = − ∆Wi (xi )Rj (xi ) − 2∇Wj (xi ) · ∇Rj (xi ) − Wj (xi )∆Rj (xi ). ∇ Furthermore, denoting by A∆ j and Aj the matrices of entries j j (A∆ j )ik = ∆φ(||xi − xk ||),
i, k = 1, . . . , Nj ,
j j (A∇ j )ik = ∇φ(||xi − xk ||),
i, k = 1, . . . , Nj ,
and we have that ∆ −1 ∆f j = A∆ j c j = Aj Aj f j ,
where in the last equality, we use the fact that (refer to (1.31)) cj = A−1 j fj. Furthermore, we set �
�
¯ ∆ = diag ∆Wj (xj ), . . . , ∆Wj (xj ) , W j 1 Nj ¯ ∇ and W ¯ j . Then, we can express the discrete local and similarly we define W j Laplacian operator as �
�
−1 ¯j = W ¯ j∆ Aj + 2W ¯ j∇ · A∇ ¯ ∆ L j + Wj Aj Aj .
(5.8)
Note that since we use the Laplacian operator, we require that the weight functions are at least twice differentiable. Finally, we also include the boundary conditions and we obtain the discrete local PDE operator which is used
Chapter 5. On the stability of the PU method
121
to construct the global matrix L and to compute the associated approximate solution. In particular, we can easily note that we can perform a stable computation of the symmetric matrices appearing in (5.8), i.e. Aj and A∆ j . This is carried out considering the WSVD basis as defined in (5.1). On the opposite, A∇ j is not strictly positive definite and thus we deal with complex eigenvalues. We point out that, even if here we only focus on a stable computation ∇ of Aj and A∆ j , one can eventually factorize Aj via a Schur decomposition [135]. In order to test the method, we consider an elliptic problem on Ω = [0, 1]2 with a manufactured solution f from which we can compute g1 and g2 . In particular [151] f (x1 , x2 ) = sin(x1 + 2x22 ) − sin(2x21 + (x2 − 0.5)2 ). To show the stability of the WSVD-PU method, we compute the RMSE for different values of the shape parameter ε in the range [10−4 , 102 ]. The RMSE for the WSVD-PU method has been calculated by testing the problem with several dropping tolerances. This needs further investigations and is due to the fact that the problem is numerically very sensitive with respect to the tolerance τ . On the opposite for the interpolation case, the use of the Lanczos procedure, which in this context cannot be applied, is less sensitive with respect to τ . In Figure 5.3 we compare the RMSEs obtained by means of the WSVDPU interpolant (solid line) with the ones obtained performing the classical PU method (dashed line) using C ∞ kernels and N equal to 81, 289 and 1089 collocation points (Halton data). Moreover, in Figure 5.4 we plot the solution of the PDE for a critical value of the shape parameter. From this figures we can note that the use of stable bases produces better approximations, but it is not so effective as in interpolation. This is a consequence of the fact that here we directly solve the final collocation system, while in the interpolation context the Lanczos procedure is used to enhance the stability of the computation. In accordance with that, we can see that the use of the stable method for large data sets produces an improvement of the RMSE for the optimal shape parameter that is not truly appreciable. For instance, with the Gaussian kernel and N = 1089 collocation points, the optimal RMSE for the classical PU method is 5.54E − 6, while for the WSVD-PU method it is equal to 3.85E − 6. Of course, in this context, we cannot consider truly large data sets as in the interpolation case; in fact, here we need to solve a system of N × N equations and not several small systems.
Chapter 5. On the stability of the PU method 2
2
10
10
1
1
10
10
0
0
10
RMSE
RMSE
10
−1
10
−2
10
−3
−3
10
10
−4
−4
−4
10
−3
10
−2
10
−1
10
ε
0
10
1
10
10
2
10
8
−1
10
ε
0
10
1
10
2
10
6
10
4
4
10
10
2
RMSE
RMSE
−2
10
8
6
10
0
10
−2
2
10
0
10
−2
10
10
−4
−4
10
10
−6
−6
−4
10
−3
10
−2
10
−1
10
ε
0
10
1
10
10
2
−4
10
10
10
−3
10
−2
10
−1
10
ε
0
10
1
10
2
10
10
10
10
8
8
10
10
6
6
10
10
4
4
10
RMSE
RMSE
−3
10
10
10
2
10
0
10
10
2
10
0
10
−2
−2
10
10
−4
−4
10
10
−6
10
−4
10
10
10
−1
10
−2
10
10
122
−6
−4
10
−3
10
−2
10
−1
10
ε
0
10
1
10
2
10
10
−4
10
−3
10
−2
10
−1
10
ε
0
10
1
10
2
10
Figure 5.3: RMSEs obtained by varying ε for C ∞ kernels. The result of using the classical PU method is plotted with dashed line and the one obtained with the WSVD-PU approach with solid line. From top to bottom, we consider N = 81, 289 and 1089 Halton data. In the left frames, we take the Gaussian C ∞ φ1 function and in the right frames the IMQ C ∞ φ3 kernel.
Chapter 5. On the stability of the PU method
123
Figure 5.4: The approximate solution computed on N = 289 Halton data with ε = 0.0780 and obtained by applying the WSVD-PU (left) and the classical PU (right) methods with the Gaussian C ∞ kernel as local approximant.
5.6
Concluding remarks
In this chapter we presented a stable computation of the PU interpolant. Concerning the trade-off between accuracy and stability, the local approach together with the WSVD basis improves the optimal accuracy of the local fits and at the same time ensures a stable computation. Summing up this investigation to the studies presented in the previous chapters we now have an efficient, accurate, positivity-preserving and stable PU approximant. Thus, we now focus on several applications. Specifically, we concentrate in computational issues concerning population dynamics, namely in the reconstruction of attraction basins (see Chapter 6). This study is then applied to a concrete case in Chapter 7.
Chapter 6
Approximation of attraction basins via PU method We already pointed out that over the last years the topic of numerical approximation of multivariate data has gained popularity in various disciplines, such as numerical solution of PDEs, image registration, neural networks, optimization, statistics, finance and modeling 3D objects (see e.g. [2, 5, 38, 50, 62, 80, 84, 217, 224, 241, 282]). In this chapter we analyze an application in the field of population dynamics. The importance of an investigation in this context follows from the fact that mathematical modeling is still a fruitful research area despite its ancient origins. Specifically, in 1798 T.R. Malthus proposed the first model for the dynamics of a population [179]. His model, based on an exponential growth and therefore fairly unrealistic, has been improved in the late 1830s with the addition of a self-limiting constant by P.F. Verhulst [258, 259]. Anyway, in this discipline the true breakthrough is due to V. Volterra who in the 1920s studied the dynamics of interacting populations [261]. Such model is known as Lotka-Volterra system. This is due to the fact that, about at the same time, A.J. Lotka arrived to similar conclusions [177]. Nowadays, mathematical modeling is commonly applied to major disciplines, such as biology, medicine and social sciences. By these models the prediction of the temporal evolution of the considered quantities, i.e. populations, cancer, divorces, is sought. This is obtained in general via dynamical systems. For comprehensive treatments about the theory of mathematical modeling, see e.g. [7, 29, 91, 200, 273]. Here we present a reliable algorithm for the reconstruction of unknown manifolds partitioning the phase state of M -dimensional dynamical systems (with M = 2 or 3) into disjoint sets [59]. We first illustrate the importance of having such a versatile tool available in applied science. In an initial value problem, involving a set of ordinary differential equations, a particular solution of the system is completely determined by the 124
Chapter 6. Approximation of attraction basins via PU method
125
IC. Depending on the initial state of the system and on conditions involving the model parameters, the trajectories may in fact tend towards different equilibria. Stated formally, in a dynamical system the trajectories from a given IC evolve possibly towards a certain equilibrium. However, note that in what follows we will be more loose and write for short the IC evolves (or stabilizes) towards an equilibrium. The phase state of the dynamical system is thus partitioned into different regions, called the basins of attraction of each equilibrium, depending on where the trajectories originating in them will ultimately stabilize. In such cases, the final outcome of a mathematical model depends on the IC. If it lies in the basin of attraction of a certain equilibrium point, the system will finally settle to this specific steady state. To establish the ultimate system behavior, it is therefore important to assess for each possible attractor its domain of attraction. The manifolds defining the domains of attraction, also so-called separatrix manifolds, are determined locally (by linearization) in well-known cases (see e.g. [91, 200]). Specifically, even if some techniques to prove the existence of invariant sets have already been developed, none of them, except for particular cases, allows to have a graphical representation of the separatrix manifolds [89, 160]. Such techniques are based on results from algebraic topology and thus such methods are not constructive in the sense that they do not give a precise structure and location of the invariant sets. Furthermore, numerical tools based on characterizing in (exponentially) asymptotically autonomous systems a Lyapunov function as a solution of a suitable linear first order PDE have already been developed. Such equation is then approximated using meshless collocation methods [129, 130]. On the opposite, in this chapter, we present a method that allows to reconstruct the basin of attraction of each equilibrium, providing a graphical representation of the separatrix manifold. Moreover, we are not restricted to asymptotically autonomous systems and thus the transformations made in order to use powerful methods, which are well-suited only for autonomous models, are not here necessary. First, a suitable scheme is constructed for the generation of these manifolds. It provides points that, within a certain tolerance, lie on these sought manifolds. This is obtained via a suitable bisection-like routine that employs pairs of points belonging to two different sets of the partition. Then, since an attraction basin can be described by an implicit equation, we interpolate such points with the implicit PU method using local RBF approximants and in particular the Wendland’s functions. Meshless methods have already been used in a similar context to approximate the basins of attraction of periodic orbits [131], or as collocation methods to approximate Lyapunov functions [129, 130]. Even if here we are considering a different problem, the use of a tool independent of the problem geometry and mesh turns out to be essential also in this case.
Chapter 6. Approximation of attraction basins via PU method
126
Finally, observe that this research extends the previous work on the topic [43, 60, 61, 85], providing a more robust and general framework for the three stable equilibria case. As a bonus, the separatrix manifolds in case of bistability can be obtained as a particular case of this algorithm. The outline of the chapter is as follows. Section 6.1 is devoted to the presentation of the designed algorithms for the detection of the points lying on the separatrix manifolds and Section 6.2 contains several numerical results. Finally, in Section 6.3 we deal with conclusions and future work. The Matlab software is made available to the scientific community and can be downloaded at http://hdl.handle.net/2318/1520518.
6.1
Computation of the attraction basins
This section describes the scheme for the reconstruction of the attraction basins. Before going into details, we consider an example devoted to illustrate the goal of such numerical tool. Example 6.1. Let us consider the following model describing a population affected by a disease [152] dP = r(1 − P )(P − u)P − αI, dt (6.1) dI = [−α − d − ru + (σ − 1)P − σI]I, dt where P is the dimensionless total population that is composed of infected individuals I and susceptible individuals P − I. It is easy to verify that E0 = (0, 0), E1 = (1, 0) and E2 = (u, 0) are equilibria of the system (6.1). For the study of the endemic steady states see [152]. As suggested by [152], we set r = 0.2, u = 0.1, d = 0.25 and α = 0.1; furthermore we fix σ = 2.5. With this choice there exists exactly one endemic steady state E4 ≈ (0.9562, 0.0724), which is a stable equilibrium point. Moreover, the origin E0 is also stable. This situation suggests the existence of a manifold (a curve in this case) separating the paths tending to the disease-free equilibrium point from those tending to the endemic steady state. This curve is shown in Figure 6.1. From this consideration, the importance of having a graphical representation of the attraction basins follows. In fact, given an IC, we can suggest measures in order to move the IC into the region of interest.
6.1.1
Definition of the approximation framework
Here we refer to the DETEC-CSRBF-PU Algorithm.
Chapter 6. Approximation of attraction basins via PU method
127
2
I
1.5
1
0.5
0
0
0.5
1
1.5
2
P
Figure 6.1: Approximation of the separatrix curve. The magenta stars represent the stable equilibria E0 and E4 .
We focus on the problem of approximating the domains of attraction in dynamical systems of dimension two or three presenting three stable equilibria. In order to approximate the basins of attraction, when the system admits three stable equilibria, the general idea is to find the points lying on the manifolds determining the domains of attraction and finally to interpolate them with the implicit PU method. At first, we need to consider a set of points as ICs, then we take points in pairs and we proceed with a bisection routine to determine a point lying on a manifold dividing the domains of attraction [60]. The simplest idea, which turns out to be also reliable, consists in considering the set of ICs in [0, γ]M , where γ ∈ R+ and M = 2 or 3. Precisely, we consider equispaced ICs on the boundary of [0, γ]M and a detection routine, which essentially consists in recursively applying a bisection algorithm, is performed considering each couple of opposite points. For instance, if M = 3, we consider grids of points on each face of the cube. In other words, given a point p1 , with the m-th coordinate equal to zero, a bisection-like routine is performed with the point p2 such that p1k = p2k , with k = 1, . . . , M , k 6= m and p2m = γ. The details of this detection algorithm, together with its input parameters, i.e. a prescribed tolerance τ , an integration time t, the model parameters λ and the matrix of equilibria E, will be described in the next subsection. Now, we only need to know that, letting E1 , E2 and E3 the three stable equilibria, this step provides the following sets of points: 0
XN 0 = {x3i3 , i3 = 1, . . . , N3 }, 3
and
0
XN 0 = {x2i2 , i2 = 1, . . . , N2 }, 2
0
XN 0 = {x1i1 , i1 = 1, . . . , N1 }, 1
Chapter 6. Approximation of attraction basins via PU method 0
0
128
0
where N3 , N2 and N1 are the number of points lying on the manifolds delimiting the domain of attraction of E1 and E2 , E1 and E3 , and E2 and E3 , respectively. These sets in pairs, together with the Q equilibria partitioning the phase state, form the sets identifying the domains of attraction, named XN1 , XN2 and XN3 . Remark 6.1. The number of equilibrium points to be interpolated Q depends on the dynamical system. Specifically, in case of two equilibria a saddle point partitions the phase space into two regions, called the basins of attraction of the equilibria. In case of three equilibria, several saddles are involved in the dynamics. However, the three separating manifolds intersect together at only one saddle which corresponds to a point where all the populations are non-negative. Once we find the separatrix points, we can obtain a graphical approximation of the domains of attraction by interpolating them via the PU method. We observe that the attraction basins might be defined by implicit equations. Thus, as described in Section 1.4, we construct the augmented data sets for the implicit interpolation. Specifically, letting K ∈ N3 the vector containing the nearest points used to estimate the normals of the three manifolds, we provide the sets X3N1 , X3N2 , X3N3 and the associated function values F3N1 , F3N2 , F3N3 . Finally, referring to Section 2.1, we interpolate such augmented data sets using the PU method with a CSRBF φ as local basis function, i.e. we apply the CSRBF-PU Algorithm. In this way, we obtain values of the interpolants A1s1 , A2s2 and A3s3 . They approximate the basins of attraction of the first, second and third equilibrium point, respectively. Precisely, each manifold is reconstructed using a suitable number of PU centres and evaluation points, i.e. as inputs of the DETEC-CSRBF-PU Algorithm, we consider two vectors dR and sR , both belonging to N3 . Similarly, ε ∈ R3 . Remark 6.2. For easiness, we refer to the CSRBF-PU Algorithm, extensively studied in Chapter 2. However, we have to point out that in the free Matlab software, we fix R = L = [0, γ]M . Moreover, in order to organize the points into the different subdomains, we use the Matlab package for kdtrees. Of course, the S-PS or the I-PS can be used to improve the efficiency of the algorithm [56, 88]. Finally, one can also obtain a stable computation of the attraction basins (refer to [45] for further details). Summarizing, the procedure used to approximate the attraction basins consists in finding the separatrix points and in interpolating them. Therefore, to complete the description of this method, we now need to point out how the detection routine is performed.
Chapter 6. Approximation of attraction basins via PU method
129
INPUTS: n, number of equispaced points on each edge of [0, γ]M ; γ, edge of the cube; τ , a prescribed tolerance; t, the integration time; λ, the parameters; Q, number of equilibrium points to be interpolated; E the matrix of equilibria; K, the number of nearest neighbors; dR , number of PU subdomains in R; sR , number of evaluation points R; φ, the basis function; ε, the shape parameter. OUTPUTS: XN 0 , XN 0 , XN 0 , the sets of separatrix points; A1s1 , A2s2 , A3s3 , sets of 1
2
3
approximated values. Step 1: Check if the system presents exactly three stable equilibria. Step 2: Definition of the ICs. Step 3: For each pair of opposite ICs p1 and p2 : [x3 , x2 , x1 ] =DETEC(p1 , p2 , t, τ, λ, E), Step 4: If DETEC returns x3 , XN 0 = XN 0 ∪ {x3 }, 3
3
else if returns x2 , XN 0 = XN 0 ∪ {x2 }, 2
2
else if returns x1 , XN 0 = XN 0 ∪ {x1 }. 1
1
Step 5: Define Q as the set composed by the Q equilibria which need to be interpolated. Step 6: Set XN1 = XN 0 ∪ XN 0 ∪ Q, XN2 = XN 0 ∪ XN 0 ∪ Q, XN3 = XN 0 ∪ XN 0 ∪ Q. 2
3
1
3
1
2
Step 7: Compute the augmented data sets X3N1 , X3N2 and X3N3 and the associated function values F3N1 , F3N2 and F3N3 , for the implicit interpolation (using K1 , K2 and K3 nearest neighbors). Step 8: A1s = CSRBF-PU(3N1 , X3N1 , F3N1 , d1R , s1R , φ, ε1 ), A2s = CSRBF-PU(3N2 , X3N2 , F3N2 , d2R , s2R , φ, ε2 ), A3s = CSRBF-PU(3N3 , X3N3 , F3N3 , d3R , s3R , φ, ε3 ), where X3N1 , X3N2 and X3N3 are the augmented data sets found by the detection algorithm and the Q equilibrium points to be interpolated.
The DETEC-CSRBF-PU Algorithm. Routine performing the approximation of the attraction basins.
6.1.2
Detection of points defining the attraction basins
Here we refer to the DETEC Algorithm. Given two ICs p1 and p2 , the detection routine provides a separatix point via a bisection scheme. Specifically, the output is a point, named: i. x3 , if the point lies on the manifold delimiting the domain of attraction of both the first and the second equilibrium point, or ii. x2 , if the point lies on the manifold determining the basin of attraction of both the first and the third equilibrium point, or
Chapter 6. Approximation of attraction basins via PU method
130
iii. x1 , if the point lies on the manifold delimiting the domain of attraction of both the second and the third equilibrium point. This simple concept needs to be properly implemented, indeed many particular cases, depending on the choice of the ICs must be taken into account and the tolerance used to check where an IC stabilizes must be properly selected. To this aim, let us organize the matrix of the equilibria E ∈ Rg×M , where g is the total number of equilibria, as follows: i. from row 1 to row 3: the three stable equilibrium points (E1 , E2 and E3 ), ii. from row 4 to row Q + 3: the equilibrium points to be interpolated by the separating manifolds, iii. from row Q + 4 to row g: remaining equilibria (feasible or unfeasible). As already mentioned, we need to fix the tolerances used to check towards which equilibrium the system stabilizes. Precisely, for the integration of the system we use a Matlab ODE solver1 . Once we chose the model parameters λ ∈ Rl , where l is the number of parameters, the ODE solver integrates the system with a given integration time t. We cannot provide a suitable choice for t; indeed, it depends on the dynamical system. However, the algorithm checks if the integration time is sufficient. At each step, this intrinsic ODE solver estimates the local error ei of the i-th component of the approximate solution y˜i . This error must be less than or equal to an acceptable threshold, which is a function of the specified scalar relative tolerance er and of a vector of absolute tolerances ea [11] |ei | ≤ max(er |˜ yi |, eai ). The value er is a measure of the relative error and the default value is 10−3 . It controls the number of correct digits in all solution components, except those smaller than the threshold ea . The latter determines the accuracy when the solution approaches zero. The default value is 10−6 for each component. Moreover, at each step the local truncation error is computed assuming that the exact solution satisfies the numerical scheme. As a consequence, a good compromise in defining the tolerances σ i , i = 1, . . . , g, consists in fixing ( 10−2 , if |(E)ik | → 0, σik = −1 10 |(E)ik |, otherwise. 1
The integration is carried out with the Matlab ode45.m solver. If the integration problem is stiff, we recommend other Matlab ODE solvers, like ode15s.m, ode23s.m or ode23tb.m.
Chapter 6. Approximation of attraction basins via PU method
131
Obviously, the accuracy of the approximate solution can be improved by changing the default tolerances or by using more accurate numerical techniques, but since we only need to have a criterion to check where an IC stabilizes, such improvement in accuracy is computationally expensive and not needed. After defining the tolerances, we integrate the system and check if the trajectories stabilize to certain equilibria. Note that an IC might coincide with an unstable steady state or lie on a stable submanifold of a saddle point. In this case, to perform the bisection routine, we need some preliminary considerations. Let us assume that the first initial data p1 either overlaps an unstable equilibrium or lies on a stable submanifold of a saddle point. In that case p1 is moved away from it in order to possibly obtain, by the bisection routine, a point lying on a separatrix manifold. Then, let us suppose that from p1 the system stabilizes to E1 ; depending on where the second condition ultimately stabilizes three cases can occur: i. p2 stabilizes to E1 . The routine discards these ICs. ii. p2 stabilizes to E2 . The bisection procedure is performed between p1 and p2 . Specifically, after computing the first midpoint m, the system is integrated with initial data m and then we check where this trajectory converges. If the latter evolves towards the first equilibrium point then we set p1 = m, else we set p2 = m, and we repeat this as long as ||p1 − p2 ||2 > τ , where τ is a prescribed tolerance. Then, the bisection stops and a point named x3 is found. iii. p3 stabilizes to E3 . With the technique described above the routine determines a point named x2 . Similarly, if the two ICs evolve towards the second and third attractor, a point x1 is detected. Summarizing, once we apply the DETEC Algorithm with pairs of ICs, we detect three different sets of points, which in pairs describe the three basins of attraction. Remark 6.3. Observe that we partition the positive cone, because a population dynamics model always involves positive quantities. As a consequence, we choose ICs having all non-negative coordinates, so the unfeasible equilibria are not essential in the matrix E. However, the algorithm, in order to be more robust, takes into account the eventuality of non-admissible steady states. Remark 6.4. The separatrix manifolds in case of bistability can be obtained as a particular case of the DETEC-CSRBF-PU Algorithm. Specifically, the case of two stable steady states can be seen as the case of three attractors, in which two equilibria coincide. Thus, in this case, a stable equilibrium point
Chapter 6. Approximation of attraction basins via PU method
132
INPUTS: p1 , p2 , two ICs, τ , a prescribed tolerance; t, the integration time; λ, the model parameters; E, the matrix of equilibria. OUTPUTS: x3 or x2 or x1 , a separatrix point or a failure message. Step 1: Define σ i , i = 1, . . . , g, to estimate convergence. Step 2: If p1 → Ei and p2 → Ek , i, k ∈ {1, . . . , g}, continue, else display ‘integration time not sufficient’, return. Step 3: If p1 → El or/and p2 → Ep , l and/or p ∈ / {1, 2, 3}, move p1 or/and p2 . If p1 → Ei and p2 → Ek , i, k ∈ {1, 2, 3} and i 6= k, continue, else display ‘bisection cannot be performed’, return. Step 4: If p1 → E1 or p2 → E1 , eventually p1 p2 so that p1 → E1 . Step 5: If p2 → E1 display ‘bisection cannot be performed’, return. else if p2 → E2 , x3 = BISECTION(p1 , p2 , t, τ, λ, E), return x3 , else x2 = BISECTION(p1 , p2 , t, τ, λ, E), return x2 . else if p1 → E2 or p2 → E2 , eventually p1 p2 so that p1 → E2 . Step 6: If p2 → E2 display ‘bisection cannot be performed’, return. else x1 = BISECTION(p1 , p2 , t, τ, λ, E), return x1 , else display ‘bisection cannot be performed’, return.
The DETEC Algorithm. Routine performing the detection scheme.
is repeated in the third row of the matrix of equilibria E, and consequently the matrix has size (g + 1) × M . Obviously, we interpolate only this set of points and therefore ε, dR , K are scalar values.
6.2
Numerical experiments
In this section we summarize the extensive experiments performed to test the detection and approximation techniques. For the dynamical systems in consideration we establish conditions to be imposed on the parameters so that the separatrix manifolds exist. Here, after detecting the points lying on such manifolds, at first we compute the normal vectors and consistently orient them by choosing the nearest neighbors Ki , i = 1, 2, 3. Typically, we set Ki , i = 1, 2, 3, between 5 and 10. Then, we build the augmented data set by marching a small distance ∆ along the normals; following [267], we take ∆ to be 1% of the maximum dimension of the data. Finally, we interpolate the points lying on the separatrix surfaces with the implicit PU method, using as local approximants in (1.29) the compactly supported Wendland’s C 2 function ϕ3,1 , see (1.24). The choices of the inputs described above are suitable assuming to start with 8 ≤ n ≤ 15 equispaced ICs on each edge of [0, γ]M . For the tolerance
Chapter 6. Approximation of attraction basins via PU method
133
used in the bisection routine, a recommended value is 10−3 ≤ τ ≤ 10−5 . This choice allows to achieve a good trade-off between accuracy and computational cost. Moreover, in the numerical experiments we use a grid of 40M evaluation points. After testing the algorithm for 2D dynamical systems in Subsection 6.2.1, we also present several examples for 3D models.
6.2.1
Results for 2D systems
To give an example for a dynamical system of dimension two, we can consider the competition model analyzed in [191]. Let P and Q denote two populations gathering in herds, we consider the following system describing the competition of two different populations within the same environment � � dQ = r 1 − Q Q − q √Q√P , KQ dT
(6.2) �
dP = m 1 − P KP dT
√ √ P − p Q P,
�
where r and m are the growth rates of P and Q, respectively, q and p are the competition rates, KQ and KP are the carrying capacities of the two populations. Since singularities could arise in the Jacobian when one or both populations vanish, we define the following new variables s
X(t) =
Q(T ) , KQ
s
Y (t) =
P (T ) , KP
p
t = T q qKP , 2 KQ (6.3)
q
pK a = qKQ , P
r KQ b= p , q KP
q
c=
m KQ p
q KP
.
Thus the adimensionalized, singularity-free system for (6.2) is dX = b(1 − X 2 )X − Y, dt (6.4) dY = c(1 − Y 2 )Y − aX. dt We can easily verify that the origin E0 = (0, 0) and the points associated with the survival of only one population E1 = (KQ , 0) and E2 = (0, KP ) are equilibria of (6.2). To study the remaining equilibria we consider the adimensionalized system, in fact the coexistence equilibria are the roots of the eighth degree equation cb3 X 8 − 3cb3 X 6 + 3cb3 X 4 − cb(b2 + 1)X 2 − a + cb = 0.
Chapter 6. Approximation of attraction basins via PU method 0
134 0
Observe that we have to take into account that E1 = (1, 0) and E2 = (0, 1), corresponding to E1 = (KQ , 0) and E2 = (0, KP ) of system (6.2), are not critical points of the system (6.4). With the parameters r = 0.7895, m = 0.7885, p = 0.225, q = 0.2085, Kp = 12 and Kq = 10, E1 = (10, 0), E2 = (0, 12) and E3 ≈ (7.0127, 8.9727) are stable equilibria of the system (6.2). Instead of integrating the latter, we consider the model (6.4), whose three stable equilibria are E1∗ ≈ 0 (−1.1342, 1.1237), E2∗ ≈ (1.1342, −1.1237) and E3 ≈ (0.8374, 0.8647), while the origin is the saddle point through which all the three curves go. Note that when the three stable attractors are present there are also other saddles involved in the dynamics, namely E4 ≈ (−0.9585, −0.2692), E5 ≈ (0.9585, 0.2692) and E6 ≈ (0.3055, 0.9575). Observe that, applying the 0 transformations (6.3), obviously E3 corresponds to E3 , while E1∗ and E2∗ are unfeasible, but roughly speaking, they represent E1 and E2 . In fact, the trajectories converging to E1∗ and E2∗ , under the biological constraint X ≥ 0, 0 Y ≥ 0, stop on the axes evolving towards the biological equilibria E1 and 0 0 E2 . Therefore, we consider E1∗ , E2∗ and E3 . To apply the algorithm we need a further consideration. Specifically, we have to translate the problem in the positive plane with the substitutions 0
X =X+
γ 2
and
0
Y =Y +
γ , 2
(6.5)
where γ is the length of the square. At this point we can apply the presented scheme for reconstructing the attraction basins. More precisely, we choose n = 13, γ = 3, τ = 10−4 , t = 40, Q = 1 (E0 ), K = (4, 6, 6), dR = (16, 9, 9) and ε = (0.1, 0.06, 0.08). Figure 6.2 shows how the algorithm works. It generates first the points lying on the curves determining the domains of attraction (top left), then subsequently the basins of attraction of E1∗ (top 0 right), E2∗ (bottom left) and E3 (bottom right), in the original system X and Y . Finally, in Figure 6.3 we plot together the three basins of attraction, always in the original system. Using again the transformation (6.3), we obtain the curves separating the basins of attraction of E1 , E2 and E3 , shown in Figure 6.5 (left). To test the algorithm when bistability occurs, we choose the parameters as follows: r = 0.7895, m = 0.7885, p = 0.225, q = 0.2085, Kp = 12 and Kq = 10. With this choice the equilibria E1 = (10, 0) and E2 = (0, 16.5) are stable, the origin E0 is an unstable equilibrium point and E3 ≈ (3.8757, 3.1919) is the saddle coexistence equilibrium point partitioning the phase space domain of the system (6.2). The stable equilibria of (6.4) are E1∗ ≈ (1.3436, −1.2482), E2∗ ≈ (−1.3436, 1.2482) and the coexis0 tence saddle point is E3 ≈ (0.6717, 0.4252). In view of the above considera0 0 tions, we can identify E1∗ and E2∗ with E1 = (1, 0) and E2 = (0, 1) and, after translating the problem in the positive plane with the substitutions (6.5), we can approximate the separatrix manifold. Precisely, we take n = 15, γ = 4,
1.5
1.5
1
1
0.5
0.5
Y
Y
Chapter 6. Approximation of attraction basins via PU method
0
0
−0.5
−0.5
−1
−1
−1.5 −1.5
−1
−0.5
0
0.5
1
−1.5 −1.5
1.5
−1
−0.5
1.5
1.5
1
1
0.5
0.5
0
−0.5
−1
−1
−0.5
0
0.5
1
1.5
0.5
1
1.5
0
−0.5
−1
0
X
Y
Y
X
−1.5 −1.5
135
0.5
1
1.5
−1.5 −1.5
−1
−0.5
0
X
X
Figure 6.2: Set of points lying on the curves determining the domains of attraction (top left) and the reconstruction of the basin of attraction of E1 (top right), E2 and E3 (bottom, left to right). The four figures (left to right, top to bottom) show the progress of the algorithm: first it generates the points on the separatrices, then in turn each individual basin of attraction. The black triangles and magenta stars represent the origin and the stable equilibria, respectively. Moreover the other saddles (E4 , E5 and E6 ) which, in pairs, lie on the separatrix manifolds of the attraction basins are identified by dark green squares.
0
τ = 10−4 , t = 40, Q = 2 (E0 and E3 ), K = 4, dR = 9 and ε = 0.1. Figure 6.4 shows the separatrix points (left) and the separatrix curve (right) in the phase plane of the system (6.4). Using again the transformation (6.3), we obtain the curve separating the basins of attraction of E1 and E2 , shown in Figure 6.5 (right).
Chapter 6. Approximation of attraction basins via PU method
136
1.5 1
Y
0.5 0 −0.5 −1 −1.5 −1.5
−1
−0.5
0
0.5
1
1.5
X
2
2
1.5
1.5
1
1
0.5
0.5
Y
Y
Figure 6.3: Reconstruction of the basins of attraction with parameters r = 0.7895, m = 0.7885, p = 0.225, q = 0.2085, Kp = 12 and Kq = 10.
0
0
−0.5
−0.5
−1
−1
−1.5
−1.5
−2 −2
−1
0
1
2
X
−2 −2
−1
0
1
2
X
Figure 6.4: Set of points lying on the curve separating the domains of attraction of E1 and E2 (left) and the reconstruction of the separatrix curve (right). The black triangles and magenta stars represent the unstable origin, the coexistence saddle point and the stable equilibria, respectively.
6.2.2
Results for 3D systems
A model chosen to test the method is the standard competition model. Let x, y and z denote three populations, we consider the following system (see
Chapter 6. Approximation of attraction basins via PU method
137
12 16
10
14 12
8
Q
Q
10
6
8 6
4
4
2 0
2
0
2
4
6
8
10
12
0
0
5
10
P
15
P
Figure 6.5: The basin of attraction of E1 , E2 and E3 with parameters r = 0.7895, m = 0.7885, p = 0.225, q = 0.2085, Kp = 12 and Kq = 10 (left), and the curve separating the basin of attraction of E1 , E2 with parameters r = 0.8888, m = 0.602, p = 0.401, q = 0.5998, Kp = 16.5, Kq = 10.
e.g. [140, 145, 200]) dx = p 1 − x �x − axy − bxz, u dt dy = q 1 − y �y − cxy − eyz, v dt
(6.6)
dz = r 1 − z �z − f xz − gyz, w dt where p, q and r are the growth rates of x, y and z, respectively, a, b, c, e, f and g are the competition rates, u, v and w are the carrying capacities of the three populations. The model (6.6) describes the interaction of three competing populations within the same environment. There are eight equilibrium points. The origin E0 = (0, 0, 0) and the points associated with the survival of only one population E1 = (u, 0, 0), E2 = (0, v, 0) and E3 = (0, 0, w). Then, we have the equilibria with two coexisting populations �
uq(av − p) pv(cu − q) cuva − pq , cuva − pq , 0 ,
�
�
E4 = E5 = �
�
ur(bw − p) wp(f u − r) f uwb − rp , 0, f uwb − rp , �
vr(we − q) wq(vg − r) E6 = 0, gvwe − qr , gvwe − qr .
Chapter 6. Approximation of attraction basins via PU method
138
Finally, we have the coexistence equilibrium �
E7 =
u[p(gvwe − qr) − avr(we − q) − bwq(vg − r)] , p(gvwe − qr) + uva(rc − f we) + uwb(f q − gcv) v[q(f uwb − pr) − rcu(wb − p) − pew(f u − r)] , q(f uwb − pr) + cuv(ra − gwb) + evw(gp − af u) � r[(cuva − pq) − gpv(cu − q) − uf q(va − p)] . r(cuva − pq) + bwu(f q − vcg) + evw(gp − f ua)
Letting p = 1, q = 2, r = 2, a = 5, b = 4, c = 3, e = 7, f = 7, g = 10, u = 3, v = 2, w = 1, the points associated with the survival of only one population, i.e. E1 = (3, 0, 0), E2 = (0, 2, 0) and E3 = (0, 0, 1), are stable, the origin E0 = (0, 0, 0) is an unstable equilibrium and the coexistence equilibrium E7 ≈ (0.1899, 0.0270, 0.2005) is a saddle point. The remaining equilibria E4 ≈ (0.6163, 0.1591, 0), E5 ≈ (0.2195, 0, 0.5317) and E6 ≈ (0, 0.1714, 0.2647) are other saddle points. The manifolds joining these saddles partition the phase space into the different basins of attraction, but intersect only at the coexistence saddle point, labelled E7 . In this situation we can use the routine presented here to approximate the basins of attraction. More precisely, we choose n = 15, γ = 6, τ = 10−3 , t = 90, Q = 2 (E0 , E7 ), K = (7, 8, 6), dR = (81, 64, 64) and ε = (0.1, 0.09, 0.08). Figure 6.6 shows the separatrix points and the basins of attraction of E1 , E2 and E3 (left to right, top to bottom). Finally, in Figure 6.7 we plot together the three basins of attraction. With the parameters p = 1, q = 2, r = 2, a = 1, b = 0.4, c = 3, e = 1, f = 3, g = 0.3, u = 1, v = 2, w = 1, the equilibria E1 = (1, 0, 0) and E6 ≈ (0, 1.1765, 0.8235) are stable, the origin is an unstable equilibrium point and the coexistence equilibrium E7 ≈ (0.4019, 0.4673, 0.3271) is a saddle point. The remaining equilbria E2 , E3 , E4 and E5 are unstable or unfeasible steady states. This suggests the existence of a manifold separating the two stable equilibira. The separatrix points and the separatrix surface are shown in Figure 6.8 (left) and (right) respectively (here we take n = 9, γ = 2, τ = 10−3 , t = 30, Q = 2, K = 7, dR = 64 and ε = 0.3). To test in a second case the routine when bistability occurs, we consider the following model dW = −mW + pV W, dt dV = −lV + eSV − hV W + qIV, dt (6.7) dI = βIS − nIV − γI − νI, dt dS = aS 1 − S + I � − cV S − βSI + γI. K dt
Chapter 6. Approximation of attraction basins via PU method
139
Figure 6.6: Set of points lying on the surfaces determining the domains of attraction (top left) and the reconstruction of the basin of attraction of E1 (top right), E2 and E3 (bottom, left to right). The four figures (left to right, top to bottom) show the progress of the algorithm: first it generates the points on the separatrices, then in turn each individual basin of attraction. The black triangles and magenta stars represent the unstable origin, the coexistence saddle point and the stable equilibria, respectively. Moreover the other saddles (E4 , E5 and E6 ) which, in pairs, lie on the separatrix manifolds of the attraction basins are identified by dark green squares.
It describes a three level food web, with a top predator indicated by W , the intermediate population V and the bottom prey N that is affected by an epidemic. Note that N is subdivided into the two subpopulations of susceptible S and infected I [86]. Here, m and l are the mortality rates of W and V respectively, ν is the natural plus disease-related mortality for
Chapter 6. Approximation of attraction basins via PU method
140
Figure 6.7: Reconstruction of the basins of attraction with parameters p = 1, q = 2, r = 2, a = 5, b = 4, c = 3, e = 7, f = 7, g = 10, u = 3, v = 2, w = 1.
Figure 6.8: Set of points lying on the surface separating the domains of attraction of E1 and E6 (left) and the reconstruction of the separatrix surface (right). The black triangles and magenta stars represent the unstable origin, the coexistence saddle point and the stable equilibria, respectively.
the bottom prey, p and h are the predation rates. The disease, spreading by contact at rate β, can be overcome, so that infected return to class S at rate γ. Then, the gain obtained by the intermediate population from hunting of susceptibles is denoted by e, which must clearly be smaller than the damage inflicted to the susceptibles c, i.e. e < c, the corresponding loss rate of infected individuals in the lowest trophic level due to capture by the
Chapter 6. Approximation of attraction basins via PU method
141
intermediate population is n, while q < n denotes the return obtained by V from capturing infected prey. In this lowest trophic level, only the healthy prey reproduce at net rate a, while the prey environment carrying capacity is K. The equilibria are the origin E0 = (0, 0, 0, 0), E1 = (0, 0, 0, K), the disease-free equilibrium with all the trophic levels E2 and the state in which only the intermediate population and the bottom healthy prey thrive E3 �
E2 =
apKe − mecK − apl , m , 0, K ap − cm , ahp p ap �
a(Ke − l) l E3 = 0, . , 0, ecK e �
�
Then, we have the point at which just the bottom prey thrives with endemic disease E4 and two equilibria in which the top predators disappear E5 and E6 � � a(Kβγ + kβν − γ 2 − 2γν − ν 2 ) γ + ν E4 = 0, 0, , β , β(aγaν + Kβν) � � ˆ ˆ E5,6 = 0, β S −nγ − ν , l −qeS , Sˆ , ˜ 2 + BS ˜ + C = 0. where Sˆ are the roots of AS With the parameters values l = 10, e = 2, q = 1, β = 1.6, n = 5, γ = 1, ν = 3, a = 8, K = 6, c = 0.5, the equilibria E3 ≈ (0, 2.6666, 0, 5) and E4 ≈ (0, 0, 1.8421, 2.5) are both stable and E5 ≈ (0, 0.7244, 0.4721, 4.7639) is the saddle point that partitions the domain in the W = 0 three dimensional phase subspace. Thus system (6.7) is reduced to a system of three equations and therefore we can reconstruct the separatrix surface in such subspace. The separatrix points and the separatrix surface are shown in Figure 6.9, left and right respectively (here we fix n = 11, γ = 10, τ = 10−4 , t = 30, Q = 2 (E0 and E5 ), K = 7, dR = 16 and ε = 0.6).
6.3
Concluding remarks
We presented a novel algorithm for the detection of the attraction basins in dynamical systems. It is robust enough to work for dynamical systems presenting two or three stable equilibrium points. Such routine allows to have a graphical representation of the domains of attraction. In many applications, an accurate representation turns out to be very useful (see e.g. [118]). In fact, the knowledge of the state of the system (together with the computation of the attraction basins) allows to eventually suggest measures and strategies to move the IC far away from an unwanted attraction basin. In Chapter 7, we provide a concrete example about how this representation turns out to be meaningful to prevent extinction of species. Work in progress consists in extending this simple but powerful routine in case of dynamical systems presenting periodic orbits. In this case, during
Chapter 6. Approximation of attraction basins via PU method
142
Figure 6.9: Set of points lying on the surface separating the domains of attraction of E3 and E4 (left) and the reconstruction of the separatrix surface (right). The black triangles and magenta stars represent the unstable origin, the saddle point and the stable equilibria, respectively. the bisection routine, a different stopping criterion, which enables us to test if a trajectory follows a cyclic orbit around an equilibrium (not necessarily an orbit of a simple shape as a circle), should be adopted.
Chapter 7
Approximation of attraction basins: A concrete study In this chapter, considering a model that deals with wild herbivores in forests, we present how the algorithm analyzed in the previous chapter for reconstructing the attraction basins can be useful to prevent extinction of species in natural parks (see [223] for further details). The simulations, based on data gathered from contacts with rangers and parks administrators, field samplings and published material, provide useful information on the behavior of the vegetation-wild herbivores interactions and the possible medium-long term evolution of the considered ecosystems. We will see that they are in a very delicate situation, for which the animal populations could become extinguished in case of adverse environmental conditions. The determination of the attraction basins in the parameter space indicates some possible preventive measures to the park administrators. In what follows, the problem of the approximation of the domains of attraction is seen in a different context from Chapter 6. Specifically, here the basins of attraction are determined so that there exist surfaces partitioning the parameter space (and not the phase space) into different regions. This difference is due to the fact that the system here considered does not exhibit bistability, but a transcritical bifurcation occurs. However, from a computational point of view, this difference only implies that the points used for the bisection routine are seen as an initial parameter setting and not as ICs. To motivate the use of the numerical tool enabling us to reconstruct the attraction basins, an extensive study of the model and a sensitivity analysis are carried out. To model the interaction of herbivores with natural resources, following the ideas first presented for the case of urban parks management [251], we consider a three population system with a top predator population, i.e. herbivores, and two prey populations, grass and trees. While in [223] we apply the model for the study of four natural mountain parks in Northern Italy, namely the Dolomiti Bellunesi, the Dolomiti Friu143
Chapter 7. Approximation of attraction basins: A concrete study
144
lane, the Alpi Marittime and the Prealpi Giulie parks, here we only consider the Dolomiti Bellunesi natural park. It is located in the Eastern Alps of NorthEast Italy. The management of wild parks poses difficult questions to the administrators. The mutual relationships that arise between the various animal and vegetation populations living in them constitute a very complex network of interactions. In order to study the evolution in the medium term of the Dolomiti Bellunesi park, we use a previously built model (refer to [251, 252]). In spite of the fact that the first models of this kind were built in order to assess the damages to the vegetation, in particular the trees suffer from overexploitation by the herbivores, the outcome of this investigation points out that, in reality and quite surprisingly, it is the herbivore population that at present is the most endangered one, especially in view of the assumptions made in the modeling process. Indeed, we have deliberately excluded possible further negative effects on the herbivores due to their natural predators. But, introducing the predators will most likely only worsen the present situation. To assess the herbivore population risk of extinction, we carry out a sensitivity analysis on the model parameters. The chapter is organized as follows. In Section 7.1, we introduce the Dolomiti Bellunesi National park and we briefly outline the mathematical model. Section 7.2 is devoted to the sensitivity analysis and to the reconstruction of the attraction basins. Finally, Section 7.3 deals with conclusions and work in progress.
7.1
Dolomiti Bellunesi National park
The Dolomiti Bellunesi National park was established in 1990. It is located in the Veneto Region (NorthEast Italy) in the territory of 15 municipalities, with a surface of about 32000 ha of which 8000 ha of grass and about 19000 ha of forests; in the remaining part there are rivers, lakes, pastures and rocks. About 16000 ha comprise 8 natural reserves belonging to the biogenetic reserve of the Council of Europe. The territory includes medium and high mountain areas with altitudes between 400 m and 2565 m above sea level. There are some protected areas near to the park that contribute to construct a large biogeographic network. The park includes a great environmental variety, allowing many animal species to find suitable living and reproducing conditions. Nowadays, the park harbors about 115 birds species, 20 amphibian and reptile species, about 100 butterfly species and 50 beetle species. In this park there is a relevant herbivore population. Several species are present, among which about 3000 chamois (Rupicapra rupicapra), whose average weight is about 50 Kg, 2000 roe deer (Capreolus capreolus), their average weight being around 25 Kg, 250 mouflons (Ovis aries), with an av-
Chapter 7. Approximation of attraction basins: A concrete study
145
erage weight of 35 Kg and 300 red deer (Cervus elaphus), with an average weight of 200 Kg. In order to study the evolution of this ecosystem, we use the mathematical model already introduced in [251, 252]. Thus, in the next subsection we briefly review the main features of this dynamical system.
7.1.1
The mathematical model
Let H, G and T represent respectively the herbivores, grass and trees populations of the environment in consideration. Apart from the obvious ecological fact that the two types of vegetation are different, in that grass grows fast but has a low carrying capacity for surface unit, while trees grow slowly but they contain a large biomass, the reason for considering trees in this context is due to the phenomenon of debarking, that occurs especially when resources are scarce. In such situation, herbivores searching for alternative food tend to bite off strips of barks from the trees. They thus interrupt the canals that from the roots go up to the leaves to take there the nutrients absorbed from the ground. In this way, they damage the tree by diminishing the chlorophyll production. They can also totally interrupt such production. This in due time leads to the tree death. The model is a classical predator with two prey system [251, 252], in which the resources are consumed following a concave response function, usually called the Beddington-De Angelis function [19, 76]. It has the feature of expressing somewhat the concept of feeding switching [168, 169, 253], for which herbivores, as stated above, turn to the second resource when the main one is scarce. The Beddington-De Angelis function prevents the herbivores from consuming more than the available amount of grass even if their population becomes very large. Moreover, if there is a huge amount of grass, the per capita quantity eaten by the herbivores cannot exceed their per capita maximal consumption α−1 . Similarly, β is the inverse of the maximal consumption of trees by herbivores. Let r1 and r2 denote the grass and trees growth rates and K1 and K2 their respective carrying capacities, µ the metabolic rate of herbivores, c and g the half saturation constants, e ≤ 1 and f ≤ 1 the conversion factors of food into new herbivore biomass and a and b the daily feeding rates due to grass and trees, respectively, the model thus reads as follows HG HT dH = −µH + ae + bf , dt c + H + αG g + H + β T + αG dG = r G 1 − G 1 dt K1
�
dT = r T 1 − T 2 dt K2
�
�
�
−a
−b
HG , c + H + αG
HT . g + H + βT + αG
(7.1)
Chapter 7. Approximation of attraction basins: A concrete study
146
All parameters are non-negative; specifically K1 , K2 , c and g are measured in biomass, e, f , α and β are pure numbers, µ, r1 , r2 , a and b are rates. This model has a few equilibria. Coexistence can only be assessed via numerical simulations, in view of the high nonlinearities appearing in (7.1). The origin is always unstable, preventing ecosystem collapse. Of the remaining possible equilibria, we mention here only the herbivore-free point E3 = (0, K1 , K2 ) and the forest-free equilibrium E4 = (H4 , G4 , 0), because they play a role also in this investigation. In fact, the stability of equilibrium with loss of woods, representing a severe damage for the environment, motivated the earlier investigations [251, 252]. Here we need their feasibility and stability conditions that are given by: i. stability of E3 : ae
K1 K2 + bf < µ, c + αK1 g + αK1 + βK2
ii. feasibility of E4 : G4 >
cµ , ae − µα
(7.2)
(7.3)
iii. stability of E4 : r2 (g + H4 + α G4 ) < H4 .
7.1.2
(7.4)
Parameters estimation and simulations
To estimate the model parameters, we refer to [124, 251, 252]. Specifically, in [124] tables providing estimations of the annual net primary production of several environments are shown. These tables allow to estimate the growth rates of grass and trees, that are about r1 = 0.01 and r2 = 0.0006. In such estimate we take into account that the growth period of grass and trees can be estimated to be about 120 days every year. To set the parameter µ = 0.03 we refer to [252]. It means that an herbivore with no food available dies in about 30 days. This is consistent with similar mammals not accustomed to a lethargic period. The parameter α, i.e. the inverse of the per capita maximal consumption of grass, can be approximated as a percentage of the herbivore itself; this percentage is about 4% − 5.5% [251]. In the following we fix α = 0.05−1 . Even if the parameter β is the analogous of α for trees, its estimation is different. In fact, when an herbivore switches its attention to a tree, it may cause the death of the whole tree, even if it takes a small piece of bark. In [251], in case of sheep, β is estimated to be 1. However, the tree death in case of wild herbivores does not occur with such a high probability as in case of sheep. Indeed, a wild herbivore peels off vertical strips of bark (and not circular strips of barks at the bottom of the tree), as shown in Figure 7.1 (such figure is taken from [252]). This difference implies that
Chapter 7. Approximation of attraction basins: A concrete study
147
the communication between roots and leaves is not totally interrupted. As a consequence, remarking that β is the inverse of the per capita maximal consumption of trees by herbivores, we set β = 8.
Figure 7.1: Debarking due to sheep (left) and wild herbivores (right).
We remark that e and f are the herbivore assimilation coefficients of grass and trees, respectively. Since grass represents the preferred resource and moreover herbivores can survive by eating grass alone, it means that an adequate amount of grass can satisfy the metabolic needs of herbivores, i.e. e � f . Similarly, taking into account the above consideration a � b must hold. In the following we set e = 0.605, f = 0.001, a = 0.98 and b = 0.002 as reference values. In order to estimate the carrying capacities and the half saturation constants, we remark that the biomass unit is given in tons for all the populations; specifically, the hectares for measuring the amount of grass and trees are suitably converted into biomass tons. On the basis of the park data and following [124] for the conversions, we find the carrying capacities and the half saturation constants to be K1 = 3469640.64, K2 = 15695993.39, c = 101862.16 and g = 1001229580.18. Moreover, using the rangers data and the park vegetation distribution, we set the ICs as H(0) = 268.750,
G(0) = 2313093.76 and
T (0) = 1046399.56.
(7.5)
Naturally, these values are approximated and subject to errors. Further investigations about possible perturbations on such values are proposed in [223]. With this setting, simulations show that under undisturbed conditions, the system could reach a stable coexistence equilibrium in about 150 years. See Figure 7.2 for the short range and Figure 7.3 for the medium-long term. Further, the herbivore-free equilibrium E3 is unstable. The left-hand side of (7.2) has indeed the value 0.0302, while the right hand side is µ = 0.03. The equilibrium E4 stating the extinction of the forests is feasible. In fact the right-hand side of (7.3) and the minimum of G4 in two centuries have the
Chapter 7. Approximation of attraction basins: A concrete study
148
values 6.78 × 10⁵ and 1.83 × 10⁶ , respectively. However E4 is never stable since condition (7.4) is not verified. No other equilibrium exists at a stable level with one or more vanishing populations.
H
600 400 200
0
1000
2000
x 10
G
4 3 2
0
1000
2000
x 10
10
3000
t
6
T
3000
t
6
5 0
0
1000
2000
3000
t
Figure 7.2: Dolomiti Bellunesi’s system evolution over ten years with ICs set as in (7.5).
5
H
2
x 10
1 0
0
2
G
4
6 4
x 10
2 0
0
2
2
4
6
t
7
T
4
t
6
x 10
x 10
4
x 10
1 0
0
2
4
t
6 4
x 10
Figure 7.3: Dolomiti Bellunesi’s system evolution over two centuries with ICs set as in (7.5).
To better assess the possible uncertainties in the parameters estimation, a sensitivity analysis is carried out in Section 7.2. A common remark for the subsequent analysis is the fact that the whole ecosystem dynamics is analyzed in the absence of wolves and other predators.
Chapter 7. Approximation of attraction basins: A concrete study
7.2
149
Attraction basins and sensitivity analysis
In this section we perform the sensitivity analysis. It allows to rank the parameters with respect to their influence on the ecosystem. Precisely, we rank them on the basis of the magnitude of the maximum norm, the details being described in Section 7.3. Moreover, the attraction basins are calculated.
7.2.1
Approximation of the attraction basins
A large number of simulations indicates that the parameters most affecting the final configuration of the system are µ, e and α. In particular, the herbivore population level appears to be very sensitive and under the threat of a high risk of extinction. In other words, under possible ecosystem parameter changes, induced for instance by climatic variations or random environmental disturbances, the present situation has some potential risks for an evolution towards an extinction of the herbivore population in the short time span. This is supported by the analysis of the domains of attraction in the parameter space. Specifically, in the three-dimensional parameter space (µ, e, α), Figure 7.4 represents the basins of attraction of the coexistence equilibrium E ∗ and of the herbivore-free equilibrium E3 . The actual value of the population, represented by the dot, is very close to this surface, although at present belonging to the non endangered region. But clearly, changes in the environmental conditions that might lead even to relatively small parameter perturbations may well push it into the region where the herbivores would be doomed.
7.2.2
Perturbations on parameters
We now estimate the influence of the parameters to find those that most affect the herbivore evolution. At first, we determine the sensitivity equations, differentiating the original equations with respect to the parameters of interest (see e.g. [17, 26, 68, 99]). Thus, letting λ the vector of the l parameters, Fi , i = 1, 2, 3, the right-hand sides of equations (7.1) and P = (H, G, T ), the sensitivity system becomes d ∂Pi (λ, t) dt ∂λj �
with ICs
�
=
3 X ∂Fi (P , λ, t) ∂Pk (λ, t) k=1
∂Pk
∂Pi (λ, 0) = 0, ∂λj
∂λj
i = 1, 2, 3,
+
∂Fi (P , λ, t) , ∂λj
j = 1, . . . , l,
j = 1, . . . , l.
The semi-relative solutions, obtained by multiplying the sensitivity solutions by the chosen parameters, are shown in Figure 7.5. They indicate the size of the change in the population state as function of the parameters changes.
Chapter 7. Approximation of attraction basins: A concrete study
150
Figure 7.4: In the parameter space (µ, e, α) we show the surface separating the basins of attraction of the coexistence equilibrium E ∗ , bottom left, from the one of the herbivore-free equilibrium E3 , top right. The dot represents the actual situation. Small parameter variations may push it into the other basin of attraction, thereby entailing the herbivore extinction.
For instance, let us suppose that for the population H we change µ into µ1 ; the semirelative solution is the differential of H with respect to µ1 in the direction µ. This represents a weight allowing the ranking of the parameters with respect to their influence over the model dynamics. In general, the chosen parameter is perturbed by doubling or halving it. When possible we follow such approach. In Figure 7.5 the parameter e is halved, while we set µ = 0.028 and α at its minimum, i.e. α = 18 (4%). These changes have a considerable impact on the herbivores. Even if the influence of all parameters gradually becomes negligible, the large peaks indicate that the system is really sensitive: a smaller µ, as a smaller α, has a positive effect on the herbivore population, while a decrease of e leads to a negative influence on this population, see also Figure 7.4. Since the scales on the vertical axis of Figure 7.5 (top left) are very large for the herbivore population, we zoom in the time interval in which the change of the parameters shows the most significant influence for this population, see Figure 7.5 (bottom right). Moreover, referring again to Figure 7.5 (bottom right), we approximately get the expected percentage change from a parameter perturbation in the time interval in which its influence is largest. Specifically, we can compute the logarithmic sensitivity solutions for Pi = H, G, T , with j = 1, . . . , l ∂ log(Pi (λ, t)) λj ∂Pi (λ, t) = . ∂ log(λj ) Pi (λ, t) ∂λj
(7.6)
Computing (7.6) at the end of the observation period shown in Figure 7.5 (bottom right), we find that the percentage change with respect to µ and
Chapter 7. Approximation of attraction basins: A concrete study 11
x 10 3 0
2000
e(∂H/∂e)
4000
6000
t
x 10 0 −6 0
2000
x 10
6000
0
2000
4000
2000
4000
0 −5
0
2000
4000
5 0
0
2000
4000
µ(∂H/∂µ)
0 2000
4000
6000
e(∂H/∂e)
2 −4 0 4 x 10
2000
4000
6000
0 2000
4000
3
(3799,8313)
0 3300
3400
3500
6000
3600
3700
3800
t
x 10 0
(6999,−9.55E+05) −6 6500
6600
6700
20
6800
6900
7000
t
7
t
6
0
8
x 10
8
t
α(∂H/∂α)
α(∂T/∂α)
e(∂T/∂e)
µ(∂T/∂µ)
4
x 10
0 5 x 10
6000
t
t 15
6000
t
16
6000
6000
t
x 10
x 10
0 0
0
t
7
20
4000
5
8
e(∂G/∂e)
0 8
α(∂H/∂α)
µ(∂G/∂µ)
x 10
α(∂G/∂α)
µ(∂H/∂µ)
8
151
x 10
(2498,6244) 0 2000
t
2100
2200
2300
2400
2500
t
Figure 7.5: Dolomiti Bellunesi’s system. Semi-relative solutions for the population H (top left), G (top right) and T (bottom left) with respect to the parameters µ, e and α. In the bottom right frame we zoom in the time interval where the parameters change has the most significant impact on herbivores.
α is about 14% and 16%, respectively, while the one with respect to e is greater than 100% and it thus leads to the extinction. Now using sensitivity analysis, we rank the parameters with respect to their influence on the populations. To do so, we compare the quantities ∂H(λ, t) , t≥0 ∂λj
max
with j = 1, . . . , l. Roughly speaking, the parameters are sorted by comparing the vertical scales of the sensitivity solutions. The sensitivity analysis on all the parameters, here omitted, is shown in [223] and from such analysis we can surely state that the parameters that most affect the system are µ, e and α, as previously claimed.
Chapter 7. Approximation of attraction basins: A concrete study
7.3
152
Concluding remarks
Qualitatively, the simulations performed in Section 7.1, by estimating the parameters with techniques which are widely used in literature [124, 252], show that the system reaches the coexistence equilibrium point. In the ecosystem there seems no immediate high risk of extinction for the herbivores in the actual situation. This result is substantiated by the analysis of the equilibria. While for coexistence we have to rely only on simulations, for the herbivore-free equilibrium E3 = (0, K1 , K2 ) we have the stability conditions explicitly, see (7.2). As stated in Section 7.1, the equilibrium is not stable. Moreover, we can also exclude any other bistability cases. Excluding bistability situations implies also that the equilibrium with no forests E4 is always unstable. This is consistent with the fact that for the trees, differently from the context of sheep [252], the damage due to wild herbivores is less significant than the one due to sheep. Therefore, from this analysis there seems to be no risk of extinction for herbivores in the present conditions. On the other hand, in Section 7.2 we pointed out that the system is really sensitive with respect to small perturbations of several parameters and such perturbations can instead lead to the extinction. By reconstructing the attraction basins, we can deduce that the system (7.1) is really sensitive with respect to the parameters µ, e and α. Specifically, for small perturbations of such parameters a transcritical bifurcation between the coexistence equilibrium point and the herbivore-free equilibrium occurs. Furthermore, since from the estimation of parameters the current ecosystem state is really close to the separatrix, a small perturbation can drive the ecosystem into the region where herbivore extinction occurs. In order to possibly prevent the ecosystem to fall into the unwanted region, the strategy is therefore to move away from the separatrix surface. Specifically, from a mathematical point of view, a decrease of µ and α, combined with an increase of e, leads to a benefit for the population H. We can try to directly act on µ and α. Recalling that µ is the mortality rate, building safety niches during winter for instance surely leads to a decrease of the herbivore mortality rate. Moreover, by planting grass more nutritious than the existing one and/or by using fertilizers we can try to increase the nutrient assimilation coming from grass, leading to an increase of α−1 . In this way, mathematically speaking, in order to prevent extinction in the (µ, e, α) parameter space, we move away the ecosystem state from the separatrix (see Figure 7.4). Work in progress consists in considering wolves and other predators, as well as possible human intervention, the results might differ somewhat.
Appendices
153
Appendix A
Computation of several sets of data points Here we discuss how to generate particular sets of points, such as Halton, random and non-conformal points.
A.1
Halton points
Halton points are generated starting from the so-called van der Corput sequences (see [147, 275]). They are frequently used in quasi-Monte Carlo methods for multi-dimensional integration applications. In order to construct a van der Corput sequence, we need to observe that every non-negative integer n can be written uniquely using a prime base p, i.e. n=
k X
ai pi ,
i=0
where each coefficient ai is an integer such that 0 ≤ ai < p. We now define a function hp that maps non-negative integers into [0, 1). It is given by k X ai hp (n) = . (A.1) pi+1 i=0 The sequence hp,t = {hp (n), n = 0, . . . , t} generated via (A.1) is known as van der Corput sequence. Then, in order to generate Halton points on [0, 1)M , we take r (usually distinct) primes and use the resulting van der Corput sequences as the coordinates of the M -dimensional Halton points. In other words the set Hr,t = {(hp1 (n), . . . , hpr (n)), n = 0, . . . , t}, is the set of t + 1 Halton points on [0, 1)M . 154
Appendix A. Computation of several sets of data points
155
A useful property of Halton data is the fact that they are nested sets of points. This implies that the data sets can even be constructed sequentially, i.e. one does not need to start over if one wants to add more points to an existing set of Halton points.
A.2
Random points
In order to construct random numbers, we need a computational or physical device designed to generate a sequence of numbers that cannot be reasonably predicted better than by a random chance. In origin, randomness was constructed via physical processes, such as dice, coin flipping and roulette wheels. Such methods are nowadays overcome by computational algorithms. However, the digital computer cannot generate truly random numbers. Thus, random numbers generators always return pseudorandom numbers, which seem to be randomly drawn from some known distribution [128]. To be precise, here we focus on how we can generate pseudorandom numbers to simulate a uniform distribution over the unit interval (0, 1), i.e. the distribution with the probability density function (
p(y) =
1, 0,
for 0 < y < 1, otherwise.
We denote this distribution by U (0, 1). Although the numbers generated via computational methods are only pseudorandom, in the sequel, consistent with existing literature, we use the term random. Usually, to generate random numbers on computers, we first generate random integers over some fixed range. Then, they are scaled into the interval (0, 1). In [174], to construct random numbers, a simple linear congruential generator is presented. It consists of an algorithm that, given a seed y0 , i.e. a starting value so that 0 ≤ y0 < m, yields a sequence of random numbers, calculated via the following recurrence relation yi = (ayi−1 + c)
mod m,
0 ≤ yi < m,
(A.2)
where the multiplier 0 < a < m, the increment 0 ≤ c < m and the modulus m > 0 are integers. Note that the period of (A.2) is at most m and, for some choices of the factor a, much less than that. Often, c in (A.2) is taken to be 0. In this case, the generator yi = ayi−1
mod m,
0 < yi < m,
is called a multiplicative congruential generator. Then, each yi is scaled into the unit interval (0, 1) by division by m, i.e. ui = yi /m.
Appendix A. Computation of several sets of data points
156
The resulting floating-point numbers are uniformly distributed in the unit interval and each one is equally probable in a long run of the sequence. Specifically, since yi−1 = 0 cannot be allowed in a multiplicative generator, its maximum period is m − 1. Depending on the choice of a and m, we have different scenarios. The most common choice, suggested by [208], is to consider a = 75 and m = 231 − 1. Even if this method is still quite employed, most of the recent programs, such as Matlab, use a method known as the Mersenne Twister (MT) algorithm [185]. Precisely, denoting by w a word vector, i.e. a wdimensional vector over the field F = {0, 1}, the MT algorithm generates a sequence of word vectors, which are considered to be uniform random integers between 0 and 2w − 1. Then, dividing by 2w − 1, we obtain real numbers in the unit interval. To explain the algorithm, we denote by wu the upper w − r bits of w, with 0 ≤ r ≤ w − 1. Similarly, wl denotes the lower r bits of w. Then, given w and z two word vectors, we denote by (wu |z l ) the concatenation of the upper w − r bits of w and the lower r bits of z. Furthermore, ⊕ indicates the bitwise addition modulo two. The MT algorithm, given n seeds w0 , . . . , wn−1 , computes wn+k , k = 0, 1, . . ., via the following recurrence formula wn+k = wm+k ⊕ (wuk |wlk+1 )A, where the integer m ranges between 1 and n and A is a w × w matrix with entries in F. Such algorithm, which for particular choices of the above parameters has a huge period of length 219937 − 1, is the one used in this dissertation to generate random values.
A.3
Non-conformal points
In order to generate non-conformal points some technical background is required. Therefore, in what follows, we briefly review the main theoretical aspects concerning Schwarz-Christoffel transformation. The aim consists in constructing a one-to-one analytic function that maps the upper half plane C+ onto a given polygon P . The idea is to use a Schwarz-Christoffel transformation [92, 94]. Definition A.1. A function g is conformal at every point where it is analytic and has non-zero derivative. Let us now fix u1 , . . . , ur , with u1 < · · · < ur ∈ R, and let us consider a function g with derivative g 0 (z) = λ(z − u1 )α1 · · · (z − ur )αr , where −1 < αk < 1, k = 1, . . . , r, and λ ∈ C. Then arg(g 0 (z)) = arg(λ) + α1 arg(z − u1 ) + · · · + αr arg(z − ur ).
Appendix A. Computation of several sets of data points
157
The function g is analytic on the domain C\({u1 + iv/v ≤ 0} ∪ · · · ∪ {ur + iv/v ≤ 0}). Thus, for any z ∈ C+ Z
g(z) =
0
Z
λ(ζ − u1 )α1 · · · (ζ − ur )αr dζ + C. (A.3)
g (ζ)dζ + C = [z0 ,z]
[z0 ,z]
Note that the function (A.3) maps the real line onto a polygonal path. Definition A.2. A function g of the form (A.3) is called a Schwarz-Christoffel transformation. Let us consider a polygon P defined by the complex vertices p1 , . . . , pr , given in counterclockwise order, and the exterior (or interior) turning angles −θ1 π, . . . , −θr π (or (1 − θ1 )π, . . . , (1 − θr )π) associated to each vertex. If some of the complex vertices is infinite then −3 < θk ≤ −1, otherwise −1 < θk ≤ 1 [92]. In both cases we have r X
θk = −2.
k=1
It is a trivial fact in geometry that if we know the vertices p1 , . . . , pr−1 , and angles θ1 , . . . , θr−1 , then the last vertex and angle are uniquely determined. Taking into account the above consideration, the idea is to determine r − 1 real numbers u1 < · · · < ur−1 , named prevertices, to act as preimages of the vertices. Moreover, we assume that ur = ∞ is the preimage of the vertex pr . Theorem A.1. Let S be a simply connected region bounded by a polygon having (possibly infinite) vertices p1 , . . . , pr , and exterior turning angles −θ1 π, . . . , −θr π. Then every function g which maps C+ conformally onto S can be expressed in the form Z
g(z) = A + C
r−1 Y
(ζ − uk )θk dζ,
(A.4)
[z0 ,z] k=1
for some real numbers u1 , . . . , ur−1 , such that u1 < · · · < ur−1 < ur = ∞, and g(u1 ) = p1 , . . . , g(ur−1 ) = pr−1 , g(∞) = pr . Remark A.1. Since g(uk ) = pk , g maps the real line onto P and moreover the image consists of straight-line segments that meet with exterior angle −θk π at each g(uk ), k = 1, . . . , r. But, while the turning angle at g(uk ) matches that at pk in P, for a general set of prevertices the side lengths will be wrong [92].
Appendix A. Computation of several sets of data points
158
It can be proved that a Schwarz-Christoffel transformation can be uniquely determined by three points. More precisely, since ur = ∞, two other prevertices must be fixed and therefore the remaining prevertices and the complex constants A and C are determined uniquely by P . As stressed in [92] the computation of the conformal map is problematic. Indeed, to find the prevertices, a system of non linear equations needs to be solved and in general such system is not analytically solvable. Thus, we refer to the Driscoll’s freely available Matlab toolbox [92]. We now consider a special case of conformal map from the unit disk onto a polygon. Let z in the form z = u + iv be an element of the unit disk D and w = x+iy ∈ E, where E is a generic simply connected domain; our aim is to define a conformal map g. It is an holomorphic function g : z −→ w = g(z), which defines a one-to-one mapping of D onto E. Moreover, we consider a real-valued function G : (u, v) −→ G(u, v) = G(z) on D [150]. To fix the ideas refer to Figure A.1. Definition A.3. Given G as above, the function F defined in E as follows F (w) = G(g −1 (w)) = G(u(x, y), v(x, y)), is called conformal transplant of G under the mapping g.
z G(z) w = g(z) F(w) g D
E
Figure A.1: Conformal map g from a disk to a simply connected domain on a complex plane.
In order to map from several fundamental domains, such as the unit disk, one can compose (A.4) with other standard conformal maps leading to variations of the Schwarz-Christoffel formula. For example, in case of the unit disk, the following theorem holds [92, 150]. Theorem A.2. Let Γ be the interior of a polygon P with vertices p1 , . . . , pr , and exterior turning angles −θ1 π, . . . , −θr π, in counterclockwise order. Then
Appendix A. Computation of several sets of data points
159
every function g which maps D conformally onto Γ can be expressed in the form r Y
Z
g(z) = A + C
(ζ − uk )θk dζ,
[z0 ,z] k=1
for some complex constants A and C, and g(u1 ) = p1 , . . . , g(ur ) = pr . An example of conformal transplantation from the unit disk is shown in Figure A.2. 1
0.8
x2
0.6
0.4
0.2
0
0
0.2
0.4
0.6
0.8
1
x1
Figure A.2: A disk map for a polygonal region. The disk plot is the image of ten evenly spaced circles and radii in the unit disk.
Appendix B
Computation of kd-trees We here briefly review how to solve the problem of partitioning a data set with the use of kd-trees.
B.1
The kd-tree data structure
The basic idea of the kd-trees, first introduced by J.L. Bentley in 1975 [22] and later developed by other researchers (see e.g. [8, 77, 123, 197, 225]), is to hierarchically decompose a data set XN = {xi , i = 1, . . . , N } ⊆ Ω, with Ω ⊆ RM to obtain a relatively small number of subsets such that each subset contains roughly the same number of data points. In particular, the kd-tree data structure is based on a recursive space subdivision into disjoint rectangular regions, called boxes. The two features characterizing a tree are the bucket size and the splitting rule. Specifically the algorithm, until the number of points associated with an arbitrary node is greater than the bucket size, splits the box into two boxes by an axis-orthogonal hyperplane intersecting this box. In this way, each node in the tree is defined by a splitting hyperplane which is perpendicular to one of the coordinate axes. Therefore, the splitting hyperplanes partition at the median the set of points into different subsets, while the two resulting boxes are the cells associated with the two children of the considered node. The routine continues in this way with the two children, using hyperplanes through a different dimension, until log N levels are reached. Thus, each node of the tree is related to a box and to a subset of data points contained in this box, whereas the box containing all the set XN of data points is characterized by the root node of the tree. If the number of points related to the current box is less than or equal to the bucket size, then the resulting node is a leaf and these points are stored with the node. In particular, using the standard splitting rule (see [266]), to obtain the median, we first sort the data set on each coordinate in a preprocessing 160
Appendix B. Computation of kd-trees
161
step. The median is then found out in linear time. With the notation introduced in this dissertation, such step requires a total computational cost of O(M N log N ) time.
B.2
The kd-tree searching procedure
In order to point out how the range search procedure can be performed, we first need to discuss how the splitting rules work. A common approach for kd-tree splitting rules is the one whose splitting dimension is given by the dimension of the maximum spread of the current subset Y of data points in the current box B. Then, the splitting value is the median of the coordinates of Y along this dimension. This splitting principle is known in literature as standard rule. Of course, other rules, such as the cyclic and midpoint splitting principles are possible [266]. However, the kd-tree built with the standard splitting rule has O(log N ) depth, while the others do not guarantee this feature. In particular, the midpoint splitting rule may lead to trivial splits, i.e. splits where one of the child boxes does not contain a point at all. Hence, the depth and size of a tree can be arbitrarily large, even exceeding O(N ). A possible way to overcome this problem is to use the so-called sliding midpoint rule. It cannot produce trivial splits and therefore both depth and size are bounded by O(N ). Let us consider the range query problem in the context of the PU method and let us take a generic patch Ωj , where the index j is fixed. The kdtree search is carried out by checking whether Ωj intersects the box B(v) associated to a node v. We point out that, it is not necessary to compute the associated cell B(v) each time. Indeed, the current cell is maintained through the recursive calls using only the information on the splitting value and the splitting dimension. The fact that the kd-tree, built with the standard splitting rule, has O(log N ) depth enables us to perform a fast searching procedure. Specifically, once the tree is built, such computation can be efficiently solved in O(log N ) time (see [8, 77, 102] for further details).
Conclusions This dissertation provides effective alternative approaches to existing methods for scattered data interpolation and investigates many applications arising in a wide variety of fields, such as in biomathematics. Precisely, the work shows that the PU method allows to overcome the high computational cost associated to the global RBF method and that its efficiency can be improved with the use of ad hoc partitioning structures. Furthermore, it also provides numerical tools that enable us to compute stable and accurate PU approximants, which can also satisfy the positivity property. Moreover, the thesis also furnishes the Matlab codes and thus attempts to bridge the gap between mathematical theory and applications. In fact, it may also be used as a reference by interdisciplinary groups of scientists. Naturally, there are many topics that have been omitted. For instance, several important omissions involve the connection between RBF interpolation with statistical literature and machine learning (see e.g. [105]). There are also no considerations about the potential use of local multilevel stationary schemes (for instance refer to [104, 110]). These kinds of approaches are always used to overcome the trade-off between accuracy and efficiency when CSRBFs are used. Namely, using a non-stationary approach we obtain reliable results but the computational complexity grows. While stationary approximation with CSRBFs is efficient, but saturates. Furthermore, a research direction of current interest is the adaptivity of the PU method which naturally allows a local control and might be useful for both PU interpolation and collocation.
162
References [1] G. Allasia, R. Besenghi, R. Cavoretto, A. De Rossi, Scattered and track data interpolation using an efficient strip searching procedure, Appl. Math. Comput. 217 (2011), pp. 5949–5966. [2] G. Allasia, R. Cavoretto, A. De Rossi, Local interpolation schemes for landmark-based image registration: A comparison, Math. Comput. Simul. 106 (2014), pp. 1–25. [3] D.M. Allen, The relationship between variable selection and data agumentation and a method for prediction, Technometrics 16 (1964), pp. 125–127. [4] G.E. Andrews, R. Askey, R. Roy, Special Functions, Cambridge Univ. Press, Cambridge, 1999. [5] N. Arad, N. Dyn, D. Reisfeld, Y. Yeshurun, Image warping by radial basis functions: Application to facial expressions, CVGIP Graph. Model. Im. 56 (1994), pp. 161–172. [6] N. Aronszajn, Theory of reproducing kernels, Trans. Amer. Math. Soc. 68 (1950), pp. 337–404. [7] D.K. Arrowsmith, C.K. Place, An Introduction to Dynamical Systems, Cambridge Univ. Press, Cambridge, 1990. [8] S. Arya, D.M. Mount, N.S. Netanyahu, R. Silverman, A.Y. Wu, An optimal algorithm for approximate nearest neighbor searching in fixed dimensions, J. ACM 45 (1998), pp. 891–923. [9] M.R. Asim, K.W. Brodlie, Curve drawing subject to positivity and more general constraints, Comput. Graph. 27 (2003), pp. 469–485. [10] M.R. Asim, G. Mustafa, K. Brodlie, Constrained visualization of 2D positive data using modified quadratic Shepard method, in: V. Skala (Ed.), WSCG 2004: The 12-th International Conference in Central Europe on Computer Graphics, Visualization and Computer Vision, vol. 27, 2004, pp. 469–485. 163
References
164
[11] K.E. Atkinson, W. Han, D.E. Stewart, Numerical Solution of Ordinary Differential Equations, John Wiley & Sons, Inc., Hoboken, 2009. [12] M. Azaïez, F. Ben Belgacem, T. Chacón Rebollo, Recursive POD expansion for reaction-diffusion equation, Adv. Mod. Simul. Eng. Sci. 3 (2016), pp. 1–22. [13] I. Babuˇska, J.M. Melenk, The partition of unity method, Int. J. Numer. Meth. Eng. 40 (1997), pp. 727–758. [14] M. Balajewicz, A New Approach to Model Order Reduction of the Navier-Stokes Equations, Ph.D. Thesis, Duke University, Durham, 2012. [15] K. Ball, Eigenvalues of Euclidean distance matrices, J. Approx. Theory 68 (1992), pp. 74–82. [16] K. Ball, N. Sivakumar, J.D. Ward, On the sensitivity of radial basis interpolation to minimal data separation distance, Constr. Approx. 8 (1992), pp. 401–426. [17] H.T. Banks, D.M. Bortz, A parameter sensitivity methodology in the context of HIV delay equation models, J. Math. Biol. 50 (2004), pp. 607–625. [18] R.K. Beatson, J.B. Cherrie, C.T. Mouat, Fast fitting of radial basis functions: Methods based on preconditioned GMRES iteration, Adv. Comput. Math. 11 (1999), pp. 253–270. [19] J. Beddington, Mutual interference between parasites or predators and its effect on searching efficiency, J. Anim. Ecol. 51 (1975), pp. 331–340. [20] M. Behzad, G. Chartrand, L. Lesniak-Foster, Graphs and Digraphs, Prindle, Weber and Schmidt, Boston, 1979. [21] D. Belton, Improving and extending the information on principal component analysis for local neighborhoods in 3D point clouds, in: C. Jun et al. (Eds.), The International Archives of the Photogrammetry, Remote Sensing and Spatial Information Sciences-Part B5, vol. 37, 2008, pp. 477–484. [22] J.L. Bentley, Multidimensional binary search trees used for associative searching, Commun. ACM 18 (1975), pp. 509–517. [23] G. Berkooz, P. Holmes, J.L. Lumley, The proper orthogonal decomposition in the analysis of turbulent flows, Annu. Rev. Fluid Mech. 25 (1993), pp. 539–575.
References
165
[24] S. Bochner, Monotone Funktionen, Stieltjes Integrale und harmonische Analyse, Math. Ann. 108 (1933), pp. 378–410. [25] S. Bochner, Vorlesungen u ¨ber Fouriersche Integrale, Akademische Verlagsgesellschaft, Leipzig, 1932. [26] D.M. Bortz, P.W. Nelson, Sensitivity analysis of a nonlinear lumped parameter model of HIV infection dynamics, Bull. Math. Biol. 66 (2004), pp. 1009–1026. [27] J.M. Borwein, A.S. Lewis, Convex Analysis and Nonlinear Optimization: Theory and Examples, Springer-Verlag, New York, 2000. [28] M. Bozzini, L. Lenarduzzi, M. Rossini, Polyharmonic splines: An approximation method for noisy scattered data of extra-large size, Appl. Math. Comput. 216 (2010), pp. 317–331. [29] F. Brauer, C. Castillo-Chavez, Mathematical Models in Population Biology and Epidemiology, Springer-Verlag, New York, 2001. [30] K.W. Brodlie, M.R. Asim, K. Unsworth, Constrained visualization using the Shepard interpolation family, Comput. Graph. Forum 24 (2005), pp. 809–820. [31] M.D. Buhmann, Radial Basis Functions: Theory and Implementation, Cambridge Monogr. Appl. Comput. Math., vol. 12, Cambridge Univ. Press, Cambridge, 2003. [32] M.D. Buhmann, New developments in the theory of radial basis function interpolation, in: K. Jetter et al. (Eds.), Multivariate Approximation: from CAGD to Wavelets, World Scientific, Singapore, 1993, pp. 35–75. [33] S. Butt, K.W. Brodlie, Preserving positivity using piecewise cubic interpolation, Comput. Graph. 17 (1993), pp. 55–64. [34] R.H. Byrd, J.C. Gilbert, J. Nocedal, A trust region method based on interior point techniques for nonlinear programming, Math. Program. 89 (2000), pp. 149–185. [35] R.H. Byrd, M.E. Hribar, J. Nocedal, An interior point algorithm for large-scale nonlinear programming, SIAM J. Optimiz. 9 (1999), pp. 877–900. [36] R.E. Carlson, T.A. Foley, Interpolation of track data with radial basis methods, Comput. Math. Appl. 12 (1992), pp. 27–34. [37] R.E. Carlson, B.K. Natarajan, Sparse approximate multiquadric interpolation, Comput. Math. Appl. 27 (1994), pp. 99–108.
References
166
[38] J.C. Carr, R.K. Beatson, J.B. Cherrie, T.J. Mitchell, W.R. Fright, B.C. Mccallum, T.R. Evans, Reconstruction and representation of 3D objects with radial basis functions, in: Proceedings of the 28-th Annual Conference on Computer Graphics and Interactive Techniques, ACM press, New York, 2001, pp. 67–76. [39] J.C. Carr, W.R. Fright, R.K. Beatson, Surface interpolation with radial basis functions for medical imaging, IEEE Trans. Med. Imaging 16 (1997), pp. 96–107. [40] P. Castorina, P.P. Delsanto, C. Guiot, A classification scheme for phenomenological universalities in growth problems in physics and other sciences, Phys. Rev. Lett. 97 (1996), pp. 1–4. [41] R. Cavoretto, A numerical algorithm for multidimensional modeling of scattered data points, Comput. Appl. Math. 34 (2015), pp. 65–80. [42] R. Cavoretto, Meshfree Approximation Methods, Algorithms and Applications, Ph.D. Thesis, University of Torino, Torino, 2010. [43] R. Cavoretto, S. Chaudhuri, A. De Rossi, E. Menduni, F. Moretti, M. Rodi, E. Venturino, Approximation of dynamical system’s separatrix curves, in: T.E. Simos et al. (Eds.), Proceedings of the International Conference of Numerical Analysis and Applied Mathematics, AIP Conference Proceedings, Melville, vol. 1389, 2011, pp. 1220–1223. [44] R. Cavoretto, S. De Marchi, A. De Rossi, E. Perracchione, G. Santin, Partition of unity interpolation using stable kernel-based techniques, to appear on Appl. Numer. Math. (2016). [45] R. Cavoretto, S. De Marchi, A. De Rossi, E. Perracchione, G. Santin, Approximating basins of attraction for dynamical systems via stable radial bases, in: T.E. Simos et al. (Eds.), Proceedings of the International Conference of Numerical Analysis and Applied Mathematics, AIP Conference Proceedings, Melville, vol. 1738, 2016, pp. 390003-1–390003-4. [46] R. Cavoretto, S. De Marchi, A. De Rossi, E. Perracchione, G. Santin, RBF approximation of large datasets by partition of unity and local stabilization, in: I.P. Hamilton et al. (Eds.), Proceedings of the International Conference on Computational and Mathematical Methods in Science and Engineering, 2015, pp. 317–326. [47] R. Cavoretto, A. De Rossi, A trivariate interpolation algorithm using a cube-partition searching procedure, SIAM J. Sci. Comput. 37 (2015), pp. A1891–A1908.
References
167
[48] R. Cavoretto, A. De Rossi, A meshless interpolation algorithm using a cell-based searching procedure, Comput. Appl. Math. 67 (2014), pp. 1024–1038. [49] R. Cavoretto, A. De Rossi, Achieving accuracy and efficiency in spherical modelling of real data, Math. Method. Appl. Sci. 37 (2014), pp. 1449–1459. [50] R. Cavoretto, A. De Rossi, Analysis of compactly supported transformations for landmark-based image registration, Appl. Math. Inf. Sci. 7 (2013), pp. 2113–2121. [51] R. Cavoretto, A. De Rossi, Spherical interpolation using the partition of unity method: An efficient and flexible algorithm, Appl. Math. Lett. 25 (2012), pp. 1251–1256. [52] R. Cavoretto, A. De Rossi, Fast and accurate interpolation of large scattered data sets on the sphere, J. Comput. Appl. Math. 234 (2010), pp. 1505–1521. [53] R. Cavoretto, A. De Rossi, E. Perracchione, Optimal selection of local approximants in RBF-PU interpolation, to appear on J. Sci. Comput. (2017). [54] R. Cavoretto, A. De Rossi, E. Perracchione, RBF-PU interpolation with variable subdomain sizes and shape parameters, in: T.E. Simos et al. (Eds.), Proceedings of the International Conference and Summer School Numerical Computations: Theory and Algorithms, AIP Conference Proceedings, Melville, vol. 1776, 2016, pp. 070003-1– 070003-4. [55] R. Cavoretto, A. De Rossi, E. Perracchione, Efficient computation of partition of unity interpolants through a block-based searching technique, Comput. Math. Appl. 71 (2016), pp. 2568–2584. [56] R. Cavoretto, A. De Rossi, E. Perracchione, Fast and flexible interpolation via PUM with applications in population dynamics, in: T.E. Simos et al. (Eds.), Proceedings of the International Conference of Numerical Analysis and Applied Mathematics, AIP Conference Proceedings, Melville, vol. 1738, 2016, pp. 390005-1–390005-4. [57] R. Cavoretto, A. De Rossi, E. Perracchione, Partition of unity interpolation on multivariate convex domains, Int. J. Model. Simul. Sci. Comput. 6 (2015), pp. 1550034-1–1550034-17. [58] R. Cavoretto, A. De Rossi, E. Perracchione, E. Venturino, Graphical representation of separatrices of attraction basins in two and
References
168
three dimensional dynamical systems, Int. J. Comput. Meth. 14 (2017), pp. 1750008-1–1750008-16. [59] R. Cavoretto, A. De Rossi, E. Perracchione, E. Venturino, Robust approximation algorithms for the detection of attraction basins in dynamical systems, J. Sci. Comput. 68 (2015), pp. 395–415. [60] R. Cavoretto, A. De Rossi, E. Perracchione, E. Venturino, Reliable approximation of separatrix manifolds in competition models with safety niches, Int. J. Comput. Math. 92 (2015), pp. 1826–1837. [61] R. Cavoretto, A. De Rossi, E. Perracchione, E. Venturino, Reconstruction of separatrix curves and surfaces in squirrels competition models with niche, in: I.P. Hamilton et al. (Eds.), Proceedings of the International Conference on Computational and Mathematical Methods in Science and Engineering, vol. 2, 2013, pp. 400–411. [62] R. Cavoretto, A. De Rossi, H. Qiao, B. Quatember, W. Recheis, M. Mayr, Computing topology preservation of RBF transformations for Landmark-based image registration, in: J. Boissonnat et al. (Eds.), Curves and Surfaces, Lecture Notes in Computer Science, Springer International Publishing Switzerland, Cham, vol. 9213, 2015, pp. 96–108. [63] R. Cavoretto, G.E. Fasshauer, M. McCourt, An introduction to the Hilbert-Schmidt SVD using iterated Brownian bridge kernels, Numer. Algorithms 68 (2015), pp. 393–422. [64] Y. Chen, S. Gottlieb, A. Heryudono, A. Narayan, A reduced radial basis function method for partial differential equations on irregular domains, J. Sci. Comput. 66 (2015), pp. 67–90. [65] Y.L. Chen, S.H. Lai, A partition of unity based algorithm for implicit surface reconstruction using belief propagation, in: IEEE International Conference on Shape Modeling and Applications 2007, IEEE Press, Los Alamitos, 2007, pp. 147–155. [66] J. Chen, Y. Saad, Lanczos vectors versus singular vectors for effective dimension reduction, IEEE Trans. Knowl. Data Eng. 21 (2009), pp. 1091–1103. [67] E.W. Cheney, W. Light, A Course in Approximation Theory, Brooks Cole, Pacific Grove, 1999. [68] V. Comincioli, Metodi Numerici e Statistici per le Scienze Applicate, Pavia Univ. Press, Pavia, 2004.
References
169
[69] I.K. Crain, B.K. Bhattacharyya, Treatment of non-equispaced twodimensional data with a digital computer, Geoexploration 5 (1967), pp. 173–194. [70] S. Cuomo, A. Galletti, G. Giunta, A. Starace, Surface reconstruction from scattered point via RBF interpolation on GPU, in: M. Ganzha et al. (Eds.), 2013 Federated Conference on Computer Science and Information Systems, IEEE Press, Los Alamitos, 2013, pp. 433– 440. [71] R. Cuppens, Decomposition of Multivariate Probability, Academic Press, New York, 1975. [72] P.C. Curtis Jr., n-parameter families and best approximation, Pacific J. Math. 9 (1959), pp. 1013–1027. [73] O. Davydov, TSFIT: A software package for two-stage scattered data fitting, 2009, http://www.staff.uni-giessen.de/~gc1266/t. [74] O. Davydov, R. Morandi, A. Sestini, Local hybrid approximation for scattered data fitting with bivariate splines, Comput. Aided Geom. Design 23 (2006), pp. 703–721. [75] O. Davydov, F. Zeilfelder, Scattered data fitting by direct extension of local polynomials to bivariate splines, Adv. Comp. Math. 21 (2006), pp. 223–271. [76] D. De Angelis, R. Goldstein, R. O’Neill, A model for tropic interaction, Ecol. 56 (1975), pp. 881–892. [77] M. De Berg, M. Van Kreveld, M. Overmars, O. Schwarzkopf, Computational Geometry, Springer, Berlin, 1997. [78] E.L. De Forest, Additions to a memoir on methods of interpolation applicable to the graduation of irregular series, Annual Report of the Board of Regents of the Smithsonian Institution for 1873, pp. 319–353, 1874. [79] E.L. De Forest, On some methods of interpolation applicable to the graduation of irregular series, Annual Report of the Board of Regents of the Smithsonian Institution for 1871, pp. 275–339, 1873. [80] S. De Marchi, A. Iske, A. Sironi, Kernel-based image reconstruction from scattered radon data, Dolomites Res. Notes Approx. 9 (2016), pp. 19–31. [81] S. De Marchi, G. Santin, Fast computation of orthonormal basis for RBF spaces through Krylov space methods, BIT 55 (2015), pp. 949–966.
References
170
[82] S. De Marchi, G. Santin, A new stable basis for radial basis function interpolation, J. Comput. Appl. Math. 253 (2013), pp. 1–13. [83] S. De Marchi, R. Schaback, Stability of kernel-based interpolation, Adv. Comput. Math. 32 (2010), pp. 155–161. [84] A. De Rossi, Medical image registration using compactly supported functions, Commun. Appl. Ind. Math. 4 (2013), pp. 1–12. [85] A. De Rossi, I. Ferrua, E. Perracchione, G. Ruatta, E. Venturino, Competition models with niche for squirrel population dynamics, in: T.E. Simos et al. (Eds.), Proceedings of the International Conference of Numerical Analysis and Applied Mathematics, AIP Conference Proceedings, Melville, vol. 1558, 2013, pp. 1818–1821. [86] A. De Rossi, F. Lisa, L. Rubini, A. Zappavigna, E. Venturino, A food chain ecoepidemic model: Infection at the bottom trophic level, Ecol. Complex. 21 (2015), pp. 233–245. [87] A. De Rossi, E. Perracchione, Positive constrained approximation via RBF-based partition of unity method, to appear on J. Comput. Appl. Math. (2017). [88] A. De Rossi, E. Perracchione, E. Venturino, Fast strategy for PU interpolation: An application for the reconstruction of separatrix manifolds, Dolomites Res. Notes Approx. 9 (2016), pp. 3–12. [89] M. Dellnitz, O. Junge, M. Rumpf, R. Strzodka, The computation of an unstable invariant set inside a cylinder containing a knotted flow, in: B. Fiedler et al. (Eds.), Proceedings of Equadiff99, World Scientific, Singapore, 2000, pp. 1015–1020. [90] S. Deparis, D. Forti, A. Quarteroni, A rescaled and localized radial basis functions interpolation on non-cartesian and non-conforming grids, SIAM J. Sci. Comput. 86 (2014), pp. A2745–A2762. [91] R.L. Devaney, Introduction to Chaotic Dynamical Systems, Westview Press, Boulder, 2003. [92] T.A. Driscoll, Algorithm 843: Improvements to the SchwarzChristoffel toolbox for Matlab, ACM Trans. Math. Softw. 31 (2005), pp. 239–251. [93] T.A. Driscoll, B. Fornberg, Interpolation in the limit of increasingly flat radial basis functions, Comput. Math. Appl. 43 (2002), pp. 413–422. [94] T.A. Driscoll, L.N. Trefethen, Schwarz-Christoffel Mapping, Cambridge Univ. Press, Cambridge, 2002.
References
171
[95] J. Duchon, Sur l’erreur d’interpolation des fonctions de plusieurs variables par les Dm -splines, Rev. Francaise Automat. Informat. Rech. Opér. Anal. Numer. 12 (1978), pp. 325–334. [96] J. Duchon, Splines minimizing rotation-invariant semi-norms in Sobolev spaces, in: W. Schempp at al. (Eds.), Constructive Theory of Functions of Several Variables, Springer Lecture Notes in Mathematics, Springer-Verlag, Berlin, vol. 571, 1977, pp. 85–100. [97] J. Duchon, Interpolation des fonctions de deux variables suivant le principe de la flexion des plaques minces, Rev. Francaise Automat. Informat. Rech. Opér. Anal. Numer. 10 (1976), pp. 5–12. [98] N. Dyn, D. Levin, Iterative solution of systems originating from integral equations and surface interpolation, SIAM J. Numer. Anal. 2 (1981), pp. 377–390. [99] S.L. Ernstberge, Sensitivity Methods for Dynamical Systems, Ph.D. Thesis, North Carolina State University, Raleigh, 2008. [100] G.E. Fasshauer, Positive definite kernels: Past, present and future, Dolomites Res. Notes Approx. 4 (2011), pp. 21–63. [101] G.E. Fasshauer, Interpolation with compactly supported RBFs in Matlab, 2010, http://amadeus.csam.iit.edu/~fass/Notes590_Ch 12Print.pdf. [102] G.E. Fasshauer, Meshfree Approximations Methods with Matlab, World Scientific, Singapore, 2007. [103] G.E. Fasshauer, On smoothing for multilevel approximation with radial basis functions, in: C.K. Chui et al. (Eds.), Approximation Theory IX: Computational Aspects, Vanderbilt University Press, Nashville, 1999, pp. 55–62. [104] G.E. Fasshauer, J.W. Jerome, Multistep approximation algorithms: Improved convergence rates through postconditioning with smoothing kernels, Adv. Comput. Math. 10 (1999), pp. 1–27. [105] G.E. Fasshauer, M.J. McCourt, Kernel-based Approximation Methods Using Matlab, World Scientific, Singapore, 2015. [106] G.E. Fasshauer, M.J. McCourt, Stable evaluation of Gaussian radial basis function interpolants, SIAM J. Sci. Comput. 34 (2012), A737–A762. [107] G.E. Fasshauer, J.G. Zhang, On choosing “optimal” shape parameters for RBF approximation, Numer. Algorithms 45 (2007), pp. 345–368.
References
172
[108] A.C. Faul, G. Goodsell, M.J.D. Powell, A Krylov subspace algorithm for multiquadric interpolation in many dimensions, IMA J. Numer. Anal. 25 (2005), pp. 1–24. [109] W. Feller, An Introduction to Probability Theory and its Application, Wiley & Sons, New York, 1971. [110] M.S. Floater, A. Iske, Multistep scattered data interpolation using compactly supported radial basis functions, J. Comput. Appl. Math. 73 (1996), pp. 65–78. [111] T.A. Foley, Near optimal parameter selection for multiquadric interpolation, J. Appl. Sci. Comput. 1 (1994), pp. 54–69. [112] B. Fornberg, E. Larsson, N. Flyer, Stable computations with Gaussian radial basis functions, SIAM J. Sci. Comput. 33 (2011), pp. 869–892. [113] B. Fornberg, E. Larsson, G. Wright, A new class of oscillatory radial basis functions, Comput. Math. Appl. 51 (2006), pp. 1209–1222. [114] B. Fornberg, E. Lehto, Stabilization of RBF-generated finite difference methods for convective PDEs, J. Comput. Phys. 230 (2011), pp. 2270–2285. [115] B. Fornberg, E. Lehto, C. Powell, Stable calculation of Gaussian-based RBF-FD stencils, Comput. Math. Appl. 65 (2013), pp. 627–637. [116] B. Fornberg, C. Piret, A stable algorithm for flat radial basis functions on a sphere, SIAM J. Sci. Comput. 30 (2008), pp. 60–80. [117] B. Fornberg, G. Wright, Stable computation of multiquadrics interpolants for all values of the shape parameter, Comput. Math. Appl. 47 (2004), pp. 497–523. [118] E. Francomano, F.M. Hilker, M. Paliaga, E. Venturino, On basins of attraction for a predator-prey model via meshless approximation, in: T.E. Simos et al. (Eds.), Proceedings of the International Conference and Summer School Numerical Computations: Theory and Algorithms, AIP Conference Proceedings, Melville, vol. 1776, 2016, pp. 070007-1–070007-4. [119] R. Franke, Scattered data interpolation: Tests of some methods, Math. Comp. 38 (1982), pp. 181–200. [120] R. Franke, A critical comparison of some methods for interpolation of scattered data, Report No. NPS-53-79-003, Naval Postgraduate School, Monterey, 1982.
References
173
[121] R. Franke, H. Hagen, Least squares surface approximation using multiquadrics and parametric domain distorsion, Comput. Aided Geom. Design 16 (1999), pp. 177–196. [122] R. Franke, G. Nielson, Smooth interpolation of large sets of scattered data, Int. J. Numer. Methods Eng. 15 (1980), pp. 1691–1704. [123] J.H Friedman, J.L. Bentley, R.A. Finkel, An algorithm for finding best matches in logarithmic expected time, ACM Trans. Math. Softw. 3 (1977), pp. 209–226. [124] T. Fujimori, Ecological and Silvicultural Strategies for Sustainable Forest Management, Elsevier, Amterdam, 2001. [125] D. Gabriele, F. Porpiglia, G. Muto, P. Gontero, C. Terrone, S. Annoscia, D. Randone, S. Benvenuti, G. Arena, I. Stura, C. Guiot, Eureka-1 database: An epidemiogical analysis, Minerva Urol. Nefrol. 1 (2015), pp. 9–15. [126] C. Gasquet, P. Witomski, Fourier Analysis and Applications, Springer-Verlag, New York, 1999. [127] I.M. Gel’fand, G.E. Schilow, Verallgemeinerte Funktionen, Vol. 1, Deutscher Verlag der Wissenschaften, Leipzig, 1960. [128] J.E. Gentle, Random Number Generation and Monte Carlo Methods, Springer Science & Business Media, New York, 2004. [129] P. Giesl, H. Wendland, Numerical determination of the basin of attraction for asymptotically autonomous dynamical systems, Nonlinear Anal. Theor. 75 (2012), pp. 2823–2840. [130] P. Giesl, H. Wendland, Numerical determination of the basin of attraction for exponentially asymptotically autonomous dynamical systems, Nonlinear Anal. Theor. 74 (2011), pp. 3191–3203. [131] P. Giesl, H. Wendland, Approximating the basin of attraction of time-periodic ODEs by meshless collocation, Discrete Contin. Dyn. Syst. 25 (2009), pp. 1249–1274. [132] T. Gneiting, Compactly supported correlation functions, J. Multivariate Anal. 83 (2002), pp. 493–508. [133] M.A. Golberg, C.S. Chen, S.R. Karur, Improved multiquadric approximation for partial differential equations, Eng. Anal. Bound. Elem. 18 (1996), pp. 9–17.
References
174
[134] G.H. Golub, M. Heath, G. Wahba, Generalized cross-validation as a method for choosing a good ridge parameter, Technometrics 21 (1979), pp. 215–223. [135] G.H. Golub, C.F. Van Loan, Matrix Computations, Johns Hopkins University Press, Baltimore, 1996. [136] G.H. Golub, U. Von Matt, Generalized cross-validation for largescale problems, J. Comput. Graph. Stat. 6 (1997), pp. 1–34. [137] W.R. Goodin, G.J. McRae, J.H. Seinfeld, A comparison of interpolation methods for sparse data: Application to wind and concentration fields, J. Appl. Meteor. 18 (1979), pp. 761–771. [138] P. Gordan, Über die Auflösung linearer Gleichungen mit reellen Coefficienten, Math. Ann. 6 (1873), pp. 23–28. [139] W.J. Gordon, J.A. Wixom, Shepard’s method of metric interpolation to bivariate and multivariate interpolation, Math. Comput. 32 (1978), pp. 253–264. [140] A. Gosso, V. La Morgia, P. Marchisio, O. Telve, E. Venturino, Does a larger carrying capacity for an exotic species allow environment invasion? — Some considerations on the competition of red and grey squirrels, J. Biol. Systems 20 (2012), pp. 221–234. [141] R.J. Gould, Graph Theory, Dover Publications, Mineola, 2012. [142] J.P. Gram, Über Entwicklung reeler Functionen in Reihen mittelst der Methode der kleinsten Quadrate, J. Math. 94 (1883), pp. 41–73. [143] C. Guiot, P.G. Degiorgis, P.P. Delsanto, P. Gabriele, T.S. Deisboeck, Does tumor growth follow a “universal law”?, J. Theor. Biol. 225 (2003), pp. 147–151. [144] K. Guo, S. Hu, X. Sun, Conditionally positive definite functions and Laplace-Stieltjes integrals, J. Approx. Theory 74 (1993), pp. 249–265. [145] J. Gurnell, L.A. Wauters, P.W.W. Lurz, G. Tosi, Alien species and interspecific competition: Effects of introduced eastern grey squirrels on red squirrel population dynamics, J. Anim. Ecol. 73 (2004), pp. 26–35. [146] A. Haar, Die Minkowskische Geometrie und die Annäherung an stetige Funktionen, Math. Ann. 18 (1918), pp. 294–311. [147] J.H. Halton, On the efficiency of certain quasi-random sequences of points in evaluating multi-dimensional integrals, Numer. Math. 2 (1960), pp. 84–90.
References
175
[148] R.L. Harder, R.N. Desmarais, Interpolation using surface splines, J. Aircraft 9 (1972), pp. 189–191. [149] R.L. Hardy, Multiquadric equations of topography and other irregular surfaces, J. Geophys. Res. 76 (1971), pp. 1905–1915. [150] A.R.H. Heryudono, T.A. Driscoll, Radial basis function interpolation on irregular domain through conformal transplantation, J. Sci. Comput. 44 (2010), pp. 286–300. [151] A. Heryudono, E. Larsson, A. Ramage, L. Von Sydow, Preconditioning for radial basis function partition of unity methods, J. Sci. Comput. 67 (2016), pp. 1089–1109. [152] F.M. Hilker, M. Langlais, H. Malchow, The Allee effect and infectious diseases: Extinction, multistability, and the (dis-)appearance of oscillations, Am. Nat. 173 (2009), pp. 72–88. [153] H. Hoppe, Surface Reconstruction from Unorganized Points, Ph.D. Thesis, University of Washington, Washington, 1994. [154] H. Hoppe, T. Derose, T. Duchamp, J. Mcdonald, W. Stuetzle, Surface reconstruction from unorganized points, in: J.J. Thomas (Ed.), Proceedings of the 19-th annual conference on Computer graphics and interactive techniques, ACM press, New York, vol. 26, 1992, pp. 71–78. [155] H. Hotelling, Analysis of a complex of statistical variables into principal components, J. Educ. Psych. 24 (1993), pp. 417–441. [156] M.Z. Hussain, M. Hussain, C 1 positive scattered data interpolation, Comput. Math. Appl. 59 (2010), pp. 457–467. [157] M.Z. Hussain, M. Hussain, Visualization of data subject to positive constraint, J. Comput. Inf. Sci. 1 (2006), pp. 149–160. [158] M.Z. Hussain, M. Sarfraz, Positivity-preserving interpolation of positive data by rational cubics, J. Comput. Appl. Math. 218 (2008), pp. 446–458. [159] A. Iske, Scattered data approximation by positive definite kernel functions, Rend. Sem. Mat. Univ. Pol. Torino 69 (2011), pp. 217–246. [160] T. Johnson, W. Tucker, Automated computation of robust normal forms of planar analytic vector fields, Discrete Contin. Dyn. Syst. 12 (2009), pp. 769–782. [161] I.T. Jolliffe, Principal Component Analysis, Springer-Verlag, New York, 1986.
References
176
[162] M. Kamranian, M. Dehghan, M. Tatari, An image denoising approach based on a meshfree method and the domain decomposition technique, Eng. Anal. Bound. Elem. 39 (2014), pp. 101–110. [163] E.J. Kansa, Multiquadrics — A scattered data approximation scheme with applications to computational fluid-dynamics — I: Surface approximations and partial derivative estimates, Comput. Math. Appl. 19 (1990), pp. 127–145. [164] E.J. Kansa, Multiquadrics — A scattered data approximation scheme with applications to computational fluid-dynamics — II: Solutions to parabolic, hyperbolic and elliptic partial differential equations, Comput. Math. Appl. 19 (1990), pp. 147–161. [165] E.J. Kansa, Application of Hardy’s multiquadric interpolation to hydrodynamics, in: Proc. 1986 Simul. Conf. 4, 1986, pp. 111–117. ¨ [166] K. Karhunen, Uber lineare Methoden in der Wahrscheinlichkeitsrechnung, Ann. Acad. Sci. Fennicae. Ser. A. I. Math.-Phys. 37 (1947), pp. 1–79. [167] J. Kennedy, R.C. Eberhart, Particle swarm optimization, in: 1995 IEEE International Conference on Neural Networks, IEEE Press, Piscataway, 1995, pp. 1942–1948. [168] Q.J.A. Khan, E. Balakrishnan, G.C. Wake, Analysis of a predator-prey system with predator switching, Bull. Math. Biol. 66 (2004), pp. 109–123. [169] Q.J.A. Khan, E.V. Krishnan, M.A. Al-Lawatia, A stage structure model for the growth of a population involving switching and cooperation, Z. Angew. Math. Mech. 82 (2002), pp. 125–135. [170] M. Kirby, L. Sirovich, Application of the Karhunen-Loève procedure for the characterization of human faces, IEEE Trans. Pattern. Anal. Mach. Intell. 12 (1990), pp. 103–108. [171] E. Larsson, B. Fornberg, Theoretical and computational aspects of multivariate interpolation with increasingly flat radial basis functions, Comput. Math. Appl. 49 (2005), pp. 103–130. [172] E. Larsson, B. Fornberg, A numerical study of some radial basis function based solution methods for elliptic PDEs, Comput. Math. Appl. 46 (2003), pp. 891–902. [173] E. Larsson, E. Lehto, A. Heryudono, B. Fornberg, Stable computation of differentiation matrices and scattered node stencils based on Gaussian radial basis functions, SIAM J. Sci. Comput. 35 (2013), pp. A2096–A2119.
References
177
[174] D.H. Lehmer, Mathematical methods in large-scale computing units, in: Proceedings of the Second Symposium on Large Scale Digital Computing Machinery, Harvard University Press, Cambridge, 1951, pp. 141– 146. [175] L. Ling, R. Opfer, R. Schaback, Results on meshless collocation techniques, Eng. Anal. Bound. Elem. 30 (2006), pp. 247–253. [176] M. Loève, Probability Theory I, Springer, Berlin, 1977. [177] A.J. Lotka, Elements of Physical Biology, Williams & Wilkins, Baltimore, 1925. [178] J.C. Mairhuber, On Haar’s theorem concerning Chebychev approximation problems having unique solutions, Proc. Amer. Math. Soc. 7 (1956), pp. 609–615. [179] T.R. Malthus, An Essay on the Principle of Population, J. Johnson in St. Paul’s Churchyard, London, 1789. [180] B. Matérn, Spatial Variation, Lecture Notes in Statistics, vol. 36, Springer-Verlag, Berlin, 1986. [181] G. Matheron, The intrinsic random functions and their applications, Adv. Appl. Prob. 5 (1973), pp. 439–468. [182] G. Matheron, Les Variables R´ egionalis´ ees et leur Estimation, Masson, Paris, 1965. ¨ [183] M. Mathias, Uber positive Fourier-Integrale, Math. Z. 16 (1923), pp. 103–125. [184] Matlab Central File Exchange, available on line at: http://www.m athworks.com/matlabcentral/fileexchange/. [185] M. Matsumoto, T. Nishimura, Mersenne twister: A 623dimensionally equidistributed uniform pseudorandom number generator, ACM T. Model. Comput. S. 8 (1998), pp. 3–30. [186] D.H. McLain, Two dimensional interpolation from random data, Comput. J. 19 (1976), pp. 178–181. [187] J. Meinguet, Surface spline interpolation: Basic theory and computational aspects, in: S.P. Singh et al. (Eds.), Approximation Theory and Spline Functions, Reidel, Dordrecht, 1984, pp. 127–142. [188] J. Meinguet, Multivariate interpolation at arbitrary points made simple, Z. Angew. Math. Phys. 30 (1979), pp. 292–304.
References
178
[189] J. Meinguet, An intrinsic approach to multivariate spline interpolation at arbitrary points, in: N.B. Sahney (Ed.), Polynomial and Spline Approximations, Reidel, Dordrecht, 1979, pp. 163–190. [190] J. Meinguet, Basic mathematical aspects of surface spline interpolation, in: G. Hammerlin (Ed.), Numerische Integration, Birkhauser, Basel, 1979, pp. 211–220. [191] D. Melchionda, E. Pastacaldi, C. Perri, E. Venturino, Interacting population models with pack behavior, 2014, manuscript, arxiv:1403.4419v1. [192] J.M. Melenk, I. Babuˇska, The partition of unity finite element method: Basic theory and applications, Comput. Meth. Appl. Mech. Eng. 139 (1996), pp. 289–314. [193] J. Mercer, Functions of positive and negative type and their connection with the theory of integral equations, Phil. Trans. Royal Society 209 (1909), pp. 415–446. [194] C.D. Meyer, Matrix Analysis and Applied Linear Algebra, SIAM, Philadelphia, 2000. [195] C.A. Micchelli, Interpolation of scattered data: Distance matrices and conditionally positive definite functions, Constr. Approx. 2 (1986), pp. 11–22. [196] B. Morse, T.S. Yoo, P. Rheingans, D.T. Chen, K.R. Subramanian, Interpolating implicit surfaces from scattered surface data using compactly supported radial basis functions, in: IEEE International Conference on Shape Modeling and Applications 2001, IEEE Press, Los Alamitos, 2001, pp. 89–98. [197] D.M. Mount, ANN Programming Manual, College Park, Maryland, 1998. [198] M. Müller, On the POD Method: An Abstract Investigation with Applications to Reduced-Order Modeling and Suboptimal Control, Ph.D. Thesis, University of Georg-August, Göttingen, 2008. [199] S. Müller, R. Schaback, A Newton basis for kernel spaces, J. Approx. Theory 161 (2009), pp. 645–655. [200] J.D. Murray, Mathematical Biology, Springer-Verlag, Berlin, 1993. [201] F.J. Narcowich, N. Silvakumar, J.D. Ward, On conditition numbers associated with radial-function interpolation, J. Math. Anal. Appl. 186 (1994), pp. 457–485.
References
179
[202] F.J. Narcowich, J.D. Ward, Norms and inverses and condition numbers for matrices associated with scattered data, J. Approx. Theory 64 (1991), pp. 69–94. [203] F.J. Narcowich, J.D. Ward, Norms and inverses for matrices associated with scattered data, in: P.J. Laurent et al. (Eds.), Curves and Surfaces, Academic Press, New York, 1991, pp. 341–348. [204] V.P. Nguyen, T. Rabczuk, S. Bordas, M. Duflot, Meshless methods: A review and computer implementation aspects, Math. Comput. Simul. 79 (2008), pp. 763–813. [205] G.M. Nielson, A first-order blending method for triangles based upon cubic interpolation, Int. J. Numer. Meth. Eng. 15 (1978), pp. 308–318. [206] J. Nocedal, S.J. Wright, Numerical Optimization, SpringerVerlag, New York, 1999. [207] Y. Ohtake, A. Belyaev, H.P. Seidel, Sparse surface reconstruction with adaptive partition of unity and radial basis functions, Graph. Models 68 (2006), pp. 15–24. [208] S.K. Park, K.W. Miller, Random number generators: Good ones are hard to find, Commun. ACM 31 (1988), pp. 1192–1201. [209] K.E. Parsopoulos, M.N. Vrahatis, Particle swarm optimization method for constrained optimization problems, Frontiers Artificial Intelligence Appl. 76 (2002), pp. 214–220. [210] M. Pazouki, R. Schaback, Bases for kernel-based spaces, J. Comput. Appl. Math. 236 (2011), pp. 575–588. [211] M.E.H. Pedersen, A.J. Chipperfield, Simplifying particle swarm optimization, Appl. Soft Comput. 10 (2010), pp. 618–628. [212] E. Perracchione, I. Stura, Simulating prostate cancer dynamics via a stochastic RBF-based numerical tool, submitted, 2016. [213] E. Perracchione, I. Stura, RBF kernel method and its applications to clinical data, Dolomites Res. Notes Approx. 9 (2016), pp. 13–18. [214] E. Perracchione, I. Stura, A RBF-PSO based approach for modeling prostate cancer, in: T.E. Simos et al. (Eds.), Proceedings of the International Conference of Numerical Analysis and Applied Mathematics, AIP Conference Proceedings, Melville, vol. 1738, 2016, pp. 390008-1–390008-4.
References
180
[215] R.B. Platte, T.A. Driscoll, Polynomials and potential theory for Gaussian radial basis function interpolation, SIAM J. Numer. Anal. 43 (2005), pp. 750–766. [216] W. Pogorzelski, Integral Equations and Their Applications Vol. I, International Series of Monographs in Pure and Applied Mathematics, vol. 88, Pergamon Press, Oxford, 1966. [217] S.N. Qasem, S.M. Shamsuddin, Radial basis function network based on time variant multi-objective particle swarm optimization for medical diseases diagnosis, Appl. Soft Comput. 11 (2011), pp. 1427–1438. [218] R.J. Renka, Multivariate interpolation of large sets of scattered data, ACM T. Math. Softw. 2 (1988), pp. 139–148. [219] R.J. Renka, Algorithm 660: QSHEP2D: Quadratic Shepard method for bivariate interpolation of scattered data, ACM Trans. Math. Softw. 14 (1988), pp. 149–150. [220] R.J. Renka, Algorithm 661: QSHEP3D: Quadratic Shepard method for trivariate interpolation of scattered data, ACM Trans. Math. Softw. 14 (1988), pp. 151–152. [221] S. Rippa, An algorithm for selecting a good value for the parameter c in radial basis function interpolation, Adv. Comput. Math. 11 (1999), pp. 193–210. [222] W. Rudin, Functional Analysis, McGraw-Hill, New York, 1973. [223] G. Sabetta, E. Perracchione, E. Venturino, Wild herbivores in forests: Four case studies, in: R.P. Mondaini (Ed.), Proceedings of the International Symposium on Mathematical and Computational Biology 2014, World Scientific, Singapore, 2015, pp. 56–77. [224] A. Safdari-Vaighani, A. Heryudono, E. Larsson, A radial basis function partition of unity collocation method for convection-diffusion equations arising in financial applications, J. Sci. Comput. 64 (2015), pp. 341–367. [225] H. Samet, The Design and Analysis of Spatial Data Structures, Addison-Wesley, New York, 1990. [226] R. Schaback, Unsymmetric meshless methods for operator equations, Numer. Math. 114 (2010), pp. 629–651. [227] R. Schaback, Convergence of unsymmetric kernel-based meshless collocation methods, SIAM J. Numer. Anal. 45 (2007), pp. 333–351.
References
181
[228] R. Schaback, Stability of radial basis function interpolants, in: C.K. Chui et al. (Eds.), Approximation Theory X, Vanderbilt Univ. Press, Nashville, 2002, pp. 433–440. [229] R. Schaback, Remarks on meshless local construction of surfaces, in: R. Cipolla et al. (Eds.), The Mathematics of Surfaces, vol. IX, Springer, Berlin, 2000, pp. 34–58. [230] R. Schaback, A unified theory of radial basis functions: Native Hilbert spaces for radial basis functions II, J. Comput. Appl. Math. 121 (2000), pp. 165–177. [231] R. Schaback, Native Hilbert spaces for radial basis functions I, in: M.W. Müller et al. (Eds.), New Developments in Approximation Theory, Birkhäuser, Basel, vol. 132, 1999, pp. 255–282. [232] R. Schaback, On the efficiency of interpolation by radial basis functions, in: A. Le Méhauté et al. (Eds.), Surface Fitting and Multiresolution Methods, Vanderbilt Univ. Press, Nashville, 1997, pp. 309–318. [233] R. Schaback, Error estimates and condition numbers for radial basis function interpolation, Adv. Comput. Math. 3 (1995), pp. 251–264. [234] R. Schaback, Multivariate interpolation and approximation by translates of a basis function, in: C. Chui et al. (Eds.), Approximation Theory VIII: Approximation and Interpolation, World Scientific, Singapore, 1995, pp. 491–514. [235] R. Schaback, Lower bound for norms of inverses of interpolation matrices for radial basis functions, J. Approx. Theory 79 (1994), pp. 287–306. [236] R. Schaback, Comparison of radial basis function interpolants, in: K. Jetter et al. (Eds.), Multivariate Approximation: from CAGD to Wavelets, World Scientific, River Edge, 1993, pp. 293–305. [237] R. Schaback, Z. Wu, Operators on radial functions, J. Comput. Appl. Math. 73 (1996), pp. 257–270. [238] J.W. Schmidt, W. Hess, Positivity of cubic polynomials on intervals and positive spline interpolation, BIT 28 (1998), pp. 340–352. [239] I.J. Schoenberg, Metric spaces and completely monotone functions, Ann. Math. 39 (1938), pp. 811–841. [240] L.L. Schumaker, Spline Functions: Basic Theory, John Wiley & Sons, New York, 1981.
References
182
[241] V. Shcherbakov, E. Larsson, Radial basis function partition of unity methods for pricing vanilla basket options, Comput. Math. Appl. 71 (2016), pp. 185–200. [242] D. Shepard, A two-dimensional interpolation function for irregularly spaced data, in: Proceedings of 23-rd National Conference, Brandon/Systems Press, Princeton, 1968, pp. 517–524. [243] Y. Shi, R.C. Eberhart, A modified particle swarm optimizer, in: 1998 IEEE International Conference on Evolutionary Computation, IEEE Press, Piscataway, 1998, pp. 69–73. [244] C. Shu, H. Ding, K.S. Yeo, Computation of incompressible NavierStokes equations by local RBF-based differential quadrature method, Comput. Model. Eng. Sci. 7 (2005), pp. 195–205. [245] H.D. Simon, H. Zha, Low-rank matrix approximation using the Lanczos bidiagonalization process with applications, SIAM J. Sci. Comput. 21 (2000), pp. 2257–2274. [246] M.L. Stein, Interpolation of Spatial Data. Some Theory for Kriging, Springer-Verlag, New York, 1999. [247] J. Stewart, Positive definite function and generalizations, an historical survey, Rocky Mountain J. Math. 6 (1976), pp. 409–434. [248] I. Stura, E. Venturino, C. Guiot, A two-clones tumor model: Spontaneous growth and response to treatment, Math. Biosci. 10 (2015), pp. 19–28. [249] X. Sun, Conditionally positive definite functions and their application to multivariate interpolation, J. Approx. Theory 74 (1993), pp. 159– 180. [250] R. Swinbank, R.J. Purser, Fibonacci grids: A novel approach to global modelling, Q. J. Roy. Meteor. Soc. 132 (2007), pp. 1769–1793. [251] L. Tamburino, V. La Morgia, E. Venturino, System dynamic approach to management of urban parks. A case study: The Meisino urban park in Torino, NW Italy, Comput. Ecol. Softw. 2 (2012), pp. 26–41. [252] L. Tamburino, E. Venturino, Public parks management via mathematical tools, Int. J. Comp. Math. 89 (2012), pp. 1808–1825. [253] M. Tanksy, Switching effects in prey-predator system, J. Theor. Biol. 70 (1978), pp. 263–271.
References
183
[254] C.J. Trahan, R.E. Wyatt, Radial basis function interpolation in the quantum trajectory method: Optimization of the multi-quadric shape parameter, J. Comput. Phys. 185 (2003) pp. 27–49. [255] G. Turk, J.F. O’Brien, Modelling with implicit surfaces that interpolate, ACM Trans. Graph. 21 (2002), pp. 855–873. [256] S. Ullmann, J. Lang, POD-Galerkin modeling and sparse-grid collocation for a natural convection problem with stochastic boundary conditions, in: J. Garcke et al. (Eds.), Sparse Grids and Applications, Lecture Notes in Computational Science and Engineering, Springer, Berlin, 2014, pp. 295–315. [257] F.I. Utreras, Positive thin plate splines, Approx. Theor. Appl. 1 (1985), pp. 77–108. [258] P.F. Verhulst, Recherches mathématiques sur la loi d’accroissement de la population, Mém. Acad. Roy. Brussels 18 (1845), pp. 1–38. [259] P.F. Verhulst, Notice sur la loi que la population suit dans son accroissement, Corr. Math. Phys. 10 (1838), pp. 113–121. [260] H. Vogel, A better way to construct the sunflower head, Math. Biosci. 44 (1979), pp. 179–189. [261] V. Volterra, Variazioni e fluttazioni del numero d’individui in specie animali conviventi, Mem. Acad. Sci. Lincei 2 (1926), pp. 31–113. [262] A. Vretblad, Fourier Analysis and Its Applications, SpringerVerlag, New York, 2003. [263] R. Wang, J. Wu, Approximate implicitization based on RBF networks and MQ quasi-interpolation, J. Comput. Math. 25 (2007), pp. 97–103. [264] S. Wei, Z. Lin, Accelerating iterations involving eigenvalue or singular value decomposition by block Lanczos with warm start, Technical Report No. MSR-TR-2010-162, Microsoft Research, 2010. [265] J.H. Wells, R.L. Williams, Embeddings and Extensions in Analysis, Springer, Berlin, 1975. [266] H. Wendland, Scattered Data Approximation, Cambridge Monogr. Appl. Comput. Math., vol. 17, Cambridge Univ. Press, Cambridge, 2005. [267] H. Wendland, Surface reconstruction from unorganized points, 2005, http://people.maths.ox.ac.uk/wendland/research/old/reconht ml/reconhtml.html.
References
184
[268] H. Wendland, Fast evaluation of radial basis functions: Methods based on partition of unity, in: C.K. Chui et al. (Eds.), Approximation Theory X: Wavelets, Splines, and Applications, Vanderbilt Univ. Press, Nashville, 2002, pp. 473–483. [269] H. Wendland, Local polynomial reproduction and moving least squares approximation, IMA J. Numer. Anal. 21 (2001), pp. 285–300. [270] H. Wendland, Error estimates for interpolation by compactly supported radial basis functions of minimal degree, J. Approx. Theory 93 (1998), pp. 258–272. [271] H. Wendland, Piecewise polynomial, positive definite and compactly supported radial functions of minimal degree, Adv. Comput. Math. 4 (1995), pp. 389–396. [272] D.V. Widder, The Laplace Transform, Princeton Univ. Press, Princeton, 1941. [273] S. Wiggins, Introduction to Applied Nonlinear Dynamical Systems and Chaos, Springer, New York, 2003. [274] R.E. Williamson, Multiply monotone functions and their Laplace transform, Duke Math. J. 23 (1956), pp. 189–207. [275] S.M. Wong, Y.C. Hon, T.S. Li, Radial basis functions with compactly support and multizone decomposition: Applications to environmental modelling, in: C.S. Chen et al. (Eds.) Boundary Element Technology XIII, WIT Press, 1999, pp. 355–364. [276] W.S.B. Woolhouse, Explanation of a new method of adjusting mortality tables, with some observations upon Mr. Makeham’s modification of Gompertz’s theory, J. Inst. Act. 15 (1870), pp. 389–410. [277] G.B. Wright, B. Fornberg, Scattered node compact finite difference-type formulas generated from radial basis functions, J. Comput. Phys. 212 (2006), pp. 99–123. [278] Z. Wu, Multivariate compactly supported positive definite radial functions, Adv. Comput. Math. 4 (1995), pp. 283–292. [279] J. Wu, Y. Lai, X. Zhang, Radial basis functions for shape preserving planar interpolating curves, J. Comput. Inf. Sci. 7 (2010), pp. 1453– 1458. [280] Z. Wu, R. Schaback, Shape preserving interpolation with radial basis function, Acta Math. Appl. Sinica 10 (1994), pp. 443–448.
References
185
[281] Z. Wu, R. Schaback, Local error estimates for radial basis function interpolation of scattered data, IMA J. Numer. Anal. 13 (1993), pp. 13–27. [282] D. Wu, K. Warwick, Z. Ma, M.N. Gasson, J.G. Burgess, S. Pan, T.Z. Aziz, Prediction of parkinson’s disease tremor onset using a radial basis function neural network based on particle swarm optimization, Int. J. Neur. Syst. 20 (2010), pp. 109–116. [283] J. Wu, X. Zhang, L. Peng, Positive approximation and interpolation using compactly supported radial basis functions, Math. Probl. Eng. 2010 (2010), pp. 1–10. [284] G. Yao, J. Duo, C.S. Chen, L.H. Shen, Implicit local radial basis function interpolations based on function values, Appl. Math. Comput. 265 (2015), pp. 91–102. [285] S. Zhu, A.J. Wathen, Convexity and solvability for compactly supported radial basis functions with different shapes, J. Sci. Comput. 63 (2015), pp. 862–884.