coordinates, matrix & network graph visualisations, and multiple tree visualisations .... Graph API, enabling us to view the graph within an extended. JTable class ...
Re-architecting Visualizations to Java Swing Martin Graham and Jessie Kennedy Edinburgh Napier University, UK
ABSTRACT Many visualizations end up unused outside their original domains due to the amount of effort necessary to re-adapt and integrate them into other applications. By rebuilding our visualizations to be based as closely as possible on existing Java Swing architecture and implementations, we can ease the process of incorporating our visualizations into existing Java applications and take advantage of existing functionality. KEYWORDS: MVC, Re-architecting, Swing 1
INTRODUCTION
We present a report on re-architecting existing visualizations to take advantage of existing Java Swing widgets’ functionality and interfaces. We believes this eases the process of incorporating visualisations into existing Swing-based GUIs and also takes advantage of the work already invested in Swing development. 2
PREVIOUS WORK
Many systems for visualizing data already exist in the InfoVis world, and can be roughly divided into being targeted at user-level and developer-level audiences. User-level apps provide a readymade environment for loading and analyzing certain data types with multiple views, including graphical statistics packages like Mondrian [1], multi-dimensional data explorers such as XmdvTool [2], and collaborative web-based systems such as ManyEyes [3]. Developer-level toolkits provide widgets, functionality and interfaces for developers to produce new visualizations and/or integrate into existing applications, and range from specific domains such as Piccolo’s zoomable interfaces [4], and Prefuse’s [5] structure-based data sets, to a more general range of visualization styles and techniques as in InfoVis Toolkit [6] and cross-platform collections of algorithms found in the Information Visualization Software Repository [7]. 3
THEORY
The re-architecting of our visualisations, including parallel coordinates, matrix & network graph visualisations, and multiple tree visualisations, was driven by the need to quickly adapt our visualisations to accommodate new data as interested parties asked how to incorporate our work into their existing applications. ‘Existing’ is a keyword here, building a visualisation from scratch with a toolkit involves learning the specific models and architecture that each uses, and trying to integrate the same visualisation into an existing application is a more difficult task. With this mind an architecture to which we would rebuild our visualisations was required and the decision in the end was essentially a pragmatic one. Java Swing [8] was chosen not just as the implementation platform but also as the architecture to rebuild our visualisations around. The decision was based on four reasons: our expertise in building visualisations lies in Java, many existing GUIs have been built in Java Swing, the ease of component substitution in existing Java Swing code, and that the Java Swing APIs separate data structure from data contents.
The first reason is self-explanatory, our previous visualisations had been written in Java using Swing/AWT classes (but critically not extending the existing widgets and models, instead we built from scratch), so this was where our development expertise lay. Secondly, as there is an existing collection of Java applications that use Swing for their GUI (the main competition is the SWT/JFace toolkit [9]), then a toolkit which extends the capabilities of existing Swing widgets immediately has a large target population it can integrate with. Rebuilding our visualisations to use and extend, where possible, existing Swing functionality and APIs makes substituting visualisation components for standard Swing widgets in existing applications much easier; the best case is a change of only one or two lines of code. The Fisheye Menu [10], which extends and replaces a standard Swing list widget, is an early example of such a drop-in replacement. Finally the data models used by Swing care only about data structure e.g. they specify only that a table requires a table model. The nature of individual data elements in that model is left to pluggable renderers to display and for other non-GUI business logic to process, the widget doesn’t care. 4
EXAMPLE
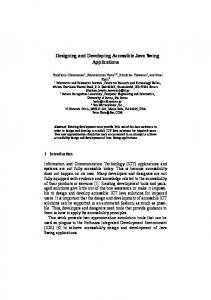
The first component we’ve re-architected is an implementation of Parallel Coordinates initially developed for a business trust modeling project. The initial decision was to decide what existing Swing functionality best fits the data set of a typical parallel coordinate plot. Swing itself has only three standard complex data widgets, which display list, tree and table data in turn. Here the obvious candidate is a table as a Parallel Coordinate visualization is based on a 2-dimensional data model. Model Interface
Controller
TableModel
JTable Extended by JParCoord
View (+Controller) TableUI
ParCoord UI
Figure 1. Parallel Coordinate extension to JTable
Swing’s widget implementations are based on an MVC style [11] approach: a data model (M) is presented through a view (V) whose interactions are mediated through a controller (C). For a table in Swing, these portions correspond to a TableModel interface (M), a TableUI abstract class (V) and the JTable class (C), with the View and the Controller blurring into each other depending on particular definitions of the two constructs. To implement Parallel Coordinates it became obvious that the bulk of the changes would have to be in the View/UI portion and in the table sorting routines –a JTable has one ordering, whereas each column or axis in a Parallel Coordinate is ordered independently. Thus, we would need to extend JTable for the sorting, build a new UI class, but keep the same model of the underlying data.
Figure 1 shows a simplified class diagram of the parallel coordinates display; JTable is extended by the JParCoord class, in which a new implementation of ColumnModel (a sub-model in JTable) is built that supports independent ordering of its attributes, and an extra SelectionModel instance for brushing items is included. ParCoordUI is where the bulk of the work for this visualisation lies, as it includes the complete drawing code for the Parallel Coordinates representation. To help perceived performance, an incremental rendering approach is used, the UI paint() method is given a fixed time period to draw the brushed paths first, followed by selected paths and finally the ‘background’ items. If at the end of this time period, items remain undrawn, a repaint() is requested on the Swing event thread to continue the drawing. This enables user interaction to curtail current drawing operations rather than have user events wait for the drawing of the whole display. 4.1.1 Advantages Now based on a JTable, the Parallel Coordinates has access to all the existing functionality of the JTable. This includes drag’n’drop ordering of columns, dynamic removal and addition of columns from the view and the ability to filter the displayed items if needed. Importantly, this also allows a JParCoord view to be dropped in wherever a JTable occurs in the source code. It can also take advantage of Swing’s MVC-style model to share a data model with other table widgets as in Figure 2, where a JTable and a parallel coordinate plot share the same data. Data edited in the table representation is reflected back in the parallel coordinate visualization. Intersecting selections made in the parallel coordinates are reflected back in the table display.
4.1.3 Second Example A second example involves converting a matrix-based graph browser to become an extension of an existing Swing component. Swing has no standard graph viewing component, and thus no associated graph model for holding such data, so we built a simple Graph interface and implementation (an edge set, where each edge contains three objects – two nodes and whatever connects them). Since a matrix is essentially a table-based view of a graph, we wrote a TableModel implementation that wrapped around this Graph API, enabling us to view the graph within an extended JTable class we named JMatrix. Some further implementation was needed to give the table a row header (they have a built-in column header only), along with some suitable renderer classes, and the end result was a matrix viewer that can handle multigraphs and supports sorting on any row or column. 5
CONCLUSION
Re-architecting our visualizations to extend existing Java Swing components has greatly simplified the task of adapting these visualizations to function with existing Java Swing based GUIs, and also gives a return in that they open up whatever existing functionality the pre-extended Swing widgets contained. Swings models are not admittedly as flexible as those designed specifically for IV toolkits, but we feel the ability to simply insert a visualization in place of standard Swing widgets is ample compensation for this. So far, we have managed to integrate a parallel coordinate view into a searching/browsing prototype for house price data. Future work involves exploring extending collections of Swing tree widgets to produce varying styles of multiple tree visualization. REFERENCES [1]
Figure 2. Linked JTable and Parallel Coordinates.
4.1.2 Disadvantages One problem we discovered was in trying to share selection states between Swing widgets. Swing’s default selection model for a table view stores the selection state as a yes/no bit for each item, but it stores these in view order rather than data model order. Thus two tables that share the same model can only share the same selection model if they are sorted identically. We solved this by building a listener class which converted changes in one selection model to other views’ selection models when the views were of the same data model. The views in Figure 2 are synchronized through this method so selections in one are reflected in the other. Further, many of the methods and fields in the default Swing UI classes are marked as ‘private’, and thus inaccessible even when extended, necessitating some cut’n’paste style coding in places.
M. Theus, "Interactive Data Visualization using Mondrian," Journal of Statistical Software, vol. 7, no. 11, pp. 1-9, 2002. [2] M. O. Ward, E. Rundensteiner, Q. Cui, Z. Xie, D. Yang, C. Wad, D. Q. Nguyen, Y.-H. Fua, J. Yang, D. Stroe, P. R. Doshi, G. E. Rosario, N. K. Mehta, S. Huang, A. Patro, W. Peng, and A. R. Martin, "XmdvTool," ver. 7.0, http://davis.wpi.edu/~xmdv, 2006. [3] F. Viégas, M. Wattenberg, F. Van Ham, J. Kriss, and M. McKeon, "Many Eyes: A Site for Visualization at Internet Scale," IEEE Transactions on Visualization and Computer Graphics, vol. 13, no. 6, pp. 1121-1128, November 2007. [4] B. B. Bederson, J. Grosjean, and J. Meyer, "Toolkit Design for Interactive Structured Graphics," IEEE Transactions on Software Engineering, vol. 30, no. 8, pp. 535-546, August 2004. [5] J. Heer, S. K. Card, and J. A. Landay, "prefuse: a toolkit for interactive information visualization," In Proc. ACM CHI (Portland, Oregon, USA, April 2-7, 2005), pages 421-430. ACM Press. [6] J.-D. Fekete, "The InfoVis Toolkit," In Proc. IEEE InfoVis (Austin, Texas, USA, 10-12 October, 2004), pages 167-174. IEEE Computer Society Press. [7] K. Börner and Y. Zhou, "A Software Repository for Education and Research in Information Visualization," In Proc. IEEE Conference in Information Visualisation (London, UK, 25-27 July, 2001), pages 257-262. IEEE Computer Society Press. [8] Sun Microsystems Inc., "The Swing Tutorial," http://java.sun.com/docs/books/tutorial/uiswing/index.html, Last accessed 5th August, 2009. [9] The Eclipse Foundation, "SWT: The Standard Widget Toolkit," http://www.eclipse.org/swt/, Last accessed 5th August, 2009. [10] B. B. Bederson, "Fisheye Menus," In Proc. ACM UIST (San Diego, California, USA, November 5-8, 2000), pages 217-226. ACM Press. [11] A. Fowler, "A Swing Architecture Overview," http://java.sun.com/products/jfc/tsc/articles/architecture/index.html, Last accessed 5th August, 2009.


![Programming with Java, Swing, and SquintSyllabus [pdf]](https://m.moam.info/img/260x300/programming-with-java-swing-and-squintsyllabus-pdf_5a0e1d231723dd2c3857094b.jpg)