patient care. To solve this problem, a novel reactive agent and ... The large amounts of real-time data must be ... that can be leveraged from the physiologic data to facilitate ..... Auditory Alarm Signals in the Operating Room and Recovery.
Reactive Agent and Visualization System for Anesthesia Support in the Operating Room Chao Chen1, 3, Grant H. Kruger1, James M. Blum2, Albert J. Shih1, Kevin K. Tremper2 1
S.M. Wu Manufacturing Research Center Department of Mechanical Engineering University of Michigan Ann Arbor, 48109, USA 2
Department of Anesthesiology University of Michigan Health System Ann Arbor, 48109, USA 3
Department of Biomedical Engineering, Shanghai Jiao Tong University, Shanghai 200240, P.R. China
ABSTRACT Information overload of the anesthesiologist through technological advances have threatened the safety of patients under anesthesia in the operating room (OR). Previous monitors and alarm systems provide separate indexes of patient physiological states, potentially distracting caregivers from direct patient care. To solve this problem, a novel reactive agent and visualization system was developed to collect the relevant monitoring parameters in anesthesia and display them as a vivid and intuitive color coded animation. Our system presents a unified, contextually appropriate snapshot of the patient to the operating room team without requiring any user intervention. Deterministic rules were developed by anesthesiologists and integrated into the system to generate alarms of critical patient events. To validate the efficacy of the system, a retrospective analysis focusing on the hypotension rules was performed. Results show that even with vigilant and highly trained clinicians, deviations from ideal patient care exist and it is here that the system may allow more standardized and improved patient care and potentially outcomes. Keywords: medical, information system, computation, visualization, operating room, alarm 1. I,TRODUCTIO, Over the years the number and complexity of equipment to control and monitor a patient’s vital functions has increased considerably (i.e. vital sign monitors, therapeutic devices supporting/replacing organs, fluid, gas or medication administration devices) [1]. Over the last two decades, alarm and visualization system development has lagged behind medical device technology [2]. The number and complexity of devices and alarms monitoring patient physiologic parameters fight for the anesthesiologist’s attention as the human brain can only assimilate, integrate and act on a certain amount of information at one time [1, 3, 4]. The large amounts of real-time data must be
continuously synthesized to extract critical information describing the overall state of the patient and care necessary [5]. Concentration decreases as a function of time and intensity (amount of incoming information) and it can be very difficult to maintain perfect vigilance through a lengthy case [1]. Instead of providing the additional diagnosis benefit, most physiologic variable traces and alarms are turned off to prevent information overload to the anesthetist [3]. McIntyre et al. [6] found that 58% of the 789 anesthetists questioned, admitted to muting an alarm for a variety of reasons. These alarms generally use simple thresholds based on a single physiologic variable [8]. Therefore many false alarms can result and only a few may provide useful information to the anesthetist. Some activity not related to the physiologic state of the patient (sensor movement, accidental disconnections, etc) can result in a series of alarms [1, 2]. An alternative used to minimize the number of alarms is setting “safe limits”; however, this can result in unnecessary deterioration of the patient’s condition in the event of a true alarm [1, 2]. Multitudes of false alarms can lead to desensitization of clinical staff toward true alarms [2, 4]. Research has shown that about 90% of all alarms in critical-care monitoring are false positives [2]. In a study by Chambrin et al. [9], no medical action was taken for 72% of all the alarms. The positive predictive value was only 27%, and the specificity only 58%. The negative predictive value and the sensitivity were 99% and 97%, respectively. In a study by Imhoff et al. [11], 40% of all alarms resulted from patient manipulation. Meijler [12] analyzed 731 warnings generated by a statistical disturbance algorithm during cardiac surgery by linking them to the response of the anesthetist. Of these alerts 7% were useful, and 13% followed some intervention, and probably could have been predicted and eliminated. Kestin et al. [13] evaluated the significance of auditory alarms during routine anaesthetic management of 50 paediatric patients undergoing elective surgery. Five monitors with auditory alarms were used routinely: ECG, automatic blood pressure (BP), oxygen analyzer, pulse oximeter
and ventilator low pressure (disconnect alarm). There was a mean of 10 alarms per case with an average frequency of one alarm every 4.5 minutes. The incidence of alarms varied little between the different phases of anesthesia and surgery. Of all alarms that sounded, 75% were spurious, i.e. caused by patient movement, interference or mechanical problems. Only 3% of all alarms indicated risk to the patient. O'Carroll [14] recorded a total of 1455 alarms during a three week period. Only 8 indicated a potentially serious threat to patient safety and consisted of one ventilator disconnect alarm and seven dysrhythmias. Lawless [10] found that the rate of true alarms in the pediatric ICU was about 10%, various procedures induced 27% of the alarms and 68% were truly false alarms. In another study about a third of all alarms originated from the ventilator, another third from the cardiovascular monitor, and 15% from pulse oximetry. Similar studies found pulse oximetry to cause over 40% of all false alarms. In patients with invasive blood-pressure monitoring, arterial BP alarms can also often be the leading cause of false alarms [2]. It can clearly be seen that alarms are necessary, but not in large numbers. This fact, coupled with the various common surgical distractions, and tasks the anesthesiologist must perform, can be make it easy to miss physiologic variable changes or diagnoses relying on historic sensor data (i.e. potential hypotension). Clinical alarms alert the anesthesiologist to the current state of the patient; however, there is more information that can be leveraged from the physiologic data to facilitate prediction of impending dangerous situations for the patient [3]. There has been significant interest and success over the last two decades in the development of smart alarms and monitoring systems, rather than just displaying the raw data for anesthesiologists to interpret [3]. These new alarm methods need to fulfill a number of methodological criteria, such as robustness, real-time and online capabilities, methodological rigor and applicability to large patient populations. With the recent advances in artificial intelligence it is believed that the implementation of 'intelligent' monitoring and alarm systems can improve patient care [1]. It is believed that integrated intelligent monitoring systems are able to detect deviations and states that may not be noticed or recognized through periodic clinical observations alone and prevent adverse patient outcomes [1]. Univariate and multivariate methods have been proposed and investigated, mostly from the fields of statistics and artificial intelligence. Some have even shown encouraging results in clinical studies [2]. We have developed intelligent agent (IA) architecture capable of integrating the data from various sources, such as electronics medical records (EMRs), patient monitors, anesthesia machines, etc. in University of Michigan Hospital operating rooms. The system provides a centralized graphical visualization of the physiologic state of the patient and performs basic decision support, by implementing expert rules captured from anesthesiologists. Using our custom developed data integration server we can perform various types of intelligent signal processing, visualization and alerting to implement and study the performance of artifact removal, classification/diagnosis, and decision support and prediction algorithms. There is no need for the anesthesiologist to scan for information from several pieces of equipment as data from a variety of monitors are combined using
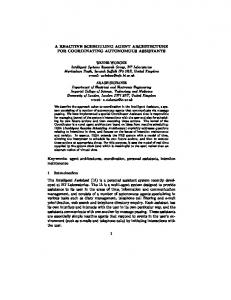
mathematical modeling and rule-based logic into meaningful statements about the functioning of specific organs. The system is capable of running on historic data as well as live patient information, enabling both retrospective and prospective studies. This manuscript is divided into two parts: Section 2 presents the architecture of the system, while Section 3 and 4 provide a retrospective analysis of the potential hypotension alert.. A discussion is presented in Section 5, followed by a conclusion. 2. SYSTEM ARCHITECTURE An intelligent agent system must make rational decisions and effect changes to their environment to achieve a specified goal. Rationality is especially important in the medical domain. A rational decision can be defined as a decision that would mimic that of an experienced physician if given the same facts. The goal of the agent is to improve a patient’s state of health (environment). To enable rational decisions the agent must accurately perceive its environment through the integration, sensor selection and data cleaning from various heterogeneous data sources (i.e. electronic medical record, patient monitor, clinicians, etc). To achieve its goal the agent must be capable of effecting change to its environment (i.e. visual and acoustic alerts). Figure 1 illustrates this conceptual architecture of the agent system. Knowledge about patient physiology and anesthesia care are encoded as mathematical equations and production rules. The system is designed in such a way as to provide supervisory support to the caregiver and not interfere or replace existing workflow policies in the OR. A key aspect of agents is their communication ability, allowing them to share information with other agents and distributed hospital systems. Even though this is the first agent we have developed in this environment, it can be seen that many specialized agents can be developed, which function together to improve multiple aspects are patient care.
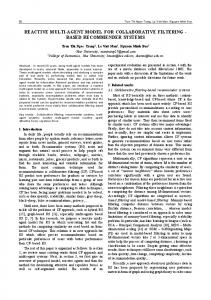
Figure 1. Reflex intelligent agent architecture for anesthesia supervision. 2.1. IA Perception Figure 2 illustrates the practical implementation and network infrastructure of the agent system on the hospital network. The University of Michigan Hospital OR uses Solar 9000 monitors (General Electric Healthcare). These monitors pass data to a common data network (Unity Network, General Electric Healthcare), similar to other monitor systems. A software package (Monitor Capture Server, General Electric Healthcare) was used to capture the physiologic data broadcast over the network by the
monitors. This package then logs the data to a SQL database (SQL Server, Microsoft Corporation, Redmond, WA) in a standard format every 10s. The University of Michigan hospital uses the Centricity EMR (General Electric Healthcare) to capture and store patient records (H&P), OR scheduling, anesthesia records, etc.. The anesthesia record contains key surgical events (anesthesia start, incision, etc.), lab values, liquids, drugs and physiologic data from the patient monitor. A multi-threaded Java based data integration server retrieves real-time patient monitor data using a SQL query though the JDBC connector every 2 seconds. Another query is performed
on the EMR using stored procedures every minute. The patient monitor data and EMR data is integrated and cleaned. Certain surgeries utilize different sets of sensors, with multiple sensors measuring similar quantities (i.e. pulse oximeter heart rate and ECG heart rate). In these situations the sensor providing the cleaner signal is automatically chosen. When the graphical display connects to the data integration server, it opens a TCP socket for mutual communication and the optimal set of data describing the patient state is sent to the client.
Figure 2. Data flow diagram and infrastructure of the clinical information system.
2,2. Action Computation Production Rules are created for alerts, notifications and reminders. Alerts are combinations of one or several monitor, EMR, or calculated variables that may potentially cause adverse outcome if not addressed in a timely manner. Notification rules contain normal, abnormal and marginal ranges for variables such as bispectral index (BIS), monitored anesthesia care (MAC), systolic blood pressure (SBP), heart filling volume, end tidal (ET) CO2, peak airway pressure (PAP), pulse oximeter oxygen saturation (SpO2), body temperature, hematocrit (HCT), estimated HCT, glucose, positive end-expiratory pressure (PEEP) and creatine. All the rules and thresholds are based on well defined and agreed upon anesthesia practice. Equation 1 provides an example of an equation used to predict a patient’s estimated HCT [15]. Where, b(t) is the estimated blood loss, taking into account any transfusions, h0 is the last hematocrit measurement and hi corresponds to the estimated hematocrit at time interval i. V is the estimated body volume calculated by multiplying the body weight by 70 ml. Equation 2 presents an example of one such rule for potential tension pneumothorax alerts. Reminders alert the physician to provide some treatment, remind them to perform certain duties, or highlight the current patient states. The normal range is defined for these variables which are shown green on the graphical display. Beyond the normal range (high risk) and marginal which are displayed with red and yellow respectively. All the alarms are listed in Table 1 and the specific threshold value
used in the equations are configurable. There are 7 primary alerts in which physicians are most interested. Some of these are very uncommon (i.e. malignant hypothermia) and the system helps less experienced clinicians by suggesting this condition.
h(t ) = h0 / eb (t )/V
(
)
P 4 : SBP < 60 ∧ ( PAWP > 50 ) ∧ ( PEEP > 20 ) → alarm4
(1) (2)
2.3. Visualization and Alerts The patient state visualization system was developed using Adobe Flash (Adobe, CS 3.0) to draw the graphical interface and actionscript to implement the functionality. The interface integrates and displays the patient state, critical variables and generates alerts and alarms based on professional rules provided by experienced anesthesiologists. The system logs all alerts and alarms fired in a SQL database. Figure 3 (a) and (b) provides a screen shot of the visualization system monitoring a patient under general anesthesia in the OR. Patient registration number and patient name have been concealed for privacy. Fig 3 (a) shows a patient under normal conditions while Fig 3 (b) illustrates a patient with potential hypotension alert and high heart filling volume notification. These figures illustrate how quickly the patients physiological states can be assessed and cause for concern easily identified.
The color at the brain indicates the MAC, which is calculated by anesthesia agents, ET Sevoflurane, ET Isoflurane, ET Desflurane, ET nitrous and propofol rate [16].If the neurological monitor is being used, the column of BIS to the left of the brain will change color and a message indicating the brain states will show up to the right of the brain. (eg, BIS 40-60 is the normal range for general anesthesia, over 80 the patient may be awake.)
a)
The heart contracts with each beat and the lungs expand and retract with each breath. This provides a “live” alert that the system will immediately detects changes in heat rate and respiration rate. The trachea color indicates the PAP, and the color of the lung’s border indicated the PEEP. A gauge inside the left lung indicated the ET CO2 and the right lung shows SpO2. The heart filling volume level (high, low and normal) will be determined using one of the 1-SPV, 2-CVP, 3-PADP, 4-PAWP measurement with priority in the indicated order depending on what physiologic data is available. Otherwise, it continuously calculates the fluid balance using standard rules [17]. Outgoing fluids are insensible loss with 4:2:1 rule according to patient weight, third space loss, and urine output. Incoming fluids contain blood, colloid, crystalloid by all the incoming and outgoing fluids. The color of aorta that is connected to the right of the heart indicates the SBP which determines the hypotension and hypertension states of patients. Table 1. Alerts, notifications and reminders.
b) Figure 3. Visualization and user interface illustrating, a) Patient in stable condition, b) Interface showing adverse patient event. The graphical interface can be divided into two regions: on the left with the gray background is the case information, including: patient registration number, name, location, surgical duration, NPO time, estimated blood loss, body weight, third space loss. Third space loss and NPO time can be input into the interface for calculation of heart filling volume which is displayed as the area inside the heart that is filled. NPO defaults to midnight the night before surgery and surgical third space loss defaults to moderate. The main display area on the right can be divided into brain, lungs, heart and body. The “normalize volume” button zeros the offset used to calculate heart volume in spite of previous heart filling history. All real-time variables displayed contain the corresponding measured value and time difference between the last update and current time (dt),. If dt is too large, then the values displayed will be replaced with a message indicating the variable is no longer available (i.e. “No BP”). If an alert is fired, a clear message will appear together with the alarm tone to draw the attention of the physician. The “reset” button acknowledges all alarms that are currently activated. When an alarm is active, an alert tone is sounded once to attract the physician’s attention. The physician can silence the alarm or resume it, by pressing the “silence” button. If the cause of the alarm is not addressed, the alarming tone will repeat automatically in a minute.
#
ALARMS
#
ALARMS
1
Ischemia
13
Peak airway pressure
2
Bronchospasm
14
SpO2
3
Airway Disconnect
15
Body temperature
4
Tension Pneumothorax
16
Hematocrit
5
Cardiac Arrest
17
Estimated Hematocrit
6
Potential Hypotension
18
Glucose
7
Malignant Hyperthermia 19
PEEP
8
BIS
20
Creatinine (renal failure)
9
MAC
21
Glucose infusion
10
Systolic BP
22
Urine output
11
Heart filling volume
23
CO2 rebreathing
12
ET CO2
24
No BP cuff measurement
On the bottom is the body part, containing the variables and lab values for the whole body. Temperature, hematocrit, estimated hematocrit and glucose are shown with color coded bars indicating whether they are within normal limits. Creatinine and urine output are displayed below left and right kidneys respectively. If they are unavailable, the kidneys will turn grey. The three values beside the right kidney are urine output, per hour value and per hour per kilogram value. The system can automatically configure alarms and display contextually by surgical milestone or time point in the
database. The alerts only fire during the effective surgical time period: from patient verification to post anesthesia care unit bed requested. After bed requested, the heart and lungs will stop moving and all the alerts are disabled. However, the notifications of variables are still displayed until the patient is moved out and transferred to PACU. At this point the system will automatically return to the login page. All the alerts, notifications that exceed the normal limits as well as reminders generated during the surgery, are sent to the Java server which stores then in a SQL server for future analysis. 3. SYSTEM A,ALYSIS Since the system is currently operational, the next phase of this research is to evaluate the performance and fine-tune each rule. These data can be used to optimize the alerts and information provided to the clinician to enhance the system’s accuracy, sensitivity, specificity and support of the physicians. A large scale retrospective analysis of 60,000 general anesthesia cases was performed to develop a baseline to compare the performance of the potential hypotension rule and its ability to correctly classify various patient conditions. For this study hypotension is defined as a SBP lower than 80mmHg. One advantage of studying this rule first is that it is one of the most common alerts, and the performance of the alert can be readily determined. This allows a quality dataset to be obtained from the Centricity EMR, without large amounts of time spent in manual chart reviews. Fundamentally, this rule uses the most recent two SBP measurements and based on the slope, predicts the next SBP. If this prediction is below a certain threshold, and the inspired anesthesia agents do not decrease, the “potential hypotension” alert will be issued to the anesthesiologist. For this study, the dependent variables will be: frequency and duration of hypotension below 80, 70, 60, 50 and 40 mmHg, as well as the time to treat. Only general anesthesia cases with BP cuff measurements will be utilized and each of the cases will be evaluated from the time of first BP to the last BP. The standard of care is that a BP cuff measurement should be taken every 5 minutes. Cardiac and electroshock therapy (ECT) cases, cases with ASA 5 or 6, or patients younger than 18 years will not be included. Only cases where isoflurane, sevoflurane or desflurane are used will be evaluated as the inspired anesthetic agent concentration will be used to determine time to treat a condition of hypotension. The concentration of anesthetic agent delivered to the patient and inspired is automatically recorded in the Centricity EMR, however infusion of drugs is a manual process and only occurs once the anesthesiologist has time to update the anesthesia record. By analyzing the SBP and concentration of inspired anesthetic agent, we are able to determine time to treat patient hypotension. After the potential hypotension alert or hypotension has been activated, a search was performed for a reduction of 0.1% of the inspired anesthetic agent as a sign that treatment has begun. An additional parameter that was recorded is the frequency and late or delayed cuff BP measurements. It is the
policy to take a cuff BP reading every 5 minuites, however due to patient care related distractions or other tasks, this interval may be lengthened. A delayed measurement is defined as no BP reading from 6-10 min and late is defined as no reading for greater than 10 min-15 min. We also determine the number of readings taken after an interval of 15 min. Ten alarms are defined as the objective functions which will be searched for and are shown in Table 2. A Java based rule processing engine using the same techniques as the clinical system was used to perform the retrospective processing. This program implements queries for each 30s time interval from the time when the first BP is available to the time of last BP. Using this data we are able to evaluate the performance of the potential hypotension alert and further optimize the alert algorithm. Our aim is to reduce the frequency and duration of hypotension, as well as the amount of drugs used to treat this condition, also lapses in BP. A prospective trial will need to be performed to determine the effect on patient care and outcomes. Table 2. Hypotension occurrence for retrospective analysis.
Alert rule
Cases
% of total cases
SBP