Autoimmunity, June 2011; 44(4): 1–11 q Informa UK, Ltd. ISSN 0891-6934 print/1607-842X online DOI: 10.3109/08916934.2010.523260
Reactive animation: From piecemeal experimentation to reactive biological systems ODED VAINAS1, DAVID HAREL2, IRUN R. COHEN3, & SOL EFRONI1 The Mina & Everard Goodman Faculty of Life Sciences, Bar Ilan University, Ramat Gan, Israel, 2Department of Computer Science and Applied Mathematics, Weizmann Institute of Science, Rehovot, Israel, and 3Department of Immunology, Weizmann Institute of Science, Rehovot, Israel Autoimmunity Downloaded from informahealthcare.com by 93.173.184.245 on 01/21/11 For personal use only.
1
Abstract Over the past decade, multi-level complex behavior and reactive nature of biological systems, has been a focus point for the biomedical community. We have developed a computational approach, termed Reactive Animation (RA) for simulating such complex biological systems. RA is an approach for describing the dynamic characteristics of biological systems based on facts collected from experiments. These data are integrated bottom-up by computational tools and methods for reactive systems development and are simulated concomitantly to a front-end user friendly visualization and reporting systems. Using RA, the experimenter may intervene mid-simulation, suggest new hypotheses for cellular and molecular interactions, apply them to the simulation and observe their resulting outcomes “on-line”. Several RA models have been developed including models of T cell activation, thymocyte development and pancreatic organogenesis, which are describe in the in this review.
Keywords: Reactive animation, complex systems, computational models, systems biology, statecharts, simulation, thymus, pancreas, T cell activation
Reactive biological systems Biological systems orchestrate multilevel complex behavior into an intuitively friendly format. In biological systems, most processes take place in a concurrent and a distributed fashion. These processes are under varying levels of control, react to multiple events, and interact over multiple levels, signals, and conditions. Such systems answer the definition of Reactive Systems [1]. The biomedical community has been investing tremendous efforts to understand biological systems through numerous experiments, each designed to learn about a different piece in the puzzle. Data have accumulated, and continue to accumulate at an ever-growing rate, due much to the development of high-throughput machinery and other cutting-edge technologies. The results and the conclusions of these experiments are collected into databases of facts, where each fact may describe a snapshot of a biological system, from a genetic, molecular, biochemical, cellular, tissue, or an organ point of view. The snapshot nature of such research slights the dynamic quality of the system.
We have developed a computational approach for simulating complex biological systems and termed this approach reactive animation (RA; [2,3]). RA facilitates the simulation of complex biological systems and is built in two main layers: the first layer allows a bottom-up integration of discrete multilevel experimental data of the interacting agents (cells and molecules), and defines the logic and dynamics behind these interactions. This layer is composed of powerful tools and methods for reactive systems development, such as the visual language Statecharts [4], which allows a rigorous specification of the system’s reactivity (of course, other agent-based modeling (ABM; [5]) approaches can be integrated to that layer). The second layer is a front-end visualization of the simulation, capable of real-time interactive manipulation of the simulated biological objects. RA allows the experimenter to intervene mid-simulation, suggests new hypotheses for cellular and molecular interactions, applies them to the simulation, and observes their resulting outcomes “online”. In addition to the main layers, intermittent layers
Correspondence: S. Efroni, The Mina & Everard Goodman Faculty of Life Sciences, Bar Ilan University, Ramat Gan, Israel. E-mail:
[email protected]
Autoimmunity Downloaded from informahealthcare.com by 93.173.184.245 on 01/21/11 For personal use only.
2
O. Vainas et al.
can be incorporated into the simulation to allow various data mining and visualization, statistical analysis, and reports [6,7]. It is important to emphasize that RA is not simply a new way to animate biological phenomena. RA employs a dynamic user interface and animates or dynamically redesigns these user interfaces to represent the system and its operational behavior realistically. The powerful animation tools that can be incorporated in the second layer of RA represent the specifications of the simulations in an intuitive, controllable, animated front end and are an essential bridge between experimental biologists and computer scientists and engineers [2]. Often, mathematical models are used to describe the relationships between biological quantities and their change over time through equations (usually differential equations). Mathematical models can successfully describe biological systems, but require the user to think in terms of rate constants and kinetics, and often represent average or qualitative behavior of biological entities (cell populations, ligands, receptors, etc.). Moreover, as the complexity of the modeled biological system increases, mathematical modeling necessitates more complicated mathematical terms and representations, which in turn may hinder their mathematical analysis and their biological relevance. In contrast to mathematical models, a computational model is a formal model that assigns a sequence of steps or instructions to be executed by a computer [8 – 10]. Computational models are often constructed through the composition of a state machine, which connects qualitative conditions (“states”) to functions [8]. One can specify a state machine by defining how, due to given inputs (the “cause”), a switch from one state to another occurs (the “effect”). Biological systems are often described in terms of “cause and effect”, and are, therefore, amenable for a computational model description [8]. Note, however, that computational models can include a very large number of states, resulting in highly complex behavior, and generally require an algorithmic approach for their analysis, such as model checking [11], rather than a mathematical analysis. In this paper, we bring out several examples of how RA has been used in modeling biological systems. These include models of T-cell activation [12], thymocyte development [6,7], and pancreatic organogenesis [13], following their order of publication. The examples illustrate the evolution of the RA modeling approach. The basic concepts and utilities of RA are summarized and explained with each example. The advantages and disadvantages of RA are discussed here.
The first layer of RA: Specifying biology with Statecharts To model biological systems in a rigorous way, we first need to specify the studied system with a well-defined modeling language, amenable to execution by a computer. As previously mentioned, computational modeling, as opposed to mathematical modeling, is based on state machines [8,10]. Unfortunately, there is a “cultural gap” between biologists and computer scientists. Biologists are historically untrained in computer science, just as computer scientists are untrained in biology. Therefore, more visual and userfriendly, yet rigorous and well-defined, modeling languages may help to introduce computational models to biologists. An intuitive visual modeling language, called “Statecharts”, was invented by David Harel in 1984 to assist in the development of the avionics system of a new aircraft [4]. The behavior of an arbitrary system, including a biological system, can be described using states and events that cause transitions between states. States may contain substates, thus enabling description at multiple levels, and zooming-in and zoomingout between levels. States may also be divided into parallel (orthogonal) states, thus modeling concurrency, allowing the system to reside simultaneously in several different states. For example, let us consider a developing T cell. This cell may express several types of molecules on its membrane such as the T cell antigen receptor (TCR) and the IL2 receptor [14]. T cells can change their location in the body to different anatomical compartments ([14] such as the blood or the lymph node (LN)). Upon activation, the T-cell can proliferate, and be found momentarily in different phases of the cell cycle, or, in other words, T cells can change their own state as a response to external stimuli [12]. Biological transitions from one state to another (expressed or unexpressed; stay at G1 phase or start cell cycle; mobilize according to a gradient, etc.) may be the result of an interaction between cells and/or molecules. In Statecharts, transitions take the system from one state to another, considering concurrency, in a manner similar to our existing concepts of biological behavior. Biologists in need of a model for biological systems and who are inexperienced in computer programming can use tools which support Statecharts-based modeling and execution that facilitates the automatic translation from Statecharts to a computer language—such a tool is Rhapsody, available from IBM [15]. In a Statecharts model that was built to simulate T-cell activation [12], the authors included the interaction between T cells and antigen presenting cells (APCs) through interactions between receptors and ligands resulting in cytokine secretion and cell replication. The model considered three concurrent states for a T cell: The immunological state (active or
Autoimmunity Downloaded from informahealthcare.com by 93.173.184.245 on 01/21/11 For personal use only.
Reactive Animation
3
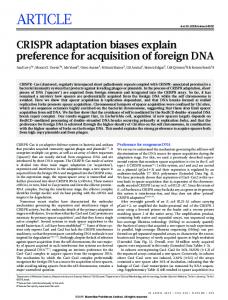
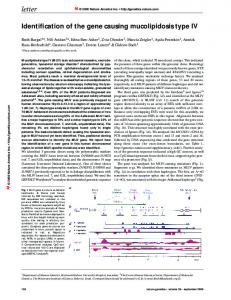
Figure 1. Statecharts realization of T-cell activation. Figure adopted from [12].
not active, consequently followed by substates of naı¨ve, memory or anergic T cells), cell cycle control (describing the phase of the cell cycle), and anatomical location (blood, LN, and the extra cellular matrix (ECM)). It should be noted that the role of the anatomical location is not to describe T-cell migration, but rather to simulate the context of the interaction between objects. Figure 1 illustrates a Statechart representation of the model of T-cell activation. The T-cell activation Statechart model exemplified two main features of reactive systems: concurrency and multiscale description. Changes in the surroundings of a cell may result in activating many parallel processes, from the cellular to the molecular level. Information processing and computation can propagate across levels. The model can be easily extended into more detailed levels, such as zooming-in to signal transduction events resulting from receptor binding, or zooming-out to account for the spatial arrangement of cells in organs. This modeling approach is based on an objectoriented design, which is likely to be intuitive to experimentalists who are accustomed to look at their systems in terms of individual objects. It can also be applied to many research fields and various organisms (Caenorhabditis elegans’ vulval development [16]).
Moreover, data are organized in an individualized manner (a single protein, a specializing cell, etc.), rather than a network of information. Therefore, objectoriented design and modeling may bridge between intuition and data catalogs, and intuitively show how single components interact to create a complex system. The second layer of RA: Front-end visualization A step forward from the model of the T-cell activation discussed previously was the addition of the second main layer of RA, the front-end visualization [6]. We exemplified this component of RA through a simulation of the maturation of T cells in the thymic lobule and the lineage choice (CD4 or CD8 T cell) [7]. This work demonstrated the dynamic relationship between molecules and cells in the thymus, consequently leading to the organ’s structural and functional properties. The thymus is the organ in which T cells mature and establish the basis for the immunological repertoire. Therefore, modeling T-cell maturation in the thymus is highly relevant to homeostasis and to disease, especially to AIDS and to autoimmune diseases [17– 19]. The thymic micro-environment is divided anatomically into lobes and lobules, and the lobules are further divided into a cortex and a medulla.
Autoimmunity Downloaded from informahealthcare.com by 93.173.184.245 on 01/21/11 For personal use only.
4
O. Vainas et al.
Stem cells arrive at the thymus from the bone marrow, and the developing T cells go through a series of interactions in different locations inside the thymus, potentially proliferating into 106 offspring cells from a single cell [20]. T-cell maturation involves many agents: epithelial cells interact with developing T cells to activate and regulate many of the processes needed for their maturation [20,21]. Macrophages perform mainly housekeeping tasks to clear the thymus of dead cells [22]. Cytokines, such as IL2, responsible for signaling between the cells [23], and chemokines and chemokine receptors, such as CCL25 and CCR9, respectively, are responsible for cell movement along gradients [24]. Peptides combined with major histocompatibility complex molecules induce different T-cell selection events [25,26]. Thymocytes (T cells in the thymus) express many different surface molecules, including CD4, CD8, both or none, which serve to interact with other cells and molecules. This biology has been specified using Statecharts, which, as mentioned previously, provides a controllable environment to process the dataset into orthogonal states and state transitions. For instance, thymocyte movement in the thymus is directed by chemokine gradients, such as CCL25 (TECK), CXCL12 (SDF), CCL22 (MDC), and CCL21 (SLC). The gradients are calculated, and the movement of a cell across the gradient is determined by its cell-surface marker expression (which correlates with its developmental stage). Seven cell markers are suggested by the literature as relevant for gradient tracing decisions. Five of them may be either expressed or unexpressed, and two of them have an intermediate level of expression termed “low”, leading to 288 optional expression states [7].
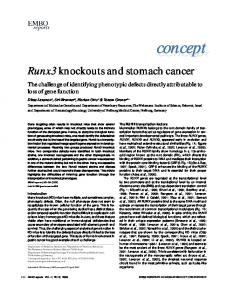
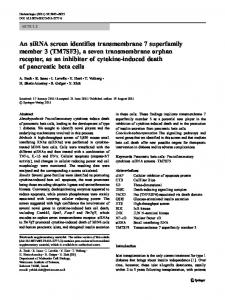
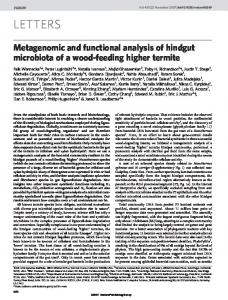
During simulation, a decision tree is used to scan through these optional expression states, and, consequently, the simulation generates events that direct the cell to the chemokine gradients it should follow. Another specification of this model involves the structure of the thymic epithelial cells, which interact with thymocytes and serve as APCs. The epithelial cells interact with thymocytes through specialized arms, and their varying length may influence thymocyte movement (see Figure 2). The front-end visualization was established in three dimensions (3D): two spatial dimensions and the dimension of time—the dynamics of the system (Figure 3(A) and (B)). Each cell was colored differently, and the thymus was divided into its main structural compartments: the cortex and the medulla. The user of the simulation has the ability to manipulate the simulation by pressing buttons on the animation screen. These buttons include performing statistical representations of the data, pausing the simulation, highlighting the chemokines, zooming-in and-out abilities and connections between the animation and simulation. In addition, the user can give different color codes relevant to the display, enabling one to trace the motion of specific cells, avoiding clutter made by overlapping cells, and to receive visual indications of interactions, and more. The time of the simulation is controlled by a clock that shows how much biological time has gone by since the onset of the simulation. RA simulation adds the dimension of time to the model and, therefore, projects the dynamical nature of the interaction of cells and molecules, based on discrete data, which give rise to the emergence of the higher scale organ seen in histologic sections (which are a 2D representation of a 3D reality). For example,
Figure 2. Specifying thymocyte development. Figure adopted from [6].
Autoimmunity Downloaded from informahealthcare.com by 93.173.184.245 on 01/21/11 For personal use only.
Reactive Animation
Figure 3. RA visualization layer. The utilities of the visualization layer (A) are described in detail in (B). Figure adopted from [7].
5
Autoimmunity Downloaded from informahealthcare.com by 93.173.184.245 on 01/21/11 For personal use only.
6
O. Vainas et al.
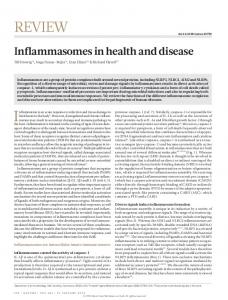
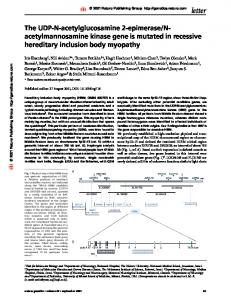
Figure 4. Histological data emerge from RA. (A) targeted CXCR4 gene deletion. (B) control. Figure adopted from [7].
targeted gene deletion of a chemokine receptor involved in cell-migration in the thymus, CXCR4 [27], resulted in intact cortical localization and developmental arrest. Figure 4(A) (left) shows the thymic lobule as it was captured under the microscope (described in [27]) and as it is captured during RA
simulation (right). In both cases, thymocytes do not respond to CXCR4 stimulation, and thymocyte development gets hung up close to the cortico – medulary junction in the DN1 stage (labeled red). Figure 4(B) shows an anatomical section in a wild-type thymus in which the double-positive cells (blue cells in the simulation) have spread into the cortex. Every object in the animation can display a clickable menu, enabling data manipulation and data requests. For example, the user can notify the simulation that a specific cell can perform apoptosis. The results of apoptosis are performed in the simulation itself, i.e. a thymocyte is deleted from the simulation (Figure 5(A)). Events thus can be specified and manipulated both from the user interface and directly from the simulation. The user can retrieve data, which do not direct or drive the simulation. For instance, the user can extract the developmental stage of a thymocyte, denoted by its surface markers, through a diagram that describes the path of development that thymocytes go through in the thymus as reported in the literature (Figure 5(A)). The diagram that opens in response to the click indicates graphically which developmental stage the thymocyte currently is in. The publications that provide the factual basis for this diagram can also be presented to the user. The amino acid sequence of the TCR can also be shown to the user (Figure 5(A)). Experimentalists often observe the end result of a process they are interested in. Sometimes, several paths may potentially lead to the same output, and, therefore, several theories may explain these outputs. One of the advantages of a model, whether computational or mathematical, is the ability to examine hypotheses or
Figure 5. Theories can be selected by the user before and during the simulation.
Autoimmunity Downloaded from informahealthcare.com by 93.173.184.245 on 01/21/11 For personal use only.
Reactive Animation theories. In the RA works of Efroni colleagues, biological objects were modeled with the option to instantiate different theories from a collection of available theories for an interaction before and during the simulations. For example, the user can change the ability of a cell to migrate to any of the chemokines upon clicking the cell object in the animation and mark in the checkbox table in the clickable submenu (Figure 5(B) and (C)). Then, the animation sends an event to the simulation. The simulation accordingly does two things: it notifies the cell that it may then migrate according to the chemokine selected by the user, and it informs the animation that the thymocyte should then indicate that it is susceptible to that chemokine. These theories describing interactions are interchangeable, and some cells may follow one theory, whereas all the others may follow a different theory. The choice between theories can also be made at run time by the simulation itself, when the right conditions develop. Note, however, that the interpretation of the simulation results is the responsibility of the user scientist. RA’s interactive nature makes it possible to knock out molecules or cells and observe the effects. Each knockout influences the resulting thymus morphology in a different way, a phenomenon that RA makes visible quite effectively. For instance, RA simulation suggested that the lack of phenotype observed in mice with CCR9 knocked out (CCR9 2 /2 ) might be explained by dynamic compensation through population pressure. RA simulation also explains the competitive growth advantage enjoyed by wild-type cells over CCR9 2 /2 cells. Indeed, over-expression of CCR9 on thymocytes leads to an in vivo phenotype that can be explained by RA as an early attraction of the thymocytes by cortical epithelial cells. RA simulation also suggests that the absence of thymic output resulting from CXCR4 inhibition can be attributed to the non-migratory behavior of cells entering the thymus. Another interesting observation from the RA simulation is the instrumental role of cell competition during thymocyte development. This competition is actually a life-or-death matter: during development, thymocytes require suitable stimulation by epithelial cells for preventing their death. As the thymus is packed with full of cells, there is a constant competition among thymocytes for space and stimulation, which has not been a subject for experimentation thus far. This competition between individual thymocytes for productive interactions with thymic epithelial cells, not seen in static histologic sections, emerged from the model’s simulation and was not programmed in advance. By changing the parameters of the model, the authors suggested that thymocyte competition might function as an important factor in three emergent properties of T-cell maturation: the functional anatomy of the thymus, the
7
selection of thymocytes with a range of migratory velocities, and the relative prevalence of single positive CD4 T cells. Another model, described in Swerdlin et al. [28], showed the use of RA and its two main layers applied to describe the spatial and the temporal behavior of the LN, and its interaction with B cells and their behavior within the LN. Similar to the RA model of thymocyte development [6,7], the simulations of the LN-B-cell RA model resulted in emergent properties of the LN, which rose from the piecemeal integration of experimental data. The authors reported the dynamic cellular composition of the various anatomic compartments of a LN that hosts a cohort of reacting B cells toward the generation of antibody-producing plasma cells and memory B cells. For mode details, see [28] Dimensional realistic modeling with RA An RA model that covers the primary stages of pancreatic organogenesis in the mouse was developed by Setty et al. [13]. Similar to the RA model that was constructed to simulate thymocyte development [6,7], their approach integrated static experimental data into a Statechart-based reactive model, linked to an animation layer and a mathematical interface for analysis. The main difference, however, from the approach taken in [6,7], is that the visualization layer generated the simulation in 3D animation. This addition to the RA model allowed the authors to formulate hypotheses about the structural characteristics of pancreatic organogenesis and provided an extended dynamic description of the system, which resulted in visual resemblance to developmental histology of the pancreas. In the pancreas organogenesis RA model, a cell was defined as an autonomous entity that senses the factors in its near environment surrounding the pancreas, which supplies important inducer signals. In mice, pancreatic organogenesis is initiated on the eighth embryonic day, and is roughly divided into two transitions, primary and secondary [29]. During the primary transition, cells at the appropriate regions of the flat gut are specified as pancreatic and form a bud; during the secondary transition, the bud evolves to become a lobulated structure [30]. The organogenesis process terminates when endocrine cells aggregate to form many sphere-like endocrine tissues, the islets of Langerhans, embedded within the exocrine pancreas. The pancreas develops simultaneously from a ventral site and a dorsal site; during organogenesis the ventral pancreas associates with the significantly larger dorsal pancreas. The ECM plays a critical role in pancreatic organogenesis by generating signals that trigger intracellular processes, such as gene expression [31,32]. These intracellular processes govern cell
Autoimmunity Downloaded from informahealthcare.com by 93.173.184.245 on 01/21/11 For personal use only.
8
O. Vainas et al.
Figure 6. Specification for an autonomous cell.
function and cell migration; for example, two external signals from the notochord, such as activinb and FGF2, both together direct endodermal cells toward a pancreatic fate specification. These signals inhibit expression of proteins that repress the expression of the pancreatic marker, Pdx1, and the absence of one of them from the notochord results in the loss of pancreatic specification. Pancreatic organogenesis depends on simultaneous interactions across molecular and morphogenetic scales, which decisively affect each other [13]. The specification of the basic element of the pancreatic organogenesis RA model, the autonomous cell, included two distinct cellular compartments: nucleus and membrane. Two concurrent components, the cell cycle and differentiation processes, were also specified within the cell object. The nucleus compartment specifies gene expression in a discrete fashion (expressed or unexpressed), whereas the membrane object specifies the response to external stimulations via receptor interactions with a ligand (bound or unbound). The membrane compartment also includes a motion compartment, which senses the 3D environment and causes the cell to move according to external signals (Figure 6). The ECM was represented as a 3D grid that overlays the pancreatic tissue. The notochord, aorta, and mesenchyme were defined as objects, and their behavior was specified based on the literature. These tissues are known to promote early stages of pancreatic development by secreting factors in the ECM; their concentrations were stored in the ECM grid and could be updated by the different tissue objects (Figure 7). The emerging pancreatic organogenesis qualitatively reproduced structures similar to those as seen in histology experiments: it starts from a flat sheet of cells
and evolves to a lobed structure through budding and branching processes (Figure 8). The simulation gave rise to an emergent property that corresponds well with the primary transition clusters appearing early in the developing organ in vivo [30,33,34], although the authors had not explicitly programmed the RA model
Figure 7. Specifying pancreatic organogenesis. (A) the biology, (B) the modeled objects.
Autoimmunity Downloaded from informahealthcare.com by 93.173.184.245 on 01/21/11 For personal use only.
Reactive Animation
9
Figure 8. Pancreatic organogenesis (left) and its emergence from the RA model (right).
to do so. Furthermore, the simulations reproduced results similar to in vivo ablation experiments of tissues surrounding the pancreas, thus providing a dynamic analysis for the “wet-lab” experiments. Conclusions and discussion RA modeling provides an integrated view of a complex process that we usually analyze through snapshots, derived by experiments. This integration allows experimentalists to understand how details at one scale—genetic, molecular, intra- and inter-cellular, environmental, organ-dependant, etc.—affect other scales. Moreover, RA allows the understanding of how an organ structure and environment can determine molecular interactions and, vice versa, how molecular interactions can determine the emergence of structure and environment in 3D. The dynamics of a biological system is visually traceable, enabling the user of RA to perform in silico experiments to better understand complex biological systems. Hypotheses can be formulated and examined before and during the simulation to explore the interplay between multiscale agents in health and disease. The simulations can help in directing the experimenter toward a more decisive experiment and thereby save time, resources, and animal manipulations.
The collection of individual data precedes their application to RA simulation. Most often, some of the required data for constructing a precise model are lacking, and, therefore, our awareness is directed to previously unconsidered key experimental inquiries or questions that were not believed worthwhile to ask. The RA models presented in this paper describe in a multiscale fashion the dynamic behavior of biological systems. However, when discussing molecular events, these models do not include a detailed description of molecular signaling networks, but rather utilize simple input-output relationships between molecules. A platform providing the ability to model biological signaling networks is Simmune [35,36]. Simmune facilitates the design and simulation of complex signaling pathways due to chemosensing, based on the definition of specific molecular bindingsite interactions and the subcellular localization of molecules. The molecular interactions are translated into spatially resolved simulations via a dynamic graphical output. Amongst RA and Simmune, other successful computational platforms for modeling the immune system, such as IMMSIM [37 – 40] or signaling pathways, for example, Qualitative Networks [41], have been previously provided. No matter what computational modeling approach is taken, RA or others, they all require the understanding
10
O. Vainas et al.
of the underlying biology of a system capabilities of models and the questions answer. Therefore, mutual work between and modelists should be encouraged to well-supported and validated models
and the they can biologists construct
Acknowledgements
Autoimmunity Downloaded from informahealthcare.com by 93.173.184.245 on 01/21/11 For personal use only.
David Harel is the William Sussman Professor in the Department of Computer Science and Applied Mathematics at the Weizmann Institute of Science. Irun R. Cohen is Professor of Immunology, Emeritus at the Weizmann Institute of Science. Sol Efroni and Oded Vainas are at the Mina and Everard Goodman Faculty of Life Science, Bar Ilan University. Declaration of interest: The authors report no conflicts of interest. The authors alone are responsible for the content and writing of the paper. References [1] Cohen IR, Harel D. Explaining a complex living system: Dynamics, multi-scaling and emergence. J R Soc Interface 2007;4:175 –182. [2] Efroni S, Harel D, Cohen IR. Reactive animation: Realistic modeling of complex dynamic systems. IEEE Comput 2005; 38:38–47. [3] Harel D, Efroni S, Cohen IR. Reactive Animation, Proc. 1st Int. Symposium on Formal Methods for Components and Objects (FMCO 2002) (invited paper), Lecture Notes in Computer Science, Vol. 2852, Leiden, The Netherlands: Springer-Verlag; 2003. p 136 –153. [4] Harel D. A Statecharts: Visual formalism for complex systems. Sci Comput Program 1987;8:231 –274. [5] Bauer AL, Beauchemin CA, Perelson AS. Agent-based modeling of host-pathogen systems: The successes and challenges. Inf Sci (NY) 2009;179:1379– 1389. [6] Efroni S, Harel D, Cohen IR. Toward rigorous comprehension of biological complexity: Modeling, execution, and visualization of thymic T-cell maturation. Genome Res 2003;13: 2485–2497. [7] Efroni S, Harel D, Cohen IR. Emergent dynamics of thymocyte development and lineage determination. PLoS Comput Biol 2007;3:e13. [8] Fisher J, Henzinger TA. Executable cell biology. Nat Biotechnol 2007;25:1239– 1249. [9] Fisher J, Piterman N. The executable pathway to biological networks. Brief Funct Genomics 2010;9:79– 92. [10] Sadot A, Fisher J, Barak D, Admanit Y, Stern MJ, Hubbard EJ, Harel D. Toward verified biological models. IEEE/ACM Trans Comput Biol Bioinform 2008;5:223–234. [11] Clarke EM, Grumberg O, Peled D. Model checking. Cambridge, Mass: MIT Press; 1999. [12] Kam N, Cohen IR, Harel D. The immune system as a reactive system: Modeling T cell activation with Statecharts, Proceedings of Visual Languages and Formal Methods (VLFM’01), part of IEEE Symposium on Human-Centric Computing (HCC’01). 2001;15 –22. [13] Setty Y, Cohen IR, Dor Y, Harel D. Four-dimensional realistic modeling of pancreatic organogenesis. Proc Natl Acad Sci USA 2008;105:20374– 20379. [14] Janeway C. Immunobiology: The immune system in health and disease. 6th ed. New York: Garland Science; 2005. [15] Harel D, Gery E. Executable object modeling with statecharts. Computer IEEE Press 1997;30:31 –42.
[16] Fisher J, Piterman N, Hubbard EJ, Stern MJ, Harel D. Computational insights into Caenorhabditis elegans vulval development. Proc Natl Acad Sci USA 2005;102:1951– 1956. [17] Cohen IR. Tending Adam’s garden: Evolving the cognitive immune self. London, UK: Academic Press; 2000. [18] Douek DC, Betts MR, Hill BJ, Little SJ, Lempicki R, Metcalf JA, Casazza J, Yoder C, Adelsberger JW, Stevens RA, Baseler MW, Keiser P, Richman DD, Davey RT, Koup RA. Evidence for increased T cell turnover and decreased thymic output in HIV infection. J Immunol 2001;167:6663 –6668. [19] Holoshitz J, Matitiau A, Cohen IR. Role of the thymus in induction and transfer of vaccination against adjuvant arthritis with a T lymphocyte line in rats. J Clin Invest 1985;75: 472– 477. [20] Anderson G, Jenkinson EJ. Lymphostromal interactions in thymic development and function. Nat Rev Immunol 2001;1: 31–40. [21] Germain RN. T-cell development and the CD4 –CD8 lineage decision. Nat Rev Immunol 2002;2:309– 322. [22] Platt N, Suzuki H, Kurihara Y, Kodama T, Gordon S. Role for the class A macrophage scavenger receptor in the phagocytosis of apoptotic thymocytes in vitro. Proc Natl Acad Sci USA 1996;93:12456–12460. [23] Benczik M, Gaffen SL. The interleukin (IL)-2 family cytokines: Survival and proliferation signaling pathways in T lymphocytes. Immunol Invest 2004;33:109–142. [24] Wurbel MA, Philippe JM, Nguyen C, Victorero G, Freeman T, Wooding P, Miazek A, Mattei MG, Malissen M, Jordan BR, Malissen B, Carrier A, Naquet P. The chemokine TECK is expressed by thymic and intestinal epithelial cells and attracts double- and single-positive thymocytes expressing the TECK receptor CCR9. Eur J Immunol 2000;30:262–271. [25] Nanda NK, Sercarz EE. The positively selected T cell repertoire: Is it exclusively restricted to the selecting MHC? Int Immunol 1995;7:353 –358. [26] Yasutomo K, Lucas B, Germain RN. TCR signaling for initiation and completion of thymocyte positive selection has distinct requirements for ligand quality and presenting cell type. J Immunol 2000;165:3015–3022. [27] Plotkin J, Prockop SE, Lepique A, Petrie HT. Critical role for CXCR4 signaling in progenitor localization and T cell differentiation in the postnatal thymus. J Immunol 2003;171: 4521–4527. [28] Swerdlin N, Cohen IR, Harel D. The lymph node B cell immune response: Dynamic analysis in-silico. Proc IEEE Special Issue Comput Syst Biol 2003;96:1421–1443. [29] Pictet RL, Clark WR, Williams RH, Rutter WJ. An ultrastructural analysis of the developing embryonic pancreas. Dev Biol 1972;29:436–467. [30] Jensen J. Gene regulatory factors in pancreatic development. Dev Dyn 2004;229:176–200. [31] Hogan KA, Bautch VL. Blood vessel patterning at the embryonic midline. Curr Top Dev Biol 2004;62:55– 85. [32] Lammert E, Cleaver O, Melton D. Induction of pancreatic differentiation by signals from blood vessels. Science 2001; 294:564– 567. [33] Herrera PL. Adult insulin- and glucagon-producing cells differentiate from two independent cell lineages. Development 2000;127:2317–2322. [34] Kim SK, MacDonald RJ. Signaling and transcriptional control of pancreatic organogenesis. Curr Opin Genet Dev 2002;12: 540– 547. [35] Meier-Schellersheim M, Klauschen F, Angermann B. Computational modeling of signaling networks for eukaryotic chemosensing. Methods Mol Biol 2009;571:507 –526. [36] Meier-Schellersheim M, Xu X, Angermann B, Kunkel EJ, Jin T, Germain RN. Key role of local regulation in chemosensing revealed by a new molecular interaction-based modeling method. PLoS Comput Biol 2006;2:e82.
Reactive Animation
Autoimmunity Downloaded from informahealthcare.com by 93.173.184.245 on 01/21/11 For personal use only.
[37] Castiglione F, Bernaschi M, Succi S. Simulating the immune response on a distributed parallel computer. Int J Mod Phys C 1997;8(3):527– 545. [38] Celada F, Seiden PE. A computer model of cellular interactions in the immune system. Immunol Today 1992; 13:56–62. [39] Cheng Y, Ghersi D, Calcagno C, Selin LK, Puzone R, Celada F. A discrete computer model of the immune system reveals competitive interactions between the humoral and
11
cellular branch and between cross-reacting memory and naive responses. Vaccine 2008;27:833–845. [40] Seiden PE, Celada F. A model for simulating cognate recognition and response in the immune system. J Theor Biol 1992;158:329–357. [41] Schaub MA, Henzinger TA, Fisher J. Qualitative networks: A symbolic approach to analyze biological signaling networks. BMC Syst Biol 2007;1:4.