Injection of supercritical carbon dioxide (CO2) into formations containing carbonate .... The operating splitting scheme solves the reactive species transport ...
Available online at www.sciencedirect.com
Energy Procedia
Energy Procedia 1 (2009) 00 3283–3290 Energy Procedia (2008) 000–000 www.elsevier.com/locate/XXX www.elsevier.com/locate/procedia
GHGT-9
Reactive Transport Modeling of CO2 and SO2 Injection into Deep Saline Formations and Their Effect on the Hydraulic Properties of Host Rocks Diana H. Bacona, Bruce M. Sassb, Mohit Bhargavab, Joel Sminchakb, and Neeraj Guptab* a
Battelle Pacific Northwest Division, Richland, Washington, USA b Battelle, Columbus, Ohio, USA
Elsevier use only: Received date here; revised date here; accepted date here
Abstract Injection of supercritical carbon dioxide (CO2) into formations containing carbonate minerals may affect the porosity and permeability of the host rock and overlying caprock due to dissolution of the primary carbonate minerals and possible precipitation of secondary minerals. Simulations of pilot-scale CO2 injection with co-sequestration of sulfur dioxide (SO2) were conducted to assess the competing effects of dolomite dissolution and anhydrite precipitation on formation hydraulic properties. A geochemical model of two promising host formations in the midwestern United States (Rose Run and Copper Ridge) was developed for the purpose of assessing mineral dissolution and precipitation effects on injectivity and containment. c 2009 Elsevier Ltd. Open access under CC BY-NC-ND license.
Keywords: carbon sequestration; numerical model; reactive transport; geochemical reactions; porosity change.
1. Introduction 1.1. Background Numerical simulations of carbon dioxide (CO2) injection were conducted as part of a program to assess the potential for geologic sequestration in deep geologic reservoirs—the Rose Run formation and the Copper Ridge formation—at the American Electric Power (AEP) Mountaineer Power Plant in West Virginia. AEP’s Mountaineer Power Plant and its vicinity in the Appalachian Basin have been characterized for geologic sequestration potential through drilling and testing in a 2801 m deep well [1]. Site characterization data have been used to simulate CO2 injection under several scenarios, such as vertical and horizontal wells, full-scale and small-scale injection, injection pressure variations, and two- or three-dimensional model configurations [2]. Reservoir tests at the site suggest that the Rose Run sandstone and portions of the Copper Ridge dolomite are potential storage reservoirs, and that they are conducive to hydraulic fracturing to further increase injectivity. Injection of supercritical CO2 into formations containing carbonate minerals may affect the porosity and permeability of the host rock and overlying caprock due to dissolution of the primary carbonate minerals and possible precipitation of secondary minerals. For this paper, simulations of pilot-scale CO2 injection with co-sequestration of sulfur dioxide (SO2) were conducted to assess to the competing effects of dolomite dissolution and anhydrite precipitation on formation hydraulic properties. A
doi:10.1016/j.egypro.2009.02.114
3284
D.H. Bacon et al. / Energy Procedia 1 (2009) 3283–3290 Bacon/ Energy Procedia 00 (2008) 000–000
reactive transport model of the Rose Run and Copper Ridge was developed for the purpose of assessing mineral dissolution and precipitation effects on injectivity and containment. 1.2. Rose Run Formation Intrinsic Permeability
Porosity
14%
10
12%
1
10%
0.1
8%
0.01
6%
0.001
4%
0.0001
2%
0.00001 2350
2360
2370 True Depth, m bKB
2380
Porosity
100
Permeability, mD
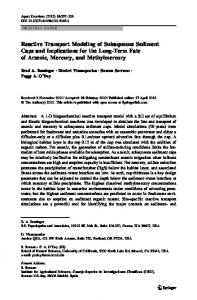
Wireline logs and core samples [3] from the Rose Run formation showed a higher porosity and permeability zone approximately 4.3 m thick, between 2357 to 2361 m true depth below Kelly Bushing (bKB) (Figure 1). The Kelly Bushing on the drilling platform was 5.5 m above the ground surface. The Rose Run formation extends over an interval of 35.4 m, but core samples above 2357 m (true depth) show intrinsic permeabilities below 0.001 mD. In the interval of 2361 to 2398 m bKB, core samples show generally lower intrinsic permeabilities, with isolated values reaching 4 mD and a single high value of 35 mD.
0% 2390
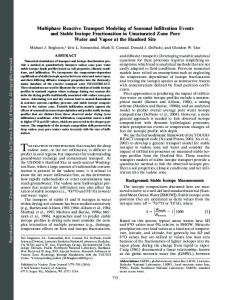
Figure 1. Porosity and Permeability from Wireline Log and Core Schlumberger’s Elemental Analysis (ELAN) of Samples of the Rose Run Formation the well logs was performed to evaluate the mineral proportions in the open hole boring interval. ELAN uses a matrix inversion technique to find a volumetric solution matching predefined sets of minerals and fluids with input logging curves based on response equations. In the Rose Run formation (Figure 2), dolomite is the predominant mineral, except in the sandy layers, where quartz is the most prevalent mineral. Significant amounts of illite and anhydrite are present, likely as secondary minerals, with lesser amount of calcite in some intervals. Pyrite is not present in significant quantities.
Relative Volume
1 Two 600 mL downhole hydrochemical samples 0.9 were collected in the Rose Run formation on March 0.8 20, 2004. An activated-valve, downhole Kuster sampling device was lowered to a depth of 2281 m 0.7 Anhydrite Calcite within the test tubing string. This sampling depth 0.6 Dolomite was approximately 250 above the top packer setting 0.5 Illite used to isolate the Rose Run test interval. The fluid 0.4 Pyrite Quartz within the test tubing was swabbed down to a depth 0.3 of ~305 m. The downhole Multi-Flow Evaluator 0.2 (MFE) shut-in tool was then opened, causing the 0.1 inflow of Rose Run formation fluid into the test 0 2350 2360 2370 2380 2390 tubing system. After ~70 min of inflow, the True Depth, m bKB sampling vessel was lowered by wireline to the targeted 2281 m depth. The downhole Kuster Figure 2. Mineral Proportions from ELAN Analysis of Wireline Log of sampling valves were activated using a clock/timer the Rose Run Formation system. The swab/sampling event was repeated a second time, with inflow to the test tubing and downhole sampling. The samples were labeled Rose Run formation fluid #1 and #2 (Table 1).
1.3. Copper Ridge Formation Wireline log data [3] from the Copper Ridge formation (Figure 3) showed a higher porosity and permeability zone approximately 15 m thick, between 2477 to 2492 m (true depth below ground surface). This high-porosity
3285
D.H. Bacon et al. / Energy Procedia 1 (2009) 3283–3290 Bacon/ Energy Procedia 00 (2008) 000–000
zone, named the B-zone, also appears in the Bakerwell No. 1 Jarrell well in Gallia County, Ohio, but with considerably greater thickness [3]. ELAN analysis of the well logs indicates that the Copper Ridge formation is predominantly composed of dolomite, with secondary amounts of anhydrite, calcite, illite, and quartz (Figure 4). B-Zone
Table 1. Results of Inorganic Analyses for March 2004 Downhole Sampling Event
Effective Porosity Less Irreducible Water
2359
Mg
125
124
Al
0.0003
0.0004
SiO2
0.12
0.1
K
467
440
Ca
756
742
Mn
0.04
0.04
Fe
0.01
0.01
Cl
3526
4701
SO4
1.65
1.82
HCO3
2.2
2.25
2. Methods
25% 20%
10 15% 1
Porosity
2399
Permeability, mD
Na
10% 0.1
0.01 2455
5%
2475
2495 True Depth, m bgs
2515
0% 2535
Figure 3. Porosity and Permeability from Wireline Log of the Copper Ridge Formation 1.2 1
Relative Volume
Rose Run Formation Fluid #2(mmol/kg unfiltered)
30%
Intrinsic Permeability 100
Rose Run Formation Fluid #1(mmol/kg unfiltered)
Analyte
Hydraulic Test Interval
0.8 0.6 0.4
Anhydrite Calcite Dolomite Illite Pyrite Quartz
0.2 Numerical simulation of CO2 injection into deep geologic reservoirs requires modeling complex, 0 coupled hydrologic, chemical, and thermal 2455 2475 2495 2515 processes, including multi-fluid flow and transport, True Depth, m bgs partitioning of CO2 into the aqueous phase, and Figure 4. Mineral Proportions from ELAN Analysis of Wireline Log of chemical interactions with aqueous fluids and rock the Copper Ridge Formation minerals. The simulations conducted for this investigation were executed with the STOMP-WCS-R (water, CO2, salt and reactions) simulator [4]. STOMP was verified against other codes used for simulation of geologic disposal of CO2 as part of the GeoSeq code intercomparison study [5], and was used in previous investigations of CO2 injection potential at this site [6].
Partial differential conservation equations for fluid mass, energy, and salt mass comprise the fundamental equations for STOMP-WCS-R. Coefficients within the fundamental equations are related to the primary variables through a set of constitutive relations. The conservation equations for fluid mass and energy are solved simultaneously, whereas the salt transport equations are solved sequentially after the coupled flow solution. The fundamental coupled flow equations are solved following an integral volume finite-difference approach with the nonlinearities in the discretized equations resolved through Newton-Raphson iteration. The dominant nonlinear functions within the STOMP simulator are the relative permeability-saturation-capillary pressure (k-s-p) relations. The STOMP simulator allows the user to specify these relations through a large variety of functions. Two-phase (gas-aqueous) k-s-p relations can be specified with hysteretic or nonhysteretic functions or nonhysteretic tabular
3286
D.H. Bacon et al. / Energy Procedia 1 (2009) 3283–3290 Bacon/ Energy Procedia 00 (2008) 000–000
data. Entrapment of CO2 with imbibing water conditions can be modeled with the hysteretic two-phase k-s-p functions. Two-phase k-s-p relations span both saturated and unsaturated conditions. The aqueous phase is assumed to never completely disappear through extensions to the s-p function below the residual saturation and a vapor pressure lowering scheme. Supercritical CO2 has the role of a gas in these two-phase k-s-p relations. The hydraulic properties used in these simulations were detailed in a previous paper [2]. For these simulations, a well model in the H2O-CO2-NaCl operational mode of STOMP was used. A well model is a type of source term that extends over multiple grid cells, partitioning flow according to the hydraulic properties of the formation. Assuming a constant pressure at the bottom of the well, the injection pressure at each cell in the well is determined as a function of depth. The CO2 injection rate is proportional to the pressure gradient between the well and surrounding formation. Simulations were conducted that considered geochemical reactions involving the minerals present in the formation, the formation brine and injected supercritical CO2. These simulations used the batch geochemistry solution module ECKEChem (Equilibrium-Conservation-Kinetic Equation Chemistry). This add-on module to STOMP is described in an addendum to the STOMP User’s Guide [7]. ECKEChem uses an operator splitting reactive transport scheme. The operating splitting scheme solves the reactive species transport separately from the reactive species chemistry equations. The coupled nonisothermal multi-fluid flow and transport equations are solved sequentially with the reactive transport equations; and the reactive transport equations are solved sequentially as two components: 1) multi-fluid component and kinetic species transport, and 2) batch chemistry. Reactive species that are components of the flow and transport equations are linked to the components via source/sink terms. Table 2. Equilibrium Reactions Used in Reactive Transport Simulations
Fourteen carbonate, silicate and sulfate aqueous species, and four mineral species were considered. The mineral composition of the formation was assumed from average observed values from the ELAN analysis (Figure 2). The dolomite layers were assumed to consist of 88 percent dolomite, 8 percent quartz, 2 percent calcite, and 2 percent anhydrite by volume. The sandstone layers were assumed to consist of 88 percent quartz, 8 percent dolomite, 2 percent calcite, and 2 percent anhydrite by volume. The predominant aqueous species were determined by simulating the formation water in equilibrium with observed minerals using EQ3 [8] . The equilibrium reactions used in the simulations are shown in Table 2.
Equilibrium Reaction
Log Equilibrium Coefficient at 54ºC
CO2(aq) = H+ + HCO3-
-6.26
CaCO3(aq) + H+ = Ca2+ + HCO3-
6.54
CaHCO3+ = Ca2+ + HCO3-
-1.13
CaSO4(aq) = Ca2+ + SO42-
-2.23
-
+
HSiO3 + H = SiO2(aq)
9.55
MgCO3(aq) + H+ = HCO3- + Mg2+
6.99
MgHCO3+ = HCO3- + Mg2+
-1.13
MgSO4(aq) = Mg2+ + SO42-
-2.76
Kinetic mineral dissolution/precipitation reactions were assumed to be governed by Transition State Theory. The kinetic reactions used in the simulations are shown in Table 3. Values for the equilibrium coefficients at 54ºC were taken from the EQ3/6 version 8.0 COMP database [8]. The reaction rates were calculated using a general kinetic rate law [9] షಶೌ
ݎൌ ݇ܣ ݁ ೃ ͳͲఎሺுሻ -1
(1) 2
-2 -1
where r is the reaction rate in mol s , A is the surface area in m , k0 is the intrinsic rate constant in mol m s , Ea is the activation energy in kJ mol-1, R is the universal gas constant, T is temperature in degrees Kelvin, and K is the pH power law coefficient. Values for the reference reaction rate and activation energy were taken from a compilation of mineral rate parameters [10]. Rate parameters for the neutral mechanism were used, thus the pH power law coefficient is assumed equal to zero.
3287
D.H. Bacon et al. / Energy Procedia 1 (2009) 3283–3290 Bacon/ Energy Procedia 00 (2008) 000–000
2.1. Rose Run Formation Simulations were executed on a two-dimensional (2-D) radial Cartesian grid. The grid covered a vertical depth (in the Z-direction) of 39.5 m, between the true depths of 2350.3 and 2389.8 m bKB. The grid had horizontal radial symmetry around the well out to a distance of 3.2 km. The 2-D grid had a resolution of 35 grid nodes in the horizontal Xdirection and 49 nodes in the vertical Z-direction. Vertical grid spacing varied between 0.3 and 1.22 m. Horizontal grid spacing varied from 3 m near the well to 404 m near the outer boundary.
Table 3. Kinetic Reactions Used in Reactive Transport Simulations Log Equilibrium Coefficient at 54ºC
Intrinsic Rate Constant, k0, mol m-2 s-1
Activation Energy, Ea, kJ mol-1
Anhydrite = Ca2+ + SO42-
-4.67
2.07×10⁻¹
14.3
+
Calcite = -H + Ca + HCO3-
1.42
2.03×10⁻²
23.5
Dolomite = -2H+ + Ca2+ + Mg2+ + 2HCO3-
1.53
4.13×10+1
52.2
Quartz = SiO2(aq)
-3.54
2.79×10+2
90.1
Kinetic Reaction
2+
4
A downward pressure gradient of 1.11 × 10 Pa/m was used to initialize the brine pressure field. The pressure gradient was additionally assigned to vertical boundary surfaces located radially from the vertical injection well. This assumption allows reservoir brine to leave the computational domain with injected CO2. Isothermal conditions were assumed using the measured Rose Run formation temperature of 54°C (129°F). Brine chemistry was modeled assuming a 5 m aqueous NaCl solution, as an approximation in viscosity and density to the fluid sample from the Rose Run formation, which had total dissolved solids of 328,000 mg/L and chloride of 200,000 mg/L. The upper and lower boundaries were assumed impermeable. 2.2. Copper Ridge Formation Simulations were executed on a 2-D radial grid. The 2-D grid covered a vertical depth (in the Z-direction) of 79 m, between the true depths of 2454.6 and 2533.8 m bgs. The 2-D grid extended 6.4 km from the well in the radial R direction. The 2-D grid had a resolution of 41 grid nodes in the radial R direction, and a vertical grid resolution of 69 grid nodes. Horizontal grid spacing for the 2-D radial model varied from 3 m near the well to 403.9 m near the outer boundary; vertical grid spacing varied from 0.3 m in high-porosity zones to 2 m in low porosity zones. For the Copper Ridge formation, a temperature of 63°C was assumed, based on recent hydraulic testing [3]. Two fluid samples from the Copper Ridge formation showed average total dissolved solids of 304,000 mg/L and chloride of 185,000 mg/L. The initial pressure gradient assumed was the same as that assumed for the Rose Run Formation. 3. Results To set up the initial conditions for the CO2 injection, the observed formation water compositions for total C, Ca, Mg, Si, S and pH were allowed to equilibrate with the observed formation minerals for a period of 10 years. CO2 was injected for 4 years at a rate of 82,500 metric tons/yr. A long recovery period of 100 years was assumed.
Figure 5. Supercritical CO2 saturations after 4 years of injection at a rate of 82,500 metric tons/yr in the Rose Run Formation
3.1. Rose Run Formation Post CO2 injection (Figure 5), aqueous CO2 concentrations near the injection well increase rapidly, and pH decreases (Figure 6). The rate of calcite dissolution in the formation is highest, with the rate of dolomite dissolution being a factor of 20 slower (Figure 7). Overall, the amount of calcite dissolved in the formation, 5.5x10⁷ moles, is 0.008 percent of the total amount of calcite initially in the formation, 6.8x10¹¹ moles. Locally, the greatest change in calcite mass is a decrease of 0.4 percent (Figure 8), and the greatest change in dolomite mass is a decrease of 0.0087
3288
D.H. Bacon et al. / Energy Procedia 1 (2009) 3283–3290 Bacon/ Energy Procedia 00 (2008) 000–000
percent (Figure 9). These changes in mass are not sufficient to effect a noticeable change in porosity or permeability of the formation. No significant changes in calcite or dolomite occur near the caprock.
Figure 6. Post-CO2 Injection Concentrations of Aqueous Species in the Rose Run Formation near the injection well
Figure 7. Post-CO2 Injection Change in Total Formation Mineral Content in the Rose Run Formation
Figure 8. Percentage change in calcite mass 100 years after pilotscale injection of CO2 in the Rose Run Formation
Figure 9. Percentage change in dolomite mass 100 years after pilot-scale injection of CO2 in the Rose Run Formation.
Compared to the 330,000 metric tons of injected CO2, 4,500 metric tons of dissolved CO2 is added to the system by the dissolution of calcite and dolomite, an increase of 1.4 percent. The amount of supercritical CO2 not dissolved at the end of the 100-year simulation, 270,000 metric tons, is not significantly different from a simulation without geochemistry. During the 100-year period considered, mineral dissolution does not noticeably affect the rate of carbon sequestration in the Rose Run formation. 3.2. Copper Ridge Formation Post CO2 injection (Figure 10), aqueous CO2 concentrations near the injection well increase rapidly and pH decreases (Figure 11). The rate of calcite dissolution in the formation is highest, with the rate of dolomite dissolution being a factor of 20 slower (Figure Figure 10. Supercritical CO2 saturations after 4 years of injection at a 12). Overall, the amount of calcite dissolved in the rate of 82,500 metric tons/yr in the Copper Ridge Formation 8 formation, 1.7x10 moles, is less than 0.07 percent of the total amount of calcite initially in the formation, 5.5x10¹² moles. Locally, the greatest change in calcite mass is a decrease of 1.6 percent (Figure 13), and the greatest change in dolomite mass is a decrease of 0.0032 percent (Figure 14). The caprock was not modeled explicitly, but dolomite and calcite decrease only slightly in the upper layers of injection. Mineral dissolution rates in the Copper Ridge formation are slightly higher than for the Rose Run formation, because of the higher temperature assumed for the Copper Ridge, 63ºC vs. 54ºC for the Rose Run formation.
3289
D.H. Bacon et al. / Energy Procedia 1 (2009) 3283–3290 Bacon/ Energy Procedia 00 (2008) 000–000
Figure 11. Post-CO2 Injection Concentrations of Aqueous Species in the Copper Ridge Formation near the injection well
Figure 12. Post-CO2 Injection Change in Total Formation Mineral Content in the Copper Ridge Formation
Figure 13. Percentage change in calcite mass 100 years after pilotscale injection of CO2 in the Copper Ridge Formation
Figure 14. Percentage change in dolomite mass 100 years after pilot-scale injection of CO2 in the Copper Ridge Formation
Compared to the 330,000 metric tons of injected CO2, 22,400 metric tons of dissolved CO2 is added to the system by the dissolution of calcite and dolomite, an increase of 6.8 percent. The amount of supercritical CO2 at the end of the 10-year simulation, 141,000 metric tons, was 1.6 percent greater than the simulation without geochemistry. The increase in dissolved CO2 from carbonate dissolution decreases the amount of injected CO2 that can dissolve. During the 10-year period considered, mineral dissolution does not significantly affect the rate of carbon sequestration in the Copper Ridge formation. 3.3. Cosequestration of Sulfur Redox transformations can become important when sulfur dioxide (SO2) is also present in the injectate. In the presence of oxygen, SO2(g) dissolves to SO42-: SO2(g) + 0.5O2(g) + H2O = SO42- + 2H+
(2)
where the log K is 32.6 at 54°C. Oxidation of SO2 could take place by simultaneous reduction of ferric iron (e.g., hematite), or other reducible metal compounds, that are present in the formation rocks. The resulting increase in sulfate concentration could cause the pore fluid to become oversaturated with respect to gypsum (or anhydrite). Conditions in saline formations may be close to saturation with respect to calcium sulfate mineral solubility and, therefore, an increase in sulfate could result in precipitation that could lead to pore clogging, followed by loss of injectivity. The potential for solid phase precipitation could be intensified if the formation fluid also contains high concentrations of sulfate, which can occur, for example, if the brine is influenced by evaporite minerals. Co-sequestration of sulfur dioxide was simulated by adding 1 percent SO2(g) by mass to the injected CO2. Because anhydrite precipitates more rapidly than the other minerals considered, the largest increases in anhydrite mass are seen close to the injection well. Locally, the change in anhydrite mass is as high as 14.2 percent for the
3290
D.H. Bacon et al. / Energy Procedia 1 (2009) 3283–3290 Bacon/ Energy Procedia 00 (2008) 000–000
Rose Run (Figure 15) and 60.5 percent for the Copper Ridge (Figure 16) injections. However, because these changes are relative to the initial volume fraction of anhydrite in the formation, which at 2 percent is relatively small, these changes do not result in significant changes in porosity or permeability near the well.
Figure 15. Percentage change in anhydrite mass 100 years after injection of CO2 and SO2 in the Rose Run Formation Figure 16. Percentage change in anhydrite mass 100 years after injection of CO2 and SO2 in the Rose Run Formation
4. Conclusion Injection of CO2 into formations bearing dolomite, quartz, calcite, and anhydrite results in the dissolution of calcite and—to a lesser extent—dolomite. The addition of SO2 to the injection results in the precipitation of anhydrite near the well. For a 330,000 metric ton injection of CO2, with a 100-year recovery period, mineral dissolution/precipitation does not significantly affect the rate of carbon sequestration in, or the formation properties of, the Rose Run and Copper Ridge formations. Acknowledgements This study was part of the Ohio River Valley CO2 Storage Project (sponsored by the U.S. Department of Energy, AEP, BP, Ohio Coal Development Office, Schlumberger, and Battelle along with its Pacific Northwest Division). Additional funding for SO2 co-sequestration analysis was provided by Babcock and Wilcox. References 1. Gupta, N., et al., Determining Carbon Sequestration Injection Potential at a Site-Specific Location Within the Ohio River Valley Region, in Proceedings of the 7th International Conference on Greenhouse Gas Control Technologies, September 5-9, 2004, Vancouver, Canada, D.W. Keith, et al., Editors. 2005, Elsevier: New York. p. 511-520. 2. Bacon, D.H., et al., CO2 Injection Potential in the Rose Run Formation at the Mountaineer Power Plant, New Haven, West Virginia, in AAPG Studies in Geology # 59: Carbon Dioxide Sequestration in Geological Media - State of the Science, M. Grobe, J.C. Pashin, and R.L. Dodge, Editors. 2008, American Association of Petroleum Geologists: Tulsa, Oklahoma. 3. Gupta, N., Topical Report: The Ohio River Valley CO2 Storage Project AEP Mountaineer Plant, West Virginia - Characterization of Potential for Geologic Storage of CO2. 2008, Battelle: Columbus, Ohio. 4. White, M.D. and M. Oostrom, STOMP: Subsurface Transport Over Multiple Phases, Version 4.0, User's Guide. 2006, Pacific Northwest National Laboratory: Richland, Washington. 120 pp. 5. Pruess, K., et al., Intercomparison of Numerical Simulation Codes for Geologic Disposal of CO2. 2002, Lawrence Berkeley National Laboratory: Berkeley, California. 86 pp. 6. Bacon, D.H., et al. Assessment of CO2 Injection Potential and Monitoring Well Location at the Mountaineer Power Plant Site. in 8th International Conference on Greenhouse Gas Control Technologies. 2006. Trondheim, Norway: Elsevier, Oxford, UK. 7. White, M.D. and B.P. McGrail, STOMP, Subsurface Transport Over Multiple Phases, Version 1.0, Addendum: ECKEChem, EquilibriumConservation-Kinetic Equation Chemistry and Reactive Transport. 2005, Pacific Northwest National Laboratory: Richland, Washington. 8. Wolery, T.W. and R.L. Jarek, Software User's Manual, EQ3/6, Version 8.0. 2003, Sandia National Laboratories: Albuquerque, New Mexico. 9. Åagaard, P. and H.C. Helgeson, Thermodynamic and Kinetic Constraints on Reaction Rates among Minerals and Aqueous Solutions. I. Theoretical Considerations. American Journal of Science, 1982. 282: p. 237-285. 10. Palandri, J.L. and Y.K. Kharaka, A Compilation of Rate Parameters of Water-Mineral Interaction Kinetics for Application to Geochemical Modeling. 2004, U.S. Geological Survey: Menlo Park, California.