GEXPLO-05344; No of Pages 11 Journal of Geochemical Exploration xxx (2014) xxx–xxx
Contents lists available at ScienceDirect
Journal of Geochemical Exploration journal homepage: www.elsevier.com/locate/jgeoexp
Reactive transport modeling of thorium in a cloud computing environment Xiang Huang a, Guoliang Cao a, Jie Liu a, Henning Prommer b,c,d, Chunmiao Zheng a,e,⁎ a
Center for Water Research, College of Engineering, Peking University, Beijing, China School of Earth and Environment, University of Western Australia, Crawley, WA, Australia c CSIRO Land and Water, Floreat, WA, Australia d National Centre for Groundwater Research and Training, Adelaide, SA, Australia e Department of Geological Sciences, University of Alabama, Tuscaloosa, AL, United States b
a r t i c l e
i n f o
Article history: Received 21 September 2013 Received in revised form 6 February 2014 Accepted 4 March 2014 Available online xxxx Keywords: Thorium Cloud computing Tailings impoundment Bayan Obo Reactive transport modeling Yellow River Baotou
a b s t r a c t Despite the long standing interest in modeling the fate and environmental impacts of radionuclides, simulations addressing the fate and transport of rare earth elements (REEs) and thorium (Th) have received comparably little attention. This study presents an architecture that enables reactive transport modeling and parameter sensitivity analysis on cloud computing platforms. We adapted an existing groundwater modeling framework to perform some of the computationally most expensive steps within a cloud environment based on Microsoft Windows Azure. The cloud computing architecture was evaluated and validated through the development of a schematic, cross sectional model along a transect across a tailings impoundment at a REE mine tailings site in northwest China. The model framework employs a suite of flow, solute transport and reactive transport simulation tools, i.e., MODFLOW, MT3DMS, and PHT3D. On the basis of our model simulations, the collection-trench for the impoundment constructed above the ground surface appears to collect a substantial portion of the leachate fluxes, but the remainder will bypass the trench and migrate downstream. Those bypassed leachate fluxes will subsequently interact with downstream fluviolacustrine aquifers and eventually discharge into the Yellow River south of the study site under the idealized simulation environment. Further investigations of the hydraulic parameters of the aquifer system and the impoundment dam, and other geochemical characteristics are needed to elucidate the fate and transport of thorium and improve the reliability of the numerical model. Although the discussion and analysis of this study is tailored to thorium reactive transport modeling of a REE tailings impoundment, such a framework can also be applied to deploy different types of scientific modeling applications on Azure Cloud. © 2014 Elsevier B.V. All rights reserved.
Introduction Groundwater pollution due to tailings impoundment leakage has become and persisted as a serious worldwide environmental problem, especially where it is associated with acid mine drainage (Miekeley et al., 1992; Pan, 2010; Xu et al., 2005). Numerical modeling of such problems can provide an indispensible supplement to elucidate, quantify and predict the migration of contaminants in complex groundwater systems. Understanding and quantifying the mechanisms controlling radionuclide fate and transport in groundwater from tailings impoundments is vital for effective management of REE mine wastes, selection of potential disposal sites to store nuclear fuel wastes (Ashley et al., 2012; Ewing, 1999; Ma et al., 2012), remediation of accidental contamination problems, and for the protection of water resources (He et al., 2010; Xu et al., 2005). Although the specific toxicity of thorium is greater than
⁎ Corresponding author at: Center for Water Research, College of Engineering, Peking University, Beijing, China. Tel./fax: +86 10 62767687. E-mail address:
[email protected] (C. Zheng).
uranium, its environmental fate is seldom reported, possibly because of its lower solubility. Thorium in natural groundwater prevails predominantly in a tetravalent redox state and is not redox sensitive. It is usually present in ultra-trace concentration and transported as a complexed species (LaFlamme and Murray, 1987; Langmuir and Herman, 1980). Like uranium, the fate of Th is significantly affected by hydrolysis and subsequent oligomerization reactions, which increase its solubility in water (Anderson et al., 1982; Kim et al., 2010). Therefore, it is possible that Th can be leached into groundwater and migrate towards nearby ditches or rivers from Th-rich REE tailings impoundments. Human exposure and severe Th-pollution risks may occur through bioaccumulation in foods grown adjacent to the disposal sites or via direct consumption of water with elevated Th concentrations. Transport models incorporating a comprehensive suite of geochemical reactions (e.g., Ma et al., 2010; Prommer et al., 2003; Steefel and Lasaga, 1994) are required (i) for predicting the future long-term fate of the contaminants and (ii) to provide more detailed insights into the factors that control the contaminant behavior under the site-specific spatially and temporally varying hydrogeological and geochemical conditions. Clearly, such modeling efforts have to be underpinned by detailed
http://dx.doi.org/10.1016/j.gexplo.2014.03.006 0375-6742/© 2014 Elsevier B.V. All rights reserved.
Please cite this article as: Huang, X., et al., Reactive transport modeling of thorium in a cloud computing environment, J. Geochem. Explor. (2014), http://dx.doi.org/10.1016/j.gexplo.2014.03.006
2
X. Huang et al. / Journal of Geochemical Exploration xxx (2014) xxx–xxx
monitoring efforts and geostatistical analysis of the concentration distribution to characterize the extent of the contamination and to provide model calibration constraints. On the other hand, models can provide invaluable guidance for data collection and assist with the optimization of monitoring locations, sampling times and data types. Ideally, data collection and modeling are carried out as an integrated effort with a repeated iteration between both tasks. While an extensive number of previous reactive transport modeling studies were dedicated to simulate the complex fate and transport characteristics of uranium (e.g., Ma et al., 2010, 2012; Olin and Lehikoinen, 1997), relatively little attention has been given to thorium. Thus this study represents one of the first attempts at simulating the reactive transport of aqueous Th and how it might be influenced by the physical and chemical conditions generated by REE tailings impoundments. Based on the underlying models that describe the flow and conservative transport processes, reactive transport processes are successively invoked until a satisfactory description of the entire geochemical environment is achieved. Two important steps in the development of reliable reactive transport models are the model calibration step and a comprehensive parameter sensitivity analysis. The latter often plays an important role for the former as the effects of parameters on model outputs are evaluated through sensitivity analysis and used to update estimated parameters and to obtain optimized values. These steps require a large number of model runs, depending on the number of parameters to be evaluated and/or estimated. During the parameter estimation process many of the model runs can be performed completely independently (Hunt et al., 2010), while overall incurring substantial computational cost. When relying on traditional computing infrastructure, i.e., personal computers (PCs) the model calibration step and its associated computing times can often become a bottleneck. The recent emergence of cloud computing has provided a unique opportunity to eliminate such bottlenecks by harnessing the unprecedented storage and high-performance computing resources for the groundwater community (Hunt et al., 2010; Langevin and Panday, 2012; Liu et al., 2012). To date the potential provided by parallel processing is rarely applied for the assessment of groundwater contamination by reactive transport modeling, despite the considerable computational burden (Arnett and Greenwade, 2000) and the fact that parameter estimation can easily be parallelized (Hunt et al., 2010). Cloud computing provides an ideal opportunity for such applications. It offers model users a suitable infrastructure and services from private computing environments to third-party data centers through the Internet (Armbrust et al., 2010; Yang et al., 2013). These various services are referred to as (1) software as a service, (2) platform as a service (PaaS), and (3) infrastructure as a service (IaaS) (Liu et al., 2012; Luchette et al., 2009). Specific examples of cloud computing services for the scientific community are scientific computing as a service (SCaaS) (Saripalli et al., 2011) and scientific modeling as a service (SMaaS) (Liu et al., 2012). Sun (2013), for example, described how service-oriented cloud computing can enable collaborative decisionmaking in watershed management by alleviating the technical burdens of Environmental Decision Support Systems. Cloud computing can also provide scientific software in connection with powerful computing resources and data storages (Kollet et al., 2011) by simultaneously supporting the massively distributed and millions of requests with elasticity, on-demand, and pay-as-you-go features (Fox, 2011; Yang et al., 2013). While numerous studies have already explored the feasibility of utilizing cloud computing for deploying geoscientific applications and first experiences on how to work efficiently and effectively on this new computing paradigm, to our knowledge no reactive transport modeling studies have benefited from cloud computing. The present study is intended to demonstrate the applicability of cloud computing as an effective and promising tool to perform reactive transport simulations and sensitivity analysis, using thorium migration from a tailings impoundment as a representative application example. The remainder of this paper is structured as follows. First, we provide
an overview of the emerging scientific cloud computing literature and specifically highlight recent research efforts for utilizing cloud computing in support of geoscientific applications. Then, we outline an architecture adapted from Subramanian et al. (2010) and ModflowOnAzure (Liu et al., 2011b, 2012) for using the Microsoft Windows Azure Cloud computing platform to implement the case study and evaluate its performance and reliability across desktop and cloud platforms. The case study involves a Th reactive transport modeling along a transect across a tailings impoundment in Baotou, China for which the fate and transport characteristics of leaching Th are not yet well understood. Next, we present a sensitivity analysis that was performed on the Azure platform in which the sensitivity of the net thorium mass-fluxes into the collection-trench to various hydrogeological parameters was investigated. Finally, we discuss some of the lessons and insights in developing our cloud computing framework for reactive transport modeling applications and point out possible future directions. Scientific cloud computing Like nebulous ‘cloud’ itself, the definition of “cloud computing” in the literature is still incomplete and confusing (Foster et al., 2008; Vaquero et al., 2009). From a highly cited article by Armbrust et al. (2010), “cloud computing refers to both the applications delivered as services over the internet and the hardware and systems software in the data centers that provide those services”. Cloud computing represents a new computing paradigm and more reliability–flexibility– scalability than previous grid computing and high-performance computing (HPC), but still inherits many characteristics of traditional computing. For more detailed discussions on differences among them, see Foster et al. (2008), Bias (2010) and Ebejer et al. (2013). The recent surge in cloud computing is leading to a transition towards a new computing paradigm that will profoundly affect every aspect of our social life and economy (Armbrust et al., 2010; Yang et al., 2013). Concurrently, research efforts, including geoscientific applications, are increasingly relying on the advantages of cloud computing. Examples of these applications include CloudClustering (Dave et al., 2011), CloudGIS (Yang et al., 2013), CloudPEST (Fienen et al., 2011), synthetic seismograms and seismic source inversion (Subramanian et al., 2010), computationalintensive molecular modeling (Ebejer et al., 2013), comparative genomics in bioinformatics (Kim et al., 2012), calibration of watershed modeling (Humphrey et al., 2012) and uncertainty analysis of flood modeling in hydraulic studies (Quiroga et al., 2013). Commercial cloud platforms such as Amazon EC2/AWS, GoGrid, Windows Azure, Google AppEngine/GCE and Rackspace Mosso are now available to hydrogeological and environmental researchers and practitioners. Luchette et al. (2009) solved two Parallel PEST parameter estimation problems by using virtual machines (VMs) on GoGrid. Kollet et al. (2011) implemented the integrated hydrologic simulation platform ParFlow using a cloud computing web service, which included a web interface, optimization capabilities (e.g., PEST, EnKF) and basic visualization utilities. Saripalli et al. (2011) presented a numerical simulator for the subsurface fluid and heat transport model (TOUGH2) on the VM-based Amazon AWS, which helps users to access dataintensive visualizations via a web-browser. Compared with other cloud computing platforms, Microsoft Windows Azure has been demonstrated to be one of the most effective cloud platforms (Gannon and Vargas, 2012; Kim et al., 2012; Liu et al., 2012). There are numerous data- and computationally intensive scientific applications on Azure such as AzureBlast (Lu et al., 2010) and Twister4Azure (Gunarathne et al., 2013). Liu et al. (2011b) developed an easy-to-use cyber-enabled MultiModel computing framework for groundwater risk analysis on Azure. MODISAzure is a large-scale satellite image processing system, which implements the MODIS dataintensive reprojection and reduction pipeline in Azure (Humphrey et al., 2012). Liu et al. (2012) developed and utilized ModflowOnAzure for groundwater modeling uncertainty analysis and showed that the
Please cite this article as: Huang, X., et al., Reactive transport modeling of thorium in a cloud computing environment, J. Geochem. Explor. (2014), http://dx.doi.org/10.1016/j.gexplo.2014.03.006
X. Huang et al. / Journal of Geochemical Exploration xxx (2014) xxx–xxx
Azure computing platform provides good scalability, and reduces independent-repetitive modeling efforts among digital earth and geosciences modeling communities. Behzad et al. (2011) adapted the ModflowOnAzure developed by Liu et al. (2012) for incorporation into the CyberGIS gateway, thereby leveraging CyberGIS' existing middleware framework including its user interface/environment and computation management. Miras et al. (2013) designed CloudMC to parallelize Monte Carlo simulations via web application under Azure's dynamic virtual cluster. In summary, these applications provide a snapshot of the state-of-the-art and some of the most recent developments. For the present study we selected Azure, mostly because of its broad use and cost-effectiveness. Reactive transport modeling on azure platform Microsoft Azure platform The Windows Azure computing platform was developed by Microsoft to support an easy-to-use cloud development environment with a series of system services running in the backend datacenters. Azure follows a “platform as a service” approach, which provides the .NET runtime and supports common programming languages, like C++, C#, Visual Basic, and others. The services hosted in Azure may be comprised of single or many types of roles (e.g., web role, worker role and VMs role) and can dynamically scale up or down multiple applications (Humphrey et al., 2012; Miras et al., 2013). Azure offers a limited set of VM types on a linear price and feature scale (Miras et al., 2013) and provides four kinds of data structures for designing cloud applications, i.e., blob, table, queue, and drive (Subramanian et al., 2010). Azure can also optimize communications among closest services and storage accounts via building a certain ‘affinity groups’ (Gunarathne et al., 2013). Software architecture
The web file-share service “Dropbox” was used to automatically synchronize input/output files between cloud and desktop client. A service bus queue was used to send and receive messages for task dispatching and scheduling, and create one worker role including a master with one VM while other computation slaves with many VMs to conduct N instances. Within the “Worker Role, the “Job Manager” monitors the shared Dropbox folders and fetches any new requests from input/output files. If the Job Manager” receives a batch of input/output requests from the task queue, it generates a series of individually running MODFLOW-PHT3D jobs as single messages and preliminarily divides all jobs according to each VM's core number. The master can automatically maintain workload balance across slaves based upon these partitions. To facilitate each VM role to respond to and help other VMs to run every PHT3D job, communications among VMs must be satisfied by building appropriate internal endpoints (accessible within Azure node to role instances). Each VM instance processes workload under Windows Server 2008 (potentially with the .NET 4.0 Task Parallel Library (TPL) as well, especially for VM occupying multiple cores to handle many independent works simultaneously). The “Job Manager” checks execution status and coordinates inactive slaves going ahead of schedule to complete the rest of workloads together. Once the execution is completed, results are stored in either blobs or tables, accessible to all instances. Then, output files will be automatically compressed and moved into the user's shared folders of Dropbox. Several post processors including ModelViewer, ListingAnalyst, and Pht3dPlot were also uploaded into the shared folders of Dropbox to analyze or visualize the modeling results on the cloud. Parameter sensitivity analysis For sensitivity analysis, a classic local perturbation method was implemented. The sensitivity coefficient was calculated as discussed in full detail by Zheng and Bennett (2002): Xi;k ¼
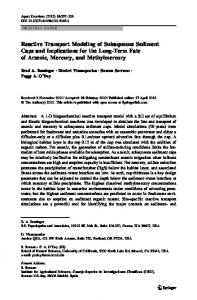
Based on the previously discussed principles and applications (e.g., Fienen et al., 2011; Humphrey et al., 2012; Kim et al., 2012; Liu et al., 2012; Luchette et al., 2009; Miras et al., 2013; Subramanian et al., 2010), we designed an architecture that illustrates the application of Azure for parameter sensitivity analysis of a multi-component reactive transport modeling problem (Fig. 1). We selected C# in Visual Studio 2010 as the programing language. A Chinese version of ModelMuse (Winston, 2009), a public domain graphical user interface (GUI) for the groundwater flow model MODFLOW and the solute transport model MT3DMS, was used to create MODFLOW and MT3DMS input files. PhreeqcInteractive (Charlton et al., 1997) was selected to create and edit the relevant database files for PHT3D (which couples MT3DMS and PHREEQC).
3
⌢ ∂y i ∂ak
ð1Þ
where Xi;k is the sensitivity coefficient of the ith model dependent ⌢ variabley i with respect to the kth model input parameter. Sensitivity coefficients play an important role in automated parameter identification and also in obtaining the most important parameters in guiding further field data-collection activities. While keeping other parameters constant, a small perturbation ðΔak Þ is successively applied to each input parameter under consideration. Eq. (1) can be further approximated and expressed in the normalized form:
Xi;k ¼
⌢ ⌢ ⌢ ∂y i y ða þ Δak Þ−y i ðak Þ ≈ i k : Δak =ak ∂ak =ak
ð2Þ
Fig. 1. Architecture of reactive transport modeling based on Windows Azure.
Please cite this article as: Huang, X., et al., Reactive transport modeling of thorium in a cloud computing environment, J. Geochem. Explor. (2014), http://dx.doi.org/10.1016/j.gexplo.2014.03.006
4
X. Huang et al. / Journal of Geochemical Exploration xxx (2014) xxx–xxx
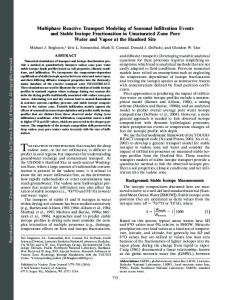
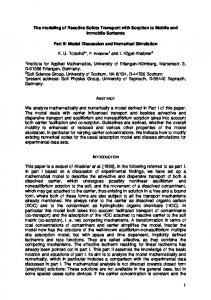
In this study, the sensitivity analysis is carried out from the base model with the known input parameter set ak . Each input parameter is perturbed one at a time by a fixed percentage and each time the model is run with the modified parameter set. The resulting change to the model dependent variable y ⌢i is obtained to compute the sensitivity coefficient using Eq. (2). The amount of perturbation should be chosen such that it is sufficiently small to satisfy the definition of Eq. (1) and yet large enough to cause a noticeable change to the model dependent variable. Field application Description of the study site The Bayan Obo tailing stores a voluminous amount of RE-containing minerals discarded from the flotation-hydrometallurgical processing of the giant Bayan Obo ore. It has also been referred to as the Baotou REE tailing in many Chinese-language literatures (e.g., Pan, 2010) since it is situated in the Baotou city and one of the largest tailings in China. It is piled above ground surface and has a perimeter of 13.6 km. Its tailings impoundment covers an area of 12 km2, about 3.5 km long from south to north and 3.2 km from east to west. The pound is located in the juncture of the Hademen-ravine alluvial fan and the alluvial fan of the (intermittent) Kundulun River, with an average slope of 0.4% towards the southeast, and the topography is sloping from north to south (Wang and Tu, 1990) (Fig. 2). Its downstream area is an alluvial plain with very shallow groundwater levels. The predominant soil types are meadow soils, calcareous soils and saline chestnut soils. Fig. 3 shows a schematic diagram of the transect of the Bayan Obo tailings impoundment towards one of the tributaries of the Yellow River (nearest distance about 2 km; the tributary and the Yellow River are not shown in Fig. 3). Leachate is collected by a collection-trench that was
a
emplaced around the toe of the tailings dam. The metallurgical refinery reuses the collected leachates and the generated slurries are pumped back into the tailings impoundment via a slurry pipeline with spigots (see the water recycle system in Fig. 3). The local relief of the tailings dam is 25–35 m between the highest point and the lowest level of the collection-trench. As one of the most productive secondary mines” and the largest REEs “suspended lake” in the world, the Bayan Obo tailings impoundment has caused severe environmental deterioration such that multiple villages have been displaced (Pan, 2010; Wang and Tu, 1990). It is threatening the surrounding environment and humans by contaminating agricultural lands and local water sources (He et al., 2010; Wang et al., 2002; Zhang et al., 2004). In the vicinity of the impoundment, radiological levels range from 80 nGy/h to 400 nGy/h detected by in situ gamma ray spectrometry. Radioactive thorium enriched in the top soil (Li et al., 2013; Wu et al., 2011) is thought to be mainly responsible for the elevated radiation levels. Wang et al. (2011) found that the nearby groundwater had damaged the cells of maize seedlings genetically using singlecelled gel electrophoresis technology. Table 1 presents documented water chemistry characteristics of the adjacent water bodies. It shows that the concentrations of many species significantly exceed the WTO − + 2+ − health standards (e.g., NO− 2 , NH4 , SO4 , F , Cl ) and vary over a wide range. Of greatest concern is the potential for radioactive pollution of the nearby Yellow River, which is the primary water source for approximately 150 million people (Hurst, 2010). Flow and physical transport models As the basis for multicomponent reactive transport modeling, a steady-state 2D cross-sectional groundwater flow model was first developed using MODFLOW. The model domain was discretized by 745 columns (in the x direction) and 72 layers (in the z directions), covering
b
c
Fig. 2. Location of the study site in China (a); the Bayan Obo tailings impoundment and vicinity (b); and a larger view of the impoundment (c).
Please cite this article as: Huang, X., et al., Reactive transport modeling of thorium in a cloud computing environment, J. Geochem. Explor. (2014), http://dx.doi.org/10.1016/j.gexplo.2014.03.006
X. Huang et al. / Journal of Geochemical Exploration xxx (2014) xxx–xxx
5
Slurry Discharge
Evaporation
Metallurgical Refinery
Precipitation
Dam Tailings ImpoundmentWater Cover
Fine FractionSlimes
None Liner
Piezometer or wells
Tailings Beach
Coarse Fraction-Sands
Seepage
Wetting Lift 2 Front
? Lift 1
?
Return-flow workstation
Starter Dyke Toe Seepage
Groundwater Flow
Collection Trench Seepage
? Flow to the Yellow River ?
Fig. 3. Schematic diagram of the study site.
a lateral distance of 1500 m and a vertical thickness of 55 m (Fig. 4). Note that the interaction between the model domain and its surrounding porous media, which can be appropriately simulated using the transient infinite element (Zhao, 2009), was neglected in this study. The vertical grid spacing ranges from 0.5 to 0.75 m throughout the model domain, while the horizontal cell spacing varies between 1.5 and 3 m. The western side of the model was intended to represent the central axis of the circular pond and was treated as a no-flow boundary. The groundwater level of 1015 m above sea level, as measured at an observation well, was used to present the head boundary at the eastern side of the grid. The pond (stage 1050 m above sea level) was approximated as a head-dependent flow boundary using the Reservoir Package of MODFLOW, while the collection-trench (stage 1029.5 m above sea level) was simulated using the MODFLOW River Package (RIV). The bottom of the model domain was treated as no-flow boundary, and recharge to the groundwater was considered negligible due to the local arid environment. In the absence of more detailed data, six hydrogeologic units were defined according to Pan (2010). The hydraulic properties are shown in Fig. 4. Physical transport was simulated with MT3DMS on Azure using the TVD transport solution technique. The longitudinal dispersivities that were allocated to different hydrogeological units are also shown in Fig. 4. The ratio of vertical transverse dispersivity to the longitudinal dispersivity was set to 0.001. In the absence of suitable field data, an artificial conservative tracer was specified for the tailings pond water
at a uniform background concentration (see Table 2). The preliminary results show that the front of the conservative tracer takes nearly 35 years to reach the collection-trench and nearly 90 years to reach the eastern boundary, respectively. The relatively slow rate of migration is mostly attributed to the low hydraulic conductivities specified for the tailings and dams. As already pointed out by Pan (2010), the flow field is mostly impacted by dam-formation hydraulic parameters. Simulation of reactive transport Surface protonation and deprotonation of thorium, including adsorption reactions of other competitive surface species, especially for hydrolysis and carbonization, have previously been shown to be important factors impacting migration rates of thorium in groundwater (Anderson et al., 1982; Kim et al., 2010; LaFlamme and Murray, 1987). In this study, we simulated the transport and surface complexation reactions of thorium and uranium using PHT3D based on the flow and transport models on Azure as described above. The simulated reaction network consists of 29 aqueous complexation reactions for thorium and 24 for uranium (Table 3). Additionally, three mineral phases (dolomite, anhydrite and fluorite) were considered. The reaction network also included a range of different binding sites to represent surface complexation reactions of thorium and uranium with quartz surfaces, and of thorium with goethite. However, only the simulation results for thorium are presented
Table 1 Parameters and concentration ranges reported in the adjacent water bodies of Bayan Obo Tailings area (concentration in mg/L unless the pH). Component
Seepage water (e.g., leachate in the collection trench)
Impoundment supernatant water
Background water chemistry
Ca2+ Mg2+ Fe3+ Mn2+ SO2+ 4 Cl− − F NO− 2 NO− 3 NH+ 4 HCO− 3 pH Th(aq) U(aq)
280–560 158.08–826.88 0.148–0.78 0.1–8.33 162–3955 126.31–2100 0.5–7.04 ~3.09 ~1.5 ~100.915 No data 7.06–9.54 No data No data
~460 ~506 ~3.0 ~0.73 ~1788.5 ~8031 5.65–61.78 ~23.4 ~12.7 1625.025–3650 50.6–142.2 ~7.5 ~5 ~0.5
80.0 120.0 No data 0.003 9.63 50 0.1 0.05 0.05 10 0.5 7.2 0 0
Data mainly compiled from Wang and Tu (1990), Zhang et al. (1997), Wang et al. (2002, 2003), Zhang et al. (2004), Zhao (2006), Ban et al. (2008), Han et al. (2009), Chen et al. (2010), He et al. (2010), Wang et al. (2011), Li et al. (2012), and Miao et al. (2012).
Please cite this article as: Huang, X., et al., Reactive transport modeling of thorium in a cloud computing environment, J. Geochem. Explor. (2014), http://dx.doi.org/10.1016/j.gexplo.2014.03.006
X. Huang et al. / Journal of Geochemical Exploration xxx (2014) xxx–xxx
A.s.l., meters
6
Pond
1055 1050
1049 1043
1040 1030 1020 1010 1000
Inactive Cell
Collection
1040
1036
Trench
1026 1046
0
100
200
Observation Well 1021
1016
1030 300
400
500
600
700
800
900
1000
1100
1200
1300
1400
1500
Horizontal distance, X(meters) Tailings Kx=0.4 m/d 1 Kz=0.2 m/d
αL= 0.5 m Porosity = 0.25
Phase II Kx=0.47 m/d Dam Kz=0.37 m/d
αL= 0.5 m Porosity = 0.25
Tailings Kx=0.18 m/d αL= 0.5 m 2 Kz=0.02 m/d Porosity = 0.25
Phase I Dam
Kx=0.01 m/d αL= 0.5 m Kz=0.005 m/d Porosity = 0.25
αL= 1.0 m Aquifer Kx=0.2 m/d 1 Kz=0.04 m/d Porosity = 0.3
Aquifer 2
Kx=0.69 m/d Kz=0.65 m/d
αL= 5.0 m Porosity = 0.35
Fig. 4. Illustration of the numerical model setup and of the selected hydraulic property. The labeled equipotential lines (the yellow dashed lines) are calculated by MODFLOW and the black lines indicate particle traces as calculated by MODPATH. (Vertical exaggeration by a factor of 4, similarity hereinafter). (For interpretation of the references to color in this figure legend, the reader is referred to the web version of this article.)
here. All homogeneous and heterogeneous reactions are assumed to be in thermodynamic equilibrium. All of the reaction equilibrium constants and compositions of the impoundment water and initial concentrations were based on earlier published literature values as well as more recent measured data. Computational performance and sensitivity analysis Based on Luchette et al. (2009) and Liu et al. (2012), the computational efficiency of parallelizing numerous single-cores to produce many slaves is superior to the alternative of parallelizing multiplecores with fewer slaves. We implemented PHT3D models on 18 VMs, one VM for the Job Manager (master) and the remaining 17 VMs for computing tasks (slaves). Each worker VM consisted of a non-shared single-core (AMD1.6 GHz), 1.75 GB memory, and provided 500 GB storage. In order to conduct parameter sensitivity analysis, we needed at least 24 runs, corresponding to the 24 parameters shown in Fig. 4. Fig. 6 shows the execution time and costs of running the thorium reactive transport model on Azure. Master–slave parallel running behaves the best with respect to time and costs. The amount of runtime for completing 24 parameter sensitivity analysis runs was about 4.22 days, which corresponds approximately to a 10-fold speed up, down from 2.11 months for a serial execution in a single-core environment. Although serial execution of single-core cost only 137 dollars, less than 164 dollars for master–slave parallel running, long running time made the use of single-core unacceptable in this example. Table 2 Water chemistry compositions used in the cross-section reactive transport model (concentration in mol/L except pH and pe). Component
Impoundment supernatant water mixed with slurries
Background groundwater average concentration in aquifers nearby the tailings area
Ca2+ Mg2+ SO2+ 4 Cl− F− HCO− 3 O2 pH pe Th(aq) U(aq)
7.8 ∗ 10−3 2.58 ∗ 10−2 1.163 ∗ 10−2 4.2816 ∗ 10−2 1.0 ∗ 10−3 6.53777 ∗ 10−3 9.6875 ∗ 10−5 6.98 4 2.15 ∗ 10−5 1.0 ∗ 10−5
2.0 ∗ 10−3 3.0 ∗ 10−3 1.0 ∗ 10−4 2.0 ∗ 10−3 1.5 ∗ 10−4 7.01848 ∗ 10−3 4.1 ∗ 10−5 7.4 −3.53 0 0
We examined the sensitivity of net thorium mass-fluxes into the collection-trench to all key model input parameters with the exception of the reaction rate constant K and the surface site density. All input parameters were perturbed by an increase of 10%, respectively. The results show that the simulated flow paths and the shape of the corresponding contaminant plumes are most sensitive to the hydraulic parameters (as a group) of the shallow aquifer (aquifer1) and those of the impoundment dam (phaseΙ_dam), followed by those of tailings pond sediment layer 2 (tailings2). Fig. 7 shows the relative magnitudes of the computed, normalized sensitivity coefficients with respect to the 24 input parameters investigated. It shows that the porosity is the most sensitive in each hydrogeologic unit (each unit contains a group of four parameters as shown in Fig. 4), while the longitudinal dispersivity is the least sensitive. Only the porosity always has a positive sensitivity coefficient at different simulation times. When the front of the thorium plume approaches the collection trench at approximately 65 years simulation time (Fig. 5), all sensitivity coefficients exhibit less variation with time. Discussion of simulation results The initial flow and transport simulation results indicate that the collection trench captures a significant portion of the leachates and thus limits the contaminants from moving further downstream towards the Yellow River. However, despite the low permeability of the tailings and aquifer units and despite the absence of groundwater recharge some leachate may still bypass the collection-trench and migrate towards the eastern model boundary. The calculated travel time for the arrival of contaminants at the boundary exceeds 100 years (Fig. 5). As Syed (1999) noted, yellow and brown floodplain sediments may adsorb significant amounts of thorium, which means that the downstream deposits may now contain higher levels of contaminants than the tailings themselves (Coulthard and Macklin, 2003). However, a complicating factor unconsidered so far is that a complex interplay between dissolved organic matter (DOM) and radionuclides may enhance the migration of the latter (Stockdale and Bryan, 2013). In the case of the Bayan Obo tailings dam the fluviolacustrine organic-rich shallow aquifer may enhance thorium mobility and increase ecological health risks substantially. Thus, future study on thorium reactive transport should also consider a refined conceptual model for interactions among groundwater, sediments and microorganisms. The sensitivity coefficients of the net thorium mass-flux into the collection trench to all 24 input parameters varied with time (Fig. 7). Somewhat surprisingly, porosity behaves as the most sensitive to the
Please cite this article as: Huang, X., et al., Reactive transport modeling of thorium in a cloud computing environment, J. Geochem. Explor. (2014), http://dx.doi.org/10.1016/j.gexplo.2014.03.006
X. Huang et al. / Journal of Geochemical Exploration xxx (2014) xxx–xxx
7
Table 3 Th and U(VI) aqueous speciation and surface reactions used in the reaction network. Thorium reaction
Log10K
Uranium reaction
Log10K
Th4+ + H2O = Th(OH)3+ + H+ Th4+ + 2H2O = Th(OH)2+ + 2H+ 2 + Th4+ + 3H2O = Th(OH)+ 3 + 3H Th4+ + 4H2O = Th(OH)4 (aq) + 4H+ 2Th4+ + 2H2O = Th2(OH)6+ + 2H+ 2 2Th4+ + 3H2O = Th2(OH)5+ + 3H+ 3 4Th4+ + 8H2O = Th4(OH)8+ + 8H+ 8 + 4Th4+ + 12H2O = Th4(OH)4+ 12 + 12H 6Th4+ + 14H2O = Th6(OH)10+ + 14H+ 14 + 6Th4+ + 15H2O = Th6(OH)9+ 15 + 15H Th4+ + F− = ThF3+ 5Th4+ + 2 F− = ThF2+ 2 Th4+ + 3 F− = ThF+ 3 4+ − Th + 4 F = ThF4(aq) Th4+ + Cl− = ThCl3+ Th4+ + 2Cl− = ThCl2+ 2 Th4+ + 3Cl− = ThCl+ 3 4+ − Th + 4Cl = ThCl4(aq) 4+ 2− Th + SO4 = ThSO2+ 4 Th4+ + 2SO2− = Th(SO4)2(aq) 4 4+ 2− Th + 3SO4 = Th(SO4)2− 3 Th4+ + 4SO2− = Th(SO4)4− 4 4 Th4+ + 5CO2− = Th(CO3)6− 3 5 4+ − 2− Th + 4CO3 + OH = Th(CO3)4(OH)5− 4+ − 2− Th + CO3 + 2OH = Th(CO3)(OH)2 Th4+ + 2CO2− + 2OH− = Th(CO3)2(OH)2− 3 2 Th4+ + CO2− + 3OH− = Th(CO3)(OH)− 3 3 4+ − 2− 2− Th + CO3 + 4OH = Th(CO3)(OH)4 Th4+ + 3CO32− + 2H2O = Th(CO3)3(OH)24− + 2H+
−2.50 −6.20 −11.00 −17.40 −5.70 −6.80 −20.40 −26.70 −36.80 −34.00 8.87 15.63 20.67 25.58 1.7 0.8 1.65 1.26 6.17 9.69 10.75 8.48 29.8 35.6 30.7 36.8 35.8 40.4 10.2
UO2+ + H2O = UO2OH+ + H+ 2 UO2+ + 2H2O = UO2(OH)2 + 2H+ 2 + UO2+ + 3H2O = UO2(OH)− 2 3 + 3H UO2+ + 4H2O = UO2(OH)2− + 4H+ 2 4 2UO2+ + H2O = (UO2)2(OH)3+ + H+ 2 2UO2+ + 2H2O = (UO2)2(OH)2+ + 2H+ 2 2 3UO2+ + 4H2O = (UO2)3(OH)2+ + 4H+ 2 4 + 3UO2+ + 5H O = (UO ) (OH) + 5H+ 2 2 2 3 5 + 3UO2+ + 7H2O = (UO2)3(OH)− 2 7 + 7H + 4UO2+ + 7H2O = (UO2)4(OH)+ 2 7 + 7H UO2+ + F− = UO2F+ 2 UO2+ + 2 F− = UO2F2 2 UO2+ + 3 F− = UO2F− 2 3 UO2+ + 4 F− = UO2F2− 2 4 UO2+ + CO2− = UO2CO3 2 3 UO2+ + 2CO2− = UO2(CO3)2− 2 3 2 UO2+ + 3CO2− = UO2(CO3)4− 2 3 3 2+ 2− 3UO2 + 6CO3 = (UO2)3(CO3)6− 6 2+ 2+ 2− UO2 + Ca + 3CO3 = CaUO2(CO3)2− 3 2+ 2+ 2− UO2 + Mg + 3CO3 = MgUO2(CO3)2− 3 2+ 2+ 2− UO2 + 2Ca + 3CO3 = Ca2UO2(CO3)3 + 2UO2+ + CO2− + 3H2O = (UO2)2(CO3)(OH)− 2 3 3 + 3H
−5.2 −12 −20 −33 −2.8 −5.63 −11.9 −15.56 −31.00 −21.9 5.09 8.62 10.9 11.70 9.94 16.61 21.84 54.00 21.78 26.11 30.70 −0.855
2− 3UO2+ + 3H2O = (UO2)3O(OH)2(HCO3)+ + 3H+ 2 + CO3
0.655 + 2− 11UO2+ + 12H2O = (UO2)11(CO3)6(OH)2− 2 + 6CO3 12 + 12H
36.43
Surface reaction
Log10K
Site density
NSOH + Th4+ ⇒ SO−-Th4+ + H+ 2 N SOH + Th4+ ⇒ (SO)2Th2+ + 2H+ NSOH + Th4+ + H2O ⇒ SO−-(Th(OH))3+ + 2H+ NSOH + Th4+ + 2H2O ⇒ SO−-(Th(OH)2)2+ + 3H+ NSOH + Th4+ + 3H2O ⇒ SO−-(Th(OH)3)+ + 4H+ NSOH + Th4+ + 4H2O ⇒ SO−-(Th(OH)4)0 + 5H+ NS_aOH + UO2+ + H2O ⇒ S_aOUO2OH + 2H+ 2 NS_bOH + UO2+ + H2O ⇒ S_bOUO2OH + 2H+ 2 + NS_bOH + UO2+ ⇒ S_bOUO+ 2 2 + H NS_cOH + UO2+ + H2O ⇒ S_cOUO2OH + 2H+ 2
3.5 −1.9 0.20 −6.38 −10.63 −16.32 −4.9503 −3.4703 0.7766 −1.0603
1.2 5.0 1.2 1.2 1.2 1.2 5.1968 1.2562 1.2562 1.0920
∗ ∗ ∗ ∗ ∗ ∗ ∗ ∗ ∗ ∗
10−4 10−3 10−4 10−5 10−5 10−5 10−3 10−5 10−5 10−7
NSOH represents a surface site for thorium and uranium adsorption. Parameters mainly complied from LaFlamme and Murray (1987), Olin and Lehikoinen (1997), Rand et al. (2008), Ma et al. (2010), Kim et al. (2010), Prommer and Post (2010), and Serco (2011).
thorium mass-flux into the collection trench. Compared with the other three parameters for each hydrogeological unit, the sensitivity coefficient of porosity always shows positive values but reaches its maximum at different simulation times. Over the course of the simulation, uncertainties of longitudinal dispersivities appear to have little impact on calculating how much net thorium mass fluxes discharge into the collection trench. This is consistent with Ham et al. (2004) which showed that longitudinal dispersivities have no influence on plume length once the plume is at steady state. The results of the sensitivity analysis suggest that the field and laboratory measurements of porosity can contribute most useful information to the calculation of the thorium mass flux under the conceptual and numerical settings considered in this study. Among the major groundwater constituents and contaminants in the Bayan Obo tailings impoundment and adjacent aquifers, fluoride showed the greatest spreading, exceeding that of sulfate and thorium. This is partly because fluoride behaves closely like a conservative tracer. Fig. 5 shows the reactive transport results for thorium for the case that included surface complexation reactions (other cases not shown). The existing high concentration of Th in the tailings impoundment and the abundance of sulfate, fluoride, and calcium-magnesium complexes in the alkaline environment possibly control the behavior of the Th plume. Compared with the migration of the conservative tracer, the migration of Th is at this stage significantly retarded by sorption. However,
over time, i.e., in future years the increasing mass flux of thorium leaking into the aquifers will potentially pose serious threats to the groundwater resources near the impoundment as well as the Yellow River. Conclusions and perspectives This study has utilized a cloud computing architecture based on the Microsoft Azure platform to effectively solve a reactive transport modeling problem at a tailings impoundment in Baotou, China. The cloud computing architecture is based on adaptation of a suit of existing, widely used groundwater flow, contaminant transport and geochemical reaction models (MODFLOW, MT3DMS, PHREEQC, and PHT3D) for a commercially available cloud environment, thus greatly reducing the development efforts. The total computational run time, for the illustration example presented in this study, is shortened from months to days. The 10-fold increase in computational efficiency significantly enhances our ability to explore complex multi-component reactive transport problems and analyze the interplay between various model input parameters and model output variables. The field-scale reactive transport model developed in this study, while schematic in nature due to the lack of detailed field data, still offers many valuable insights into the fate and transport of thorium and other potential contaminants in the vicinity of a tailings impoundment.
Please cite this article as: Huang, X., et al., Reactive transport modeling of thorium in a cloud computing environment, J. Geochem. Explor. (2014), http://dx.doi.org/10.1016/j.gexplo.2014.03.006
8
X. Huang et al. / Journal of Geochemical Exploration xxx (2014) xxx–xxx
Conservative
Thorium
245.9 days
245.9 days
808.4 days
808.4 days
4.0 year
4.0 year
10.0 year
10.0 year
30.0 year
30.0 year
65.0 .year
65.0 year
100.1 year
100.1 year
136.2 year
136.2 year
Fig. 5. Comparison of a conservative tracer plume calculated by MT3DMS and the thorium plume calculated by PHT3D at different times on Azure. The upper and lower limits of scale bar represent impoundment and surrounding background concentrations in mol/L, respectively.
For the particular case study examined, while the collection trench can effectively capture a large portion of the leachates from the tailings impoundment, some contaminants are likely to elude the capture and pose potential threats to the nearby aquifers and the Yellow River.
Furthermore, the schematic model developed in this study has not yet considered the possibility that the shallow aquifer may contain embedded preferential flow paths and other small-scale heterogeneities. Such possibility would exacerbate the risk of contamination.
350
1500
2.05 months
One-runs execution Serial 24runs execution
1400 1300
300
1200
1.36 months
1000 900
250
30.38 days
800 700 600
200
500
17.11 days 4.22 days
400
Execution cost ($ US)
Execution time (hours)
1100
100 150 50
0 on 1core
on 2cores
on 4cores
on 8cores
24runs on 18cores (17VMs + 1Master)
100
Fig. 6. Computational performance of running PHT3D and performing sensitivity analysis on Azure. The bars and blue solid lines represent execution time and cost analysis, respectively. According to the Windows Azure website (accessed on 10.27.2013), prices of variable instance size per services hour are $0.09, $0.18, $0.36 and $0.72 for single-core, dual-core, quad-core and eight-core, respectively.
Please cite this article as: Huang, X., et al., Reactive transport modeling of thorium in a cloud computing environment, J. Geochem. Explor. (2014), http://dx.doi.org/10.1016/j.gexplo.2014.03.006
X. Huang et al. / Journal of Geochemical Exploration xxx (2014) xxx–xxx x10-3
-3
x10 2.0
3.0
Tailings1 Kx Tailings1 Kz
2.5
Tailings1 αL Tailings1 Porosity
2.0 1.5 1.0 0.5 0 -0.5 0
10000
20000
30000
40000
Sensitivity coefficent (Mol/day)
Sensitivity coefficent (Mol/day)
3.5
-1.0
Tailings 2 αL Tailings 2 Porosity
1.0 0.5 0.0 -0.5 -1.0 -1.5 -2.0 -2.5 -3.0
50000
Tailings 2 Kx Tailings 2 Kz
1.5
0
10000
x10
-3
30000
40000
50000
x10-3 30.0
Phase I Kx Phase I Kz
Phase II Kx Phase II Kz
25.0
Phase I αL Phase I Porosity
20.0
Phase II αL Phase II Porosity
15.0 10.0 5.0 0.0 -5.0 -10.0 -15.0 -20.0 -25.0
0
10000
20000
30000
40000
-30.0
50000
0
10000
Th simulation time (days) x10 15.0
-3
40000
50000
x10-3
Sensitivity coefficent (Mol/day)
6.0
30000
3.0
Aquifer1 αL Aquifer1 Porosity
9.0
20000
Th simulation time (days)
Aquifer1 Kx Aquifer1 Kz
12.0
Sensitivity coefficent (Mol/day)
20000
Th simulation time (days)
Sensitivity coefficent (Mol/day)
Sensitivity coefficent (Mol/day)
Th simulation time (days) 2.0 1.8 1.6 1.4 1.2 1.0 0.8 0.6 0.4 0.2 0.0 -0.2 -0.4 -0.8 -0.6 -1.0
9
3.0 0.0 -3.0 -6.0 -9.0 -12.0 -15.0 -18.0
Aquifer2 Kx Aquifer2 Kz
2.5
Aquifer2 αL Aquifer2 Porosity
2.0 1.5 1.0 0.5 0.0 -0.5 -1.0 -1.5 -2.0
0
10000
20000
30000
40000
50000
Th simulation time (days)
0
10000
20000
30000
40000
50000
Th simulation time (days)
Fig. 7. Results of parameter sensitivity analysis conducted on Azure. In early simulation times, sensitivity coefficient equivalent to zero indicates no mass flux into the collection trench.
This study illustrates that cloud computing provides a suitable avenue for addressing the challenges associated with computationally demanding comprehensive reactive transport modeling studies, far beyond what could be achieved with traditional on-site computers. There are, however, still some significant challenges ahead in scientific modeling using cloud platforms. For example, integrating/coupling models to create more sophisticated and collaborative software services on cloud platforms remains at this stage difficult for many researchers who have little technical background in cloud computing. Also, stand-alone machines might still be more computationally efficient and costeffective for certain modeling tasks. In the present case, a modest amount of code modification was needed before the simulation platform was successfully adopted for the Azure environment. Based on our experience with the presented Bayan Obo tailings case study, we can foresee a significant potential for future application. A massive number of independent, or loosely-coupled model runs on the cloud platform, frequently needed in model calibration,
uncertainty and sensitivity analysis, provides great opportunities to shift towards a new computing paradigm in geoscientific modeling. Additionally, the current capability of interactive 3D visualization remains a gaping hole for most commercial PCs (Langevin and Panday, 2012; Sanford et al., 2006). Based on a cloud computation platform, integrated 3D/4D visualization of groundwater flow/transport/reactive systems and the remote interactive analysis for a collection of soft-hard data and model output results will be a thrilling research direction and challenge. While most often being involved with groundwater contaminant problems, reactive transport modeling has also become a hot topic in numerical simulation of coupled physical and chemical processes associated with ore-forming systems (Alt-Epping and Zhao, 2010; Zhao et al., 2008a, 2009). Due to the complex nature of an ore-forming system, its numerical simulation usually leads to a coupled problem involving rock deformation, advective pore-fluid flow, heat transfer, mass transport, and geochemical reactions (e.g., Gow et al., 2002; Hobbs et al.,
Please cite this article as: Huang, X., et al., Reactive transport modeling of thorium in a cloud computing environment, J. Geochem. Explor. (2014), http://dx.doi.org/10.1016/j.gexplo.2014.03.006
10
X. Huang et al. / Journal of Geochemical Exploration xxx (2014) xxx–xxx
2000; Ju et al., 2011; Lin et al., 2006; Liu et al., 2005, 2008; Liu et al., 2011a; Ord et al., 2002; Schmidt Mumm et al., 2010; Sorjonen-Ward and Zhang, 2002; Zhang et al., 2003, 2008). As a result, numerical modeling of ore-forming systems in the emerging computational geoscience field (Zhao et al., 2009) can also require prohibitively large computational resources to render traditional computing infrastructure (e.g., PCs and clusters) ineffective or infeasible. Thus, the cloud computing framework and procedures developed in this study, while directed at modeling of contaminant transport problems, are also of general interest and applicability to modeling of ore-forming systems (Lin et al., 2003, 2008, 2009; Xing and Makinouchi, 2008; Yan et al., 2003; Zhao, 2009; Zhao et al., 2008b, 2010), and represent a useful contribution to the emerging field of computational geoscience (Zhao et al., 2009). Acknowledgments This research was supported by the Ministry of Environmental Protection of China (grant no. 201309005), the National High Technology Research and Development Program of China (“863 Program”) (grant no. 2012AA062603), and by Microsoft Research Asia (grant no. CNIC-MSR2013). We are grateful to Lidong Zhou, Fan Yang and Chuntao Hong from Microsoft Research Asia for their many valuable suggestions. We would like to thank Richard Winston from the U.S. Geological Survey for his technical support in developing the Chinese version of ModelMuse GUI software. We also appreciate the constructive comments from the editor and anonymous reviewers for improving the manuscript.
References Alt-Epping, P., Zhao, B., 2010. Reactive mass transport modeling of a three-dimensional vertical fault zone with a finger-like convective flow regime. J. Geochem. Explor. 106, 8–23. Anderson, R.F., Bacon, M.P., Brewer, P.G., 1982. Elevated concentrations of actinides in Mono Lake. Science 216 (4545), 514–516. Armbrust, M., Fox, A., Griffith, R., Joseph, A.D., Katz, R., Konwinski, A., Lee, G., Patterson, D., Rabkin, A., Stoica, I., Zaharia, M., 2010. A view of cloud computing. Commun. ACM 53 (4), 50–58. Arnett, R.C., Greenwade, L.E., 2000. Parallel processing of a groundwater contaminant code. Conference Proceedings of Summit 2000, the 42nd Annual Cray Users Group Meeting, Noordwijk, Netherlands. Ashley, S.F., Parks, G.T., Nuttall, W.J., Boxall, C., Grimes, R.W., 2012. Nuclear energy: thorium fuel has risks. Nature 492 (7427), 31–33. Ban, N., Han, J., Ding, Z., 2008. Study on pretreatment process of reverse osmosis technology for tailing water of Baotou Iron and Steel (Group) Co. J. Inn. Mong. Univ. Sci. Technol. 27 (4), 377–380 (In Chinese with English abstract). Behzad, B., Padmanabhan, A., Liu, Y., Liu, Y., Wang, S., 2011. Integrating CyberGIS gateway with Windows Azure: a case study on MODFLOW groundwater simulation. 4th ACM SIGSPATIAL International Workshop on Computational Transportation Science, pp. 26–29. Bias, R., 2010. Grid, cloud, HPC … What's the Diff? http://www.cloudscaling.com/blog/ cloud-computing/grid-cloud-hpc-whats-the-diff/ (accessed August 25, 2013). Charlton, S.R., Macklin, C.L., Parkhurst, D.L., 1997. PHREEQCI—a graphical user interface for the geochemical computer program PHREEQC. US Geological Survey Waterresources Investigations Report 9 (http://wwwbrr.cr.usgs.gov/projects/GWC_ coupled/phreeqci/). Chen, Y., Yan, K., Tian, Y., 2010. Experimental analysis on pretreatment of reusing leak water in tailing dam of Baotou Steel. Sci. Technol. Baotou Steel 36 (2), 75–77 (In Chinese with English abstract). Coulthard, T.J., Macklin, M.G., 2003. Modeling long-term contamination in river systems from historical metal mining. Geology 31 (5), 451–454. Dave, A., Lu, W., Jackson, J., Barga, R., 2011. CloudClustering: toward an iterative data processing pattern on the cloud. Parallel and Distributed Processing Workshops and Phd Forum (IPDPSW), 2011 IEEE International Symposium on, pp. 1132–1137. Ebejer, J.P., Fulle, S., Morris, G.M., Finn, P.W., 2013. The emerging role of cloud computing in molecular modelling. J. Mol. Graph. Model. 44, 177–187. Ewing, R.C., 1999. Nuclear waste forms for actinides. Proc. Natl. Acad. Sci. 96 (7), 3432–3439. Fienen, M.N., Kunicki, T.C., Kester, D.E., 2011. CloudPEST: a python module for cloudcomputing deployment of PEST, a program for parameter estimation. U.S. Geological Survey Open-file Report 2011-1062. Foster, I., Zhao, Y., Raicu, I., Lu, S., 2008. Cloud computing and grid computing 360-degree compared. Grid Computing Environments Workshop, 2008. GCE'08, pp. 1–10. Fox, A., 2011. Cloud computing—what's in it for me as a scientist. Science 331 (6016), 406–407.
Gannon, D., Vargas, J., 2012. The Cloud Computing Research Engagement Program. Microsoft Co. 1–118. Gow, P., Upton, P., Hill, K., 2002. Copper–gold mineralization in the New Guinea: numerical modeling of collision, fluid flow and intrusion-related hydrothermal system. Aust. J. Earth Sci. 49, 753–771. Gunarathne, T., Zhang, B., Wu, T.L., Qiu, J., 2013. Scalable parallel computing on clouds using Twister4Azure iterative MapReduce. Futur. Gener. Comput. Syst. 29 (4), 1035–1048. Ham, P.A.S., Schotting, R.J., Prommer, H., Davis, G.B., 2004. Effects of hydrodynamic dispersion on plume lengths for instantaneous bimolecular reactions. Adv. Water Resour. 27, 803–813. Han, J., Ban, N., Ding, Z., 2009. Test research on treating the tailings water leakage of Baotou Steel by lime-soda softening process. Sci. Technol. Baotou Steel (Group) Corp. 35 (2), 79–80 (In Chinese with English abstract). He, J., Lü, C.W., Xue, H.X., Liang, Y., Bai, S., Sun, Y., Shen, L.L., Mi, N., Fan, Q.Y., 2010. Species and distribution of rare earth elements in the Baotou section of the Yellow River in China. Environ. Geochem. Health 32 (1), 45–58. Hobbs, B.E., Zhang, Y., Ord, A., 2000. Application of coupled deformation, fluid flow, thermal and chemical modeling to predictive mineral exploration. J. Geochem. Explor. 69, 505–509. Humphrey, M., Beekwilder, N., Goodall, J.L., Ercan, M.B., 2012. Calibration of watershed models using cloud computing. E-science (e-Science), 2012 IEEE 8th International Conference on, pp. 1–8. Hunt, R.J., Luchette, J., Schreuder, W.A., Rumbaugh, J.O., Doherty, J., Tonkin, M.J., Rumbaugh, D.B., 2010. Using a cloud to replenish parched groundwater modeling efforts. Ground Water 48, 360–365. Hurst, C., 2010. China's Rare Earth Elements Industry: What Can the West Learn? Institute for the Analysis of Global Security (IAGS), Washington, DC 43. Ju, M., Dai, T., Yang, J., 2011. Finite element modeling of pore-fluid flow in the Dachang ore district, Guangxi, China: implications for hydrothermal mineralization. Geosci. Front. 2 (3), 463–474. Kim, S.S., Baik, M.H., Choi, J.W., Shin, H.S., Yun, J.I., 2010. The dissolution of ThO2 (cr) in carbonate solutions and a granitic groundwater. J. Radioanal. Nucl. Chem. 286 (1), 91–97. Kim, I., Jung, J.Y., DeLuca, T.F., Nelson, T.H., Wall, D.P., 2012. Cloud computing for comparative genomics with windows azure platform. Evol. Bioinforma. 8, 527–534. Kollet, S., Schumacher, J., Bürger, C.M., Bösel, D., 2011. Cloud computing with ParFlow: introduction of a newly developed Web interface. MODFLOW and More 2011: Integrated Hydrologic Modeling, Proceedings of the 10th International Conference of the International Ground Water Modeling Center, pp. 52–57. LaFlamme, B.D., Murray, J.W., 1987. Solid\solution interaction: the effect of carbonate alkalinity on adsorbed thorium. Geochim. Cosmochim. Acta 51 (2), 243–250. Langevin, C.D., Panday, S., 2012. Future of groundwater modeling. Ground Water 50 (3), 334–339. Langmuir, D., Herman, J.S., 1980. The mobility of thorium in natural waters at low temperatures. Geochim. Cosmochim. Acta 44 (11), 1753–1766. Li, Y., Lin, N., He, J., Xue, X., Huang, X., 2012. Leaching of rare earth and preparation of cryolite from Baotou magnetic tailings. J. Chin. Soc. Rare Earths 30 (2), 251–256 (In Chinese with English abstract). Li, R., Li, Q., Chen, S., Wu, F., Sun, D., Liao, H., 2013. Distribution of thorium in soils surrounding the rare-earth tailings reservoir in Baotou, China. J. Radioanal. Nucl. Chem. 1–7. http://dx.doi.org/10.1007/s10967-013-2814-2. Lin, G., Hobbs, B.E., Ord, A., Mühlhaus, H.B., 2003. Theoretical and numerical analyses of convective instability in porous media with temperature-dependent viscosity. Commun. Numer. Methods Eng. 19, 787–799. Lin, G., Zhou, Y., Wei, X., 2006. Structure controls on fluid flow and related mineralization in the Xiangshan uranium deposit, Southern China. J. Geochem. Explor. 89, 231–234. Lin, G., Hobbs, B.E., Zhang, L., Zhou, Y., 2008. Potential effects of upward throughflow on thermal structure models within the continental lithospheric mantle–crust. Chin. J. Geophys. 51 (2), 393–401. Lin, G., Peng, M., Zhang, L., Zhang, D., Liu, S., 2009. Numerical analysis and simulation experiment of lithospheric thermal structures in the South China Sea and the Western Pacific. J. Earth Sci. 20, 85–94. Liu, L., Yang, G., Peng, S., 2005. Numerical modelling of coupled geodynamical processes and its role in facilitating predictive ore discovery: an example from Tongling, China. Resour. Geol. 55, 21–31. Liu, L., Shu, Z., Wan, C., Cai, A., Zhao, Y., 2008. The controlling mechanism of ore formation due to flow-focusing dilation spaces in skarn ore deposits and its significance for deep-ore exploration: examples from the Tongling–Anqing district. Acta Petrol. Sin. 24, 1848–1856. Liu, L., Wan, C., Zhao, Y., 2011a. Geodynamic constraints on orebody localization in the Anqing orefield, China: computational modeling and facilitating predictive exploration of deep deposits. Ore Geol. Rev. 43, 249–263. Liu, Y., Nelson, K.M., Hipke, W.E., 2011b. Cyber-enabled MultiModel computing for groundwater risk analysis on the Windows Azure Cloud. MODFLOW and More 2011: Integrated Hydrologic Modeling, Proceedings of the 10th International Conference of the International Ground Water Modeling Center, pp. 442–446. Liu, Y., Sun, A.Y., Nelson, K., Hipke, W.E., 2012. Cloud computing for integrated stochastic groundwater uncertainty analysis. Int. J. Digit. Earth 5, 1–25. Lu, W., Jackson, J., Barga, R., 2010. AzureBlast: a case study of developing science applications on the cloud. Proceedings of the 19th ACM International Symposium on High Performance, Distributed Computing, pp. 413–420. Luchette, J., Nelson, G.K., McLane, C.F., Cecan, L.I., 2009. Unlimited virtual computing capacity using the cloud for automated parameter estimation. Proceedings of the 1st PEST Conference, pp. 1–16.
Please cite this article as: Huang, X., et al., Reactive transport modeling of thorium in a cloud computing environment, J. Geochem. Explor. (2014), http://dx.doi.org/10.1016/j.gexplo.2014.03.006
X. Huang et al. / Journal of Geochemical Exploration xxx (2014) xxx–xxx Ma, R., Zheng, C., Prommer, H., Greskowiak, J., Liu, C., Zachara, J., Rockhold, M., 2010. A field‐scale reactive transport model for U (VI) migration influenced by coupled multirate mass transfer and surface complexation reactions. Water Resour. Res. 46, W05509. http://dx.doi.org/10.1029/2009WR008168. Ma, R., Zheng, C., Liu, C., 2012. Groundwater impacts of radioactive wastes and associated environmental modeling assessment. In: Meyers, R.A. (Ed.), Encyclopedia of Sustainability Science and Technology. Springer, pp. 4774–4784. Miao, F., Si, W., Liu, J., Wang, J., Zhang, X., Cai, L., 2012. Study on oxidative damage and DNA damage in Misgurnus anguillicaudatas caused by the tailing lake seepage. Guangdong Agric. Sci. 38 (24), 162–164 (In Chinese with English abstract). Miekeley, N., Linsalata, P., Osmond, J.K., 1992. Uranium and thorium isotopes in groundwaters from the Osamu Utsumi mine and Morro do Ferro natural analogue sites, Pocos de Caldas, Brazil. J. Geochem. Explor. 45 (1), 345–363. Miras, H., Jiménez, R., Miras, C., Gomà, C., 2013. CloudMC: a cloud computing application for Monte Carlo simulation. Phys. Med. Biol. 58 (8), N125–N133. Olin, M., Lehikoinen, J., 1997. Application of surface complexation modelling. http://www. posiva.fi/files/2662/POSIVA-97-10_web.pdf (accessed March 13, 2013). Ord, A., Hobbs, B.E., Zhang, Y., Broadbent, G.C., Brown, M., Willetts, G., Sorjonen-Ward, P., 2002. Geodynamic modeling of the Century deposit, Mt Isa Province, Queensland. Aust. J. Earth Sci. 49, 1011–1039. Pan, S., 2010. A Study on the Stability of Baogang Tailings Dam. (M.S. Thesis) China University of Geosciences (Beijing), Beijing, China (In Chinese with English abstract). Prommer, H., Post, V., 2010. A reactive multicomponent transport model for saturated porous media, user's manual v2.10. http://www.pht3d.org. Prommer, H., Barry, D.A., Zheng, C., 2003. MODFLOW/MT3DMS based reactive multicomponent transport modelling. Ground Water 41 (2), 247–257. Quiroga, V.M., Popescu, I., Solomatine, D.P., Bociort, L., 2013. Cloud and cluster computing in uncertainty analysis of integrated flood models. J. Hydroinf. 15 (1), 55–70. Rand, M., Fuger, J., Grenthe, I., Neck, V., Rai, D., 2008. Chemical thermodynamics of thorium. In: Mompean, F.J. (Ed.), Chemical Thermodynamics, vol. 11. OECD, Nuclear Energy Agency. Sanford, W.E., Caine, J.S., Wilcox, D.A., McWreath, H.C., Nicholas, J.R., 2006. Research opportunities in interdisciplinary ground-water science in the U.S. Geological Survey. USGS Circular, 1293. U.S. Geological Survey, Reston, Virginia. Saripalli, P., Oldenburg, C., Walters, B., Radheshyam, N., 2011. Implementation and usability evaluation of a cloud platform for scientific computing as a service (SCaaS). Utility and Cloud Computing (UCC), 2011 Fourth IEEE International Conference on, pp. 345–354. Schmidt Mumm, A., Brugger, J., Schacht, U., 2010. Fluids in geological processes: the present state and future outlook. J. Geochem. Explor. 106, 1–7. Serco, 2011. Update of thermodynamic data for thorium in the HATCHES database. United Kingdom http://www.nda.gov.uk/documents/biblio/upload/Serco-Report-TCS_ 00473_005-Issue-2-Final.pdf (accessed March 15, 2013). Sorjonen-Ward, P., Zhang, Y., 2002. Numerical modelling of orogenic processes and mineralization in the south eastern part of the Yilgarn Craton, Western Australia. Aust. J. Earth Sci. 49, 935–964. Steefel, C.I., Lasaga, A.C., 1994. A coupled model for transport of multiple chemical species and kinetic precipitation/dissolution reactions with application to reactive flow in single phase hydrothermal systems. Am. J. Sci. 294 (5), 529–592. Stockdale, A., Bryan, N.D., 2013. The influence of natural organic matter on radionuclide mobility under conditions relevant to cementitious disposal of radioactive wastes: a review of direct evidence. Earth Sci. Rev. 121, 1–17. Subramanian, V., Wang, L., Lee, E.J., Chen, P., 2010. Rapid processing of synthetic seismograms using Windows Azure Cloud. Cloud Computing Technology and Science (CloudCom), 2010 IEEE Second International Conference on, pp. 193–200. Sun, A., 2013. Enabling collaborative decision-making in watershed management using cloud-computing services. Environ. Model Softw. 41, 93–97. Syed, H.S., 1999. Comparison studies adsorption of thorium and uranium on pure clay minerals and local Malaysian soil sediments. J. Radioanal. Nucl. Chem. 241 (1), 11–14. Vaquero, L.M., Rodero-Merino, L., Caceres, J., Lindner, M., 2009. A break in the clouds: towards a cloud definition. ACM SIGCOMM Comput. Commun. Rev. 39 (1), 50–55.
11
Wang, Y., Tu, X., 1990. Percolating waters effect on quality of groundwater and soil salinization from the tailing pond of the Baotou Steel and Iron Company. Min. Geol. 11 (4), 43–49 (In Chinese with English abstract). Wang, L., Zhang, L., Bai, L., Liu, Y., Liu, G., Wang, X., He, Q., Chen, X., 2002. Radiological impacts of Baotou Rare Earth industrial wastewater on surface water/groundwater in Baotou reach of Yellow River. Chin. Rare Earths 23 (4), 72–77 (In Chinese). Wang, L., Zhang, L., Bai, L., Wang, X., 2003. Radioactive impact on water resource in Baotou city. Chin. J. Radiol. Med. Prot. 23 (3), 218–219 (In Chinese). Wang, J., Miao, F., Zheng, C., Zhang, X., 2011. Effects of ground water surrounded with tailings dam of Baotou Iron and Steel (Group) Co. on the growth of corn and the study of the cells' DNA damage. J. Inn. Mong. Univ. Sci. Technol. 30 (4), 387–389 (In Chinese with English abstract). Winston, R.B., 2009. ModelMuse — A Graphical User Interface for MODFLOW–2005 and PHAST: U.S. Geological Survey Techniques and Methods 6-A29. 52 (http://pubs. usgs.gov/tm/tm6A29). Wu, Q., Liu, H., Ma, C., Zhao, S., Zhu, X., Xiong, S., Wang, H.Y., 2011. Investigation of radiological environment impact from exploitation of Bayan Obo mine. Radiat. Prot. 31 (6), 364–370 (In Chinese with English abstract). Xing, H.L., Makinouchi, A., 2008. Three-dimensional finite element simulation of large-scale nonlinear contact friction problems in deformable rocks. J. Geophys. Eng. 5, 27–36. Xu, G., Shi, C., Wang, D., Zhao, Z., Wang, D., He, Z., Wang, N., Fang, S., Guo, M., Ouyang, Y., Fei, W., Yang, Y., Li, D., Tang, X., Gu, Z., 2005. An emergency call for the protection of thorium and REEs resources at Bayan Obo and the prevention of radioactive contamination of the Yellow River and Baotou. Bull. Chin. Acad. Sci. 20 (6), 448–450 (In Chinese). Yan, Y., Lin, G., Wang, Y.J., Guo, F., Li, Z.A., 2003. Apatite fission track age of Mesozoic sandstones from Beipiao basin, eastern China: implications for basin provenance and tectonic evolution. Geochem. J. 37, 377–389. Yang, C., Xu, Y., Nebert, D., 2013. Redefining the possibility of digital Earth and geosciences with spatial cloud computing. Int. J. Digit. Earth 6 (4), 1–16. Zhang, G., Yang, M., Yan, L., 1997. On solonchak character of the Baotou city Quanbatu industrial pollution area. J. Neimenggu For. Coll. 19 (2), 1–7 (In Chinese with English abstract). Zhang, Y., Hobbs, B.E., Ord, A., Barnicoat, A., Lin, G., 2003. The influence of faulting on hostrock permeability, fluid flow and ore genesis of gold deposits: a theoretical 2D numerical model. J. Geochem. Explor. 78–79, 279–284. Zhang, Y., Yan, W., Zhang, L., He, Q., Zhu, Z., Zhang, Y., 2004. Radioactive contamination survey in the country of Dalahai and Boerhantu, Baotou, China. Chin. J. Urban Rural Ind. Hyg. 99, 8–9 (In Chinese). Zhang, Y., Schaubs, P.M., Ord, A., Hobbs, B.E., Barnicoat, A., 2008. Fault-related dilation, permeability enhancement, fluid flow and mineral precipitation patterns: numerical models. In: Wibberley, C.A.J., Kurz, W., Imber, J., Holdsworth, R.E., Collettini, C. (Eds.), The Internal Structure of Fault Zones: Implications for Mechanical and Fluid-flow Properties. Geological Society, 299. Special Publications, London, pp. 239–255. Zhao, G., 2006. B.G. Steel and Perimeter Region Water Environment Quantity Evaluation is With the Water Environmental Protection Counterplan Research. (M.S. Thesis) Xi'an University of Architecture and Technology, Xi'an, China (In Chinese with English abstract). Zhao, C., 2009. Dynamic and Transient Infinite Elements: Theory and Geophysical, Geotechnical and Geoenvironmental Applications. Springer, Berlin. Zhao, C., Hobbs, B.E., Ord, A., 2008a. Convective and Advective Heat Transfer in Geological Systems. Springer, Berlin. Zhao, C., Hobbs, B.E., Hornby, P., Ord, A., Peng, S., Liu, L., 2008b. Theoretical and numerical analyses of chemical-dissolution front instability in fluid-saturated porous rocks. Int. J. Numer. Anal. Methods Geomech. 32, 1107–1130. Zhao, C., Hobbs, B.E., Ord, A., 2009. Fundamentals of Computational Geoscience: Numerical Methods and Algorithms. Springer, Berlin. Zhao, C., Hobbs, B.E., Ord, A., 2010. Theoretical analyses of nonaqueous-phase-liquid dissolution induced instability in two-dimensional fluid-saturated porous media. Int. J. Numer. Anal. Methods Geomech. 34, 1767–1796. Zheng, C., Bennett, G.D., 2002. Applied Contaminant Transport Modeling, 2nd edition. Wiley-Interscience, New York.
Please cite this article as: Huang, X., et al., Reactive transport modeling of thorium in a cloud computing environment, J. Geochem. Explor. (2014), http://dx.doi.org/10.1016/j.gexplo.2014.03.006