Bangladesh Journal of Medical Physics
Vol. 10, 2017
Real-Time Classification of Multi-Channel Forearm EMG to Recognize Hand Movements using Effective Feature Combination and LDA Classifier Muhammad Sabbir Alam, A S M Shamsul Arefin* Department of Biomedical Physics and Technology, University of Dhaka, Dhaka - 1000, Bangladesh * Corresponding Author email:
[email protected] [Received: 11 September, 2018, Accepted: 25 October, 2018]
ABSTRACT Electromyography (EMG) signals acquired from surface of arms can be crucial in recognizing nature of hand gestures. The concept is used in current highly demanding fields such as controlling prosthetic limbs, diagnosing neuromuscular disorders, manipulation of robotic arm etc. The purpose of the work was to classify a set of hand motions from corresponding multi-channel surface EMG signals by developing MATLAB tools. The research focused on extracting multiple signal features and finding the appropriate combination of extracted intelligible features to get the best classification accuracy for the specific set of hand gestures. For dynamic and fast classification purpose, linear discriminant analysis (LDA) classifier was employed. Effect of feature dimensionality reduction on classification accuracy was also investigated via Principal Component Analysis (PCA) in this research. Finally, the research analyzed different electrode placements by comparing classification accuracy for each of the set of motions and proposed a simple and compact data acquisition instrumentation having less number of electrodes while maintaining high classification accuracy. Keywords: EMG, Hand movements, Linear Discriminant Analysis (LDA), Principal Component Analysis (PCA).
INTRODUCTION Electromyography (EMG) represents electrical activity of skeletal muscle tissue. Normally EMG is recorded using small electrodes attached to the skin above the muscle or electrodes inserted into the muscle (Reaz et al., 2006). For a specific hand motion, specific sets of muscles are more active and hence results in generation of more electrical activity from those muscles. The motor unit action potentials are summed up to produce a specific kind of EMG signal pattern and these 25
Bangladesh Journal of Medical Physics
Vol. 10, 2017
patterns are similar when same movement is done. These similarities can be exploited to classify type of hand motion (Ishikawa & Matsumura, 1999). EMG signals are useful for different applications of human computer interface. In the past few decades, researchers used many approaches and methods for classification of EMG signal. Initial research related to myoelectric signal control was performed in 1940s (Reiter, 1948). The next major step in research occurred when Hudgins et al. introduced a multifunctional myoelectric control system (Hudgins et al., 1993), which achieved decent performance in classifying multiple movements using multiple signal features and an artificial neural network classifier. With the purpose of maximizing classification accuracy for a given set of movements, the research may involve testing a variety of methods for different control system elements (e.g. feature set, classifier). Many researchers have achieved high classification accuracy using various combinations of pre-processing, extracted features, classifiers, and post-processing (Hudgins et al., 1993; Englehart & Hudgins, 2003; Oskoei & Hu, 2007). Englehart and Hudgins observed that linear discriminant analysis (LDA) classifier combined with four time domain features including mean absolute value, waveform length, zero crossings, and slope sign change can be used as an effective real-time control scheme for EMG pattern recognition for static conditions (Englehart & Hudgins, 2003). Zardoshti et al. evaluated a number of features that are now commonly used for EMG signal classification, including integrated absolute value, zero crossings, and autoregressive coefficients (Zardoshti et al., 1993). Other features including time-frequency features (e.g. wavelets and wavelet packets) have also been investigated (Englehart et al., 1999). Besides feature sets and classifiers, research on dimensionality reduction methods and majority vote postprocessing have been conducted (Englehart et al., 2003). Researches concerning classification of surface EMG signals for specific applications are still on going. The objective of the study was to determine methods for real-time and fast classification of EMG signals obtained from specific hand movements. A comparative analysis of effects of extracted features, feature combinations, reduced feature dimension etc. on classification accuracy was performed. Furthermore, by measuring classification accuracy for signals from each of the electrode channels exclusively, a simpler but effective electrode placement paradigm for fast and real-time classification was proposed.
26
Bangladesh Journal of Medical Physics
Vol. 10, 2017
Rationale Critical issues associated with accuracy of identification of motions from surface EMG signals lie in electrode placement, correlation among different channels, feature extraction, classifier selection etc. (Tang et al., 2012). One of the challenges is the placement of surface EMG electrodes. By knowing distribution of corresponding muscles for the hand motions, existing systems are designed so that the signal acquisition electrodes are placed on the skin surface right above the corresponding muscles. Correct identification is highly dependent on proper alignment of the electrodes and failure to do so may result in false identification (Tang et al., 2012). In addition, feature extraction is another critical issue related to successful identification of motions. Given the case that only fixed types of motions are involved, the features may affect the success rate of identification process differently (Tang et al., 2012). Hence, comparison of classification rate for different extracted features and their combinations can help to identify possible feature combinations for higher classification accuracy. Moreover, selecting appropriate classifier is also a critical issue for successful dynamic identification of hand motions. For specified set of motions, sometimes computationally simpler classifiers are faster. Therefore, it can bring significantly high classification accuracy in real-time. The conditions mentioned above are the factors behind the motivation on classification of multichannel surface EMG signal for a specific set of hand motions, so that one can analyze effect of electrode placement on classification accuracy, compare effectiveness of different time domain and frequency domain features on successful identification of motions, and to realize efficacy of chosen classifier. METHODOLOGY The study paradigm of this research work is presented in Fig. 1. The EMG data were collected from Myoelectric Control Lab (MECLab), Carleton University, Canada (Chan, 2017). Processing of collected data, data windowing, feature extraction, feature reduction and classification were performed using MATLAB. First, the collected EMG data were filtered to reduce noise from data. From windowed data sets, different signal features were extracted. The features from different sets of EMG signal data were used as training and testing features for classification. Preferred classifier
27
Bangladesh Journal of Medical Physics
Vol. 10, 2017
was Linear Discriminant Analysis (LDA) classifier because of its simplistic, efficient and fast classification (Englehart & Hudgins, 2003). Signal Processing of Collected EMG Data
Extraction of Features
Dimensionality Reduction
Application of Classifier
Hand Movement Recognition
Figure 1: Block diagram of classification of hand motions from EMG signals.
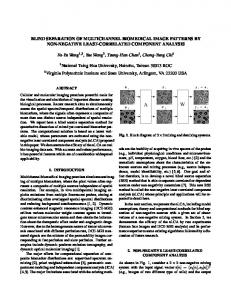
Seven distinct hand motions were considered as represented in Fig. 2. These are numbered from 1 to 7 as - 1. Hand open, 2. Hand close, 3. Wrist flexion, 4. Wrist extension, 5. Pronation, 6. Supination, 7. Rest (No movement). On the classification accuracy plots, the movements were represented with corresponding numbers mentioned here.
Figure 2: Selected hand motions for classification (Lyons & Joshi, 2015)
Data Source Chan (Chan, 2017) recorded the EMG signals from seven sites on the forearm and one site on the bicep. The used electrodes were Duo-trode Ag-AgCl electrodes. An Ag-AgCl Red-Dot electrode was placed on the wrist to provide a common ground reference. The electrode placement is shown in Fig. 3. The electrodes are numbered from ‘1’ to ‘8’. Electrode number 3, 4, 5, 6 and 7 were placed in equidistance around the forearm. A sample EMG data is demonstrated in Fig. 4. The subject underwent several trials in the data collection process. In each trial, the subject performed each motion types four times, holding each motion for a period of three seconds each time. In different trials, order of these motions was randomized. Moreover, five seconds of rest period was introduced at the start and end of each trial to avoid data being cutoff while collecting the data. Each trial was around 104 seconds in length and excluding the initial and final rest period, it was around 94 seconds. While collecting myoelectric signal, the signals were amplified with a gain of 1000, and were filtered with bandwidth of 1Hz to 1 kHz. Finally, the signals were sampled at 3 kHz using an analog to digital converter. 28
Bangladesh Journal of Medical Physics
Vol. 10, 2017
Figure 3: Electrode placement on right arm (Chan, 2017). 1
Amplitude(V)
0.5
0
-0.5
-1
0
0.5
1
1.5
2
2.5
3 5
Samples
x 10
Figure 4: A sample EMG data recorded from electrode No. 1.
Data Processing The collected EMG signals were filtered to reduce noise. Butterworth filter with cutoff frequency of 50Hz and 450Hz was used to reduce noise from the collected data. Next, the signals were down sampled from 3 kHz to 1 kHz. Signal phases did not change from initial state because of zero phase filtering. Since the collected EMG data had stochastic nature, it was difficult to extract too much information from the samples alone. Therefore, some windowing or smoothing technique was required for calculating intelligible features from a small set of data (Khushaba et al., 2012). In general, the window size was related to the EMG data length and the number of training features. The relation can be expressed by following equation: Number of training feature =
length of data−window size
29
window separation
+ 1.
Bangladesh Journal of Medical Physics
Vol. 10, 2017
Overlapping window scheme was chosen for the advantage of better classification accuracy (Englehart & Hudgins, 2003). In case of real-time EMG classification applications, a general practice is maintained that the window length should be less than 300ms (Khushaba et al., 2012). Hence, for satisfying the condition of dynamic classification, window size of 256 samples (256ms) and window separation of 128 samples (128ms) were chosen. Since, there is a motion class associated to each sample of the recorded EMG signals, the motion class of an entire window is selected by a majority vote of the classed samples inside a window. Extracted Features The following features were extracted for the study: Root mean square (RMS), Mean absolute value (MAV), Variance (VAR), Autoregressive coefficients (AR), Zero-crossing (ZC), Slope sign change (SSC), and Waveform length (WL). RMS feature represents the mean power of the EMG signal. RMS can be expressed as 𝑁
1 rms = √ ∑ 𝑥𝑛2 𝑁 𝑛=1
where, xn is EMG signal in a window and N is window length. MAV feature represents average absolute value of EMG signal. MAV can be expressed as 𝑁
1 mav = √ ∑|𝑥𝑛 | 𝑁 𝑛=1
where, xn is EMG signal in a window and N is window length. Variance of EMG signal can be expressed as N−1
1 VAR = ∑(xn − x̅)2 N n=1
where, 𝑥̅ is mean value of signal in corresponding window, xn represents EMG signal in a window and N is window length.
30
Bangladesh Journal of Medical Physics
Vol. 10, 2017
Autoregressive model describes each sample of EMG signal as a linear combination of previous samples plus white noise. AR model can be expressed as p
xn = − ∑ ai xn−i + wn i=1
Where, xn is a sample of AR model, ai is AR coefficient, wn is white noise, and p is the order of AR model. The order used for AR feature extraction is 4. ZC feature represents the number of times EMG signal values cross the amplitude zero from positive to negative or negative to positive amplitude. The threshold condition is used to reduce effect of background noise. It can be expressed as N−1
zc = ∑[sgn(xn xn+1 ) ∩ |xn − xn+1 | ≥ threshold] n=1
sgn(x) = {
1, 0,
if x ≥ threshold otherwise
where, zc is the number of zero crossing for one window segment. ZC feature can be improved by reducing signal with amplitude within certain range (in both positive and negative direction) to zero. The range of the amplitude where signals are zero padded is called the dead zone. SSC feature represents an approximate estimation of frequency information of surface EMG signal. The number of changes between positive and negative slope among three consecutive segments are performed with the threshold function for avoiding interference in EMG signal. It can be expressed as N−1
ssc = ∑[f[(xn − xn−1 ) × (xn − xn+1 )]] n=1
1, f(x) = { 0,
if x ≥ threshold otherwise
where, ssc is number of times slope sign changes from positive to negative or negative to positive. N is window length. Similar to zero crossing feature, SSC feature can be improved by introducing dead zone. 31
Bangladesh Journal of Medical Physics
Vol. 10, 2017
Waveform length is cumulative length of waveform over the time segment. It can be expressed as N−1
WL = ∑|xn+1 − xn | n=1
where, xn represents EMG signal in a window and N is window length. Feature reduction method and Classifier Principal Component Analysis (PCA) technique was used for feature reduction in this work. PCA is an unsupervised method which is used to reduce the dimensionality of data sets containing large set of interrelated variables, by maintaining variation in data sets as much as possible (Jolliffe, 2002). As classifier, Linear Discriminant Analysis (LDA) was employed because of its high accuracy, efficiency, and fast classification (Englehart & Hudgins, 2003). The extracted features were used as training or testing data for classifier. The major computation of training the LDA classifier was to calculate mean vector, common covariance matrix and inverse matrix. The classifier compares the testing matrix to the training matrix and produces a decision. This decision is one of the classes of hand motion. Since the classifier is linear and it does not require iterative training, it takes less computational time. Based on the reduced features, a compact electrode placement paradigm for fast and real-time classification was proposed. RESULTS AND DISCUSSIONS Classification Error for Different Extracted Features and their combination The classification accuracy of hand motions obtained from our estimations was mostly over 90%. Therefore, instead of accuracy, classification error was illustrated for better visualization. Fig. 5 illustrates classification error for extracted features and provides a graphical comparison among the used features. From the observation, the classification error is least for the zero crossing feature and most for the variance feature. Features were combined to form multiple feature sets. Since different feature sets contain different information regarding EMG signal, an effective combination can result in higher classification accuracy. Classification error with these feature sets were analyzed in this section. Since there were seven features and considering at least two features in each combination, 120 combinations are possible. Hence, combinations of features with high classification accuracy are discussed here. 32
Bangladesh Journal of Medical Physics
Vol. 10, 2017
The employed feature sets are listed in Table 1. The classification error for these combinations are shown in Fig. 6. From the listed sets of features, the least classification error was obtained from feature set 8, where RMS, MAV, AR, ZC, and SSC features are combined to form the feature set. The result suggests that effective combination of features will result in higher classification
Classification Error (%)
accuracy. 20.00% 18.00% 16.00% 14.00% 12.00% 10.00% 8.00% 6.00% 4.00% 2.00% 0.00%
17.23%
5.63%
RMS
5.94%
6.97%
6.43%
MAV
AR
3.46%
3.79%
ZC
SSC
WL
Features
Fig. 5: Classification error for different features.
Table 1: Selected feature sets. Title
Feature Combination
FS1
RMS, AR
FS2
AR,VAR
FS3
MAV, ZC
FS4
RMS, AR, ZC
FS5
MAV, SSC, WL
FS6
RMS, AR, ZC, SSC
FS7
MAV, WL, ZC, SSC
FS8
RMS, MAV, AR, ZC, SSC
FS9
RMS, MAV, AR, WL, ZC, SSC
FS10
RMS, MAV, AR, WL, ZC, SSC, VAR
33
VAR
Classification Error (%)
Bangladesh Journal of Medical Physics
4.50% 4.00% 3.50% 3.00% 2.50% 2.00% 1.50% 1.00% 0.50% 0.00%
Vol. 10, 2017
4.20% 3.63%
3.46%
3.23% 2.76%
FS1
FS2
FS3
FS4
3.24% 2.83%
2.59%
FS5
FS6
2.43% 2.49%
FS7
FS8
FS9
FS10
Feature Sets
Figure 6: Classification error for different feature sets.
Classification Accuracy with Dimensionality Reduction High dimensionality of features can result in more computational time for motion classification. Therefore, dimensionality reduction methods are performed to reduce number of features. Principal component analysis (PCA) algorithm was employed for feature reduction in this work. Fig. 7(a) illustrates classification accuracy as a function of feature dimensionality. Here, the RMS value and first four autoregressive coefficients were used as the feature vector (dimensionality is 40 = 8 channels × 5 features/channel). With PCA, features are reduced to make dimensionality less than 40. With this process, parts of the data with the highest variance is kept. The new features are assumed to contain the most important variance for discrimination. The figure shows that, with increase in dimensionality of the feature, classification accuracy increases. However, after a certain point, the classification accuracy almost converges. Here, classification accuracy is almost similar from feature set dimension 15 to 40 (average 95.52% & standard deviation 0.6%). Likewise, similar result is obtained for PCA feature reduction using RMS, ZC and AR features (dimensionality 48) which is illustrated in Fig. 7(b). In this case, classification accuracy is almost similar from feature set dimension 15 to 48 (average 97.06% with standard deviation 0.26%). In addition, classification accuracy increases negligibly from feature dimension 15 to 30. Therefore, with PCA feature reduction, high classification accuracy is achievable with relatively lower feature dimensionality. Having less computational complexity with reduced features, the classifier takes less time to identify motions.
34
Vol. 10, 2017
100
100
90
90
Classification accuracy (%)
Classification accuracy (%)
Bangladesh Journal of Medical Physics
80
70
60
70
60
50
50
40
80
5
10
15
20
25
30
35
40
40
5
10
15
20
25
30
35
40
45
Dimension of feature
Dimension of feature
(b)
(a)
Figure 7: Classification accuracy with PCA feature reduction using (a) RMS and AR features, (b) RMS, ZC and AR features.
Classification Accuracy for Signals from Different Channels The electrodes receive EMG signal from different area of skin surface depending upon their placement. Thus, the eight electrodes acquired different EMG signals for an identical hand motion. However, there can be correlation between signals from different electrodes/channels. Therefore, EMG signals from the electrodes were employed alone to check and compare efficiency in hand motion classification. By investigating signals from each electrode exclusively, it is possible to propose a simpler data acquisition instrumentation having less number of electrodes while maintaining high classification accuracy. Figs. 8(a) to 8(h) demonstrate classification accuracy employing signal from each channel exclusively. Feature combination set of RMS, MAV, ZC, SSC, and AR was used as extracted feature for classifier. While signal from an electrode was employed, signals from other electrodes were not used. From the classification accuracy observed in Fig. 8, it is evident that each electrode signal had higher or lower classification accuracy for identifying a specific hand motion. For example, while classification accuracy of supination corresponding to signal of electrode No. 5 is high, it is much lower for signal from electrode No. 4. Fig. 8(a) shows classification accuracy for signal from electrode No. 1. Here, hand motion class 2 (hand close) had higher classification accuracy (above 90%) than all other motion class. Contrarily, hand motion class 1 had very low classification accuracy (below 20%). Fig. 8(b) shows higher 35
Bangladesh Journal of Medical Physics
Vol. 10, 2017
classification accuracy (around 90%) of motion class 4 and 7 (wrist extension and rest) for signal from electrode No. 2. Fig. 8(c) shows higher classification accuracy (above 95%) of motion class 4 and lower classification accuracy (around 50%) of motion class 5 (supination) using signal from electrode No. 3. Likewise, the rest of the figures from Fig. 8 show classification accuracy of hand
100
90
90
80 70 60 50 40 30 20 10 0
100 90
Overall classification accuracy (%)
100
Overall classification accuracy (%)
Overall classification accuracy (%)
motion class (1 to 7) for signal from other electrodes.
80 70 60 50 40 30 20
2
3
4
5
6
0
7
60 50 40 30 20
0 1
2
3
4
Hand Movements
5
6
7
1
(b) Electrode No. 2
90
70 60 50 40 30 20
80 70 60 50 40 30 20
10
10
0
0
3
4
5
6
7
Overall classification accuracy (%)
100
90
Overall classification accuracy (%)
100
80
1
6
7
80 70 60 50 40 30 20
2
3
4
5
6
0
7
1
2
3
Hand Movements
(d) Electrode No. 4 100
100
90
90
80 70 60 50 40 30 20
4
5
6
7
Hand Movements
(e) Electrode No. 5
Overall classification accuracy (%)
Overall classification accuracy (%)
5
10
Hand Movements
(f) Electrode No. 6
80 70 60 50 40 30 20 10
10 0
4
(c) Electrode No. 3
90
2
3
Hand Movements
100
1
2
Hand Movements
(a) Electrode No. 1
Overall classification accuracy (%)
70
10
10
1
80
1
2
3
4
5
6
0
7
1
2
3
4
5
6
7
Hand Movements
Hand Movements
(g) Electrode No. 7
(h) Electrode No. 8
Figure 8: Classification accuracy using signal from only one electrode with RMS, MAV, AR, ZC, and SSC features.
36
Bangladesh Journal of Medical Physics
Vol. 10, 2017
Proposed paradigm for compact electrode placement The average classification accuracy in Fig. 8 was the highest for electrode No. 5 (88.67%). Therefore, EMG signal from electrode No. 5 carries most intelligible information for classification. Average classification accuracy for most suitable sets of three electrodes is shown in Table 2. The combination of signals from electrode No. 1, 5, 6 gave the highest average classification accuracy (96.65%) among the combinations. However, signals form three electrode sets (3, 4, 5), (3, 5, 6) and (4, 5, 6) also gave average classification accuracy close to the highest. Since these combinations are placed on forearm near elbow, three electrodes can be used in ring form near elbow employing fewer channels as presented in Fig. 9. According to this observation, significantly high classification accuracy can be achieved with this simpler data acquisition method with only three electrodes.
Table 2: Average classification accuracy using signal from three electrodes with RMS, MAV, AR, ZC, and SSC features. Electrode No.
Avg. Classification Accuracy (%)
1, 3, 5
96.14
2, 3, 5
95.81
3, 4, 5
95.96
1, 5, 6
96.65
2, 5, 6
96.03
3, 5, 6
96.50
4, 5, 6
96.47
37
Bangladesh Journal of Medical Physics
Vol. 10, 2017
Ring Electrode at 3, 4, 5 positions
References Electrode
Figure 9: Proposed ring electrode placement on right arm.
CONCLUSION AND FUTURE WORK A real-time fast classification of multi-channel forearm surface EMG signals using Linear Discriminant Analysis (LDA) classifier was performed in this work. Classification accuracy for different extracted features were compared to find effective feature combination. Moreover, classification accuracy was checked using PCA based dimensionality reduction technique. Finally, a compact EMG data acquisition method was suggested by comparing classification accuracy for EMG signals from each channel exclusively. The combination of RMS, MAV, AR, ZC, and SSC features provided maximum classification accuracy (97.57%). With the suggested simpler data acquisition protocol, this feature combination provided computationally fast classification while maintaining a high accuracy of 96.50%. However, the classification was subject-specific in this work. Using training data from one person and testing data from another, a more general case can be experimented. REFERENCES Chan, A. D. C., 2017. EMG Data from Myoelectric Control Lab (MECLab), Carleton University, Canada. [Online]. Englehart et al., 1999. Classification of the myoelectric signal using time-frequency based representations. Medical Engineering and Physics, 21(6), pp. 431-438.
38
Bangladesh Journal of Medical Physics
Vol. 10, 2017
Englehart et al., 2003. Continuous multifunction myoelectric control using pattern recognition. Technology and disability, 15(2), pp. 95-103. Englehart, K. & Hudgins, B., 2003. A robust, real-time control scheme for multifunction myoelectric control. IEEE transactions on biomedical engineering, 50(7), pp. 848-854. Hudgins et al., 1993. A new strategy for multifunction myoelectric control. IEEE Transactions on Biomedical Engineering, 40(1), pp. 82-94. Ishikawa, M. & Matsumura, H., 1999. Recognition of a hand-gesture based on self-organization using a DataGlove. Perth, Australia, In Proceedings of the 6th International Conference on Neural Information Processing, IEEE, pp. 739-745. Jolliffe, I., 2002. Principal Component Analysis. 2nd ed. s.l.:Springer-Verlag New York. Khushaba et al., 2012. Toward improved control of prosthetic fingers using surface electromyogram (EMG) signals. Expert Systems with Applications, 39(12), pp. 10731-10738. Lyons, K. R. & Joshi, S. S., 2015. A case study on classification of foot gestures via surface electromyography. s.l., Annu. Conf Rehabil. Eng. Assist. Technol. Soc. Am. (RESNA), pp. 1-5. Oskoei, M. A. & Hu, H., 2007. Myoelectric control systems—A survey. Biomedical Signal Processing and Control, 2(4), pp. 275-294. Reaz et al., 2006. Techniques of EMG signal analysis: detection, processing, classification and applications. Biological procedures online, 8(1), pp. 11-35. Reiter, R., 1948. Eine Neue Elektrokunsthand. Grenzgebiete der Medizin, 1(4), pp. 133-135. Tang et al., 2012. Hand motion classification using a multi-channel surface electromyography sensor. Sensors, 12(2), pp. 1130-1147. Zardoshti et al., 1993. Evaluation of EMG features for movement control of prostheses. San Diego, CA, USA, In Proceedings of the 15th Annual International Conference of the IEEE Engineering in Medicine and Biology Society.
39