bDepartment of Wood Science and Forest Products, Virginia Tech, Blacksburg, .... The resulting patent pending color sorting technology is flexible and permits ... precisely, and this information is going to be used to do the color sorts during the .... Compute the reduced measurement vector (reduced Histogram) Ms using the ...
Real-time implementation of a color sorting system a
a
a
a
a
Srikathyanyani Srikanteswara , Qiang Lu , William King , Thomas Drayer , Richard Conners , Earl b c Kline , and Philip Araman a
The Bradley Department of Electrical and Computer Engineering, Virginia Tech, Blacksburg VA 24061 b Department of Wood Science and Forest Products, Virginia Tech, Blacksburg, VA 24061 c Southern Research Station, Forest Service, Virginia Tech, Blacksburg, VA 24061 ABSTRACT
Wood edge glued panels are used extensively in the furniture and cabinetry industries. They are used to make doors, tops, and sides of solid wood furniture and cabinets. Since lightly stained furniture and cabinets are gaining in popularity, there is an increasing demand to color sort the parts used to make these edge glued panels. The goal of the sorting processing is to create panels that are uniform in both color and intensity across their visible surface. If performed manually, the color sorting of edge-glued panel parts is very labor intensive and prone to error. This paper describes a complete machine vision system for performing this sort. This system uses two color line scan cameras for image input and a specially designed custom computing machine to allow real-time implementation. Users define the number of color classes that are to be used. An “out” class is provided to handle unusually colored parts. The system removes areas of character mark, e.g., knots, mineral streak, etc., from consideration when assigning a color class to a part. The system also includes a better face algorithm for determining which part face would be the better to put on the side of the panel that will show. The throughput is two linear feet per second. Only a four inch between part spacing is required. This system has under gone extensive in plant testing and will be commercially available in the very near future. The results of this testing will be presented.
Keywords: color sorting, lumber, machine vision, industrial automation, special purpose hardware 1. INTRODUCTION The manufacture of solid hard wood furniture and cabinets that have relatively large dimensions e.g., door fronts, table tops, etc., are made from edge-glued panels. Edge-glued panels are manufactured by edge gluing hardwood parts together where each part is typically the same length as the panel but is significantly narrower. For the panel to be aesthetically pleasing, each of the parts used to create the panel must have approximately the same color and, to a lesser extent approximately the same grain pattern. To create uniform color panels, the individual parts have to be color sorted. Currently this color and grain sorting must be done by hand. This process is labor intensive and heavily dependent on the subjective decisions made by plant employees, decisions that are typically prone to error. In order to automate this process, there has to be a way of characterizing each color class1. One obvious way is to use a spectrometer to gauge the color characteristics of a part. Unfortunately, while each part might have a predominant color, due to the heterogeneous nature of wood, many other colors are also found in varying quantities. It is this variation that collectively produce a visual effect of a particular shade or color. Hence, if a spectrometer is to be used, it must be applied to a number of locations on a part. Once this data is obtained then there is the problem of how to combine the results of the multiple measurements in a meaningful way in order to completely characterize the part color. Extensive studies have been made as to how the human eye perceives color. Based on these studies the C.I.E. proposed the Trichromatic Theory of Color Perception. This theory states that human color vision is based only on the perception of three colors, red, green, and blue. This leads to the concept of a three dimensional color space where any color can be described as a mixture of these three fundamental colors. Given this fact a seemingly natural way of characterizing the color of a part is by estimating the three-dimensional probability distribution of colors across the part face, i.e., normalizing the three-dimensional (3D) color histogram of a part face.
170
SPIE Vol. 3205
●
0277-786X/97/$10.00
The idea was to use these normalized histograms as the measurement vectors for classifying the panel parts. The underlying assumption was that panel parts which have similar color characteristics should have similar 3D histograms. Given this assumption, easiest way to define a color class is to use a normalized characteristic or normalized “prototype” histogram. The normalized histogram represents the relative frequency of colors found in the representative color samples for this color class. The easiest way to do the classification is to use a difference measurement. This difference measure is calculated to define the difference between the normalized prototype histograms and the normalized histogram of particular panel part face that is to be sorted. To make the procedure more robust a threshold value on the difference measurement is defined for each color class. The part is assigned to the color class that it is closest to as long as it is within the threshold of value for that color class. If it does not lie within the threshold value for any class it is assigned to the out class. Once a color class has been assigned for each part face, a better face analysis is performed to decide which thee of the panel part will be used in the final product. The better face decision is made based on a pre-defined priority for each color class or the distance of each part face is from its color class normalized prototype histogram. Note that some colors are more desirable than others. Hence the system allows plant managers to prioritize the color classes based on desirability. Hence, if a part’s two faces are assigned different color classes, ones with different priorities, then the better face is the one with the most desirable, i.e., higher priority, color. If, on the other hand, if a part’s two faces are assigned to the same color class or to two difference color classes each with the same priority, then the better face is the one that is the closer to its color class prototype. While the above represents the conceptual basis upon which this color sorting system derived, some complications had to be addressed in the final design. First, undesirable features like stains or mineral streak sometimes are present on the faces of panel parts. Manufacturers leave these so called character marks in the parts to improve the number of parts that can be cut from a volume of lumber Unfortunately, these characteristic marks can adversely affect the color sorting process if their colors are included in the 3D histogram used to represent the color of the part face. It is essential that the colors corresponding to these features be removed before forming the prototype histograms or performing classification. Hence, a segmentation scheme had to be developed in order to remove the effects of these character marks 2. Secondly, a 3D histogram composed of the red, green and blue (r, g, b) channels, is very large. If 6 bits are used to represent each of the r, g, b channels, the 3D histogram has 262,144 colors (elements). Given that each color entry in a 3D histogram must have at least 16 bit representation, each histogram requires a good cleat of memory to store. However, even more importantly processing these histograms, i.e., computing all the needed distance measures, is extremely computationally complex. This makes a color sorting system based on the use of such histograms slow and unsuitable for real time operation. Consequently, an alternative approach had to be considered. To address this issue, a color quantization algorithm was developed to reduce the number of colors that had to be considered. This algorithm is a variation of the median cut algorithm developed by Heckbert8. The Heckbert algorithm had to be modified to make removing the effects of character marks simple. Using this algorithm only 2,000 colors need be considered. Obviously, this reduction represents a substantial savings in both storage as well as the time needed to do the processing. Unfortunately, even with the above described reduction in the number of colors that needed to be considered, the system could not reach the required throughput without the development of special purpose hardware3. This represents a third problem that had to be addressed. The special purpose image processing board used in the system was designed and built at Virginia Tech for another application. It called the Modular Reprogrammable Real-time Processing Hardware, or MORRPH5,6. Please note that at the time this system was being developed the MORRPH board represented the only cost effective solution that could be found for the color sorting system. The prototype color sorting system uses two Pulnix color line scan cameras to image the parts, one camera for each part face 4. Each camera has a camera controller which performs the A/D conversion and governs the speed of the cameras. The digital data from each camera controller is input into a MORRPH board. These MORRPH boards which are the heart of the color sorting system are responsible for most of the pre-processing of the images and outputting the color measurement histograms, and also for maintaining proper lighting. The power supply for the light sources has an input that controls the amount of power it outputs. The MORRPH continuously monitors the lighting, varying the signal supplied to the power supply so that almost constant light output is maintained. Clearly, maintaining constant lighting is critical to system operation.
171
The resulting patent pending color sorting technology is flexible and permits different standards of quality control. The sorting process varies not only with hardwood species but also with the product being manufactured, i.e., there might be tighter color quality standards for a high priced item where very few unwanted features are tolerated. To provide flexibility in the manufacturing process, a color sorting device allows the manufacturer to easily change the parameters of classification e.g., number of classes, priorities for each class, amount of defects allowed in each class referred to as it’s tolerance etc. Further the process is done in a real-time mode where speed is a very important issue. This means that a trade off has to be made between the accuracy of the result and the speed with which a system can operate at.
2. ADDRESSING THE PROBLEMS Wood part is heterogeneous in nature and is not of a uniform color over its entire surface. As such its inherent nature complicates the color sorting process. Some of the variations that can occur on a part face include the presence of a low frequency variation in color along the length and width of the piece, a high frequency grain pattern, mineral streaks that appear as dark stains on the wood, small wormholes, and solid knots. Mineral streaks, holes, and solid knots are collectively referred to as character marks. The portion of wood free of all defects and stains is called clear wood. Manufacturers do not want the presence of character marks to affect the color sorting of the part. This means that the color pixels of a character mark must not appear in either the normalized color class prototype histograms or the normalized histograms of the part faces that are to be sort. Including these pixels in any of the normalized histograms will lead to erroneous results. Since character marks are always darker than clear wood, a threshold T cm is determined from the black/white histogram of a part face. All colors that have their b/w (average) value less than Tcm are considered to be from pixels of character marks. The character marks can be removed from the color histograms by setting the colors having a black/white value ( [r+g+b]/3 ) below the threshold Tcm in the histograms to zero. Existing color quantization techniques are designed to reduce the number of colors that are needed to get a “good” color display of a full color image. As such these algorithms can be used to reduce the dimensionality of the normalized histograms used in the color sorting system. But these algorithms are not designed to facilitate the removal of character marks. To facilitate the removal of character marks the colors have to be allocated in the color map in an organized way. This imposes three restrictions on the color quantization algorithm. First, there has to be an easy way of going from the black/white histogram to the reduced color histogram, which is a one dimensional histogram. This avoids storing three values for each pixel. Second, once the colors that should be removed from the color histogram have been determined, there has to be an easy way of removing them, (rather than computing (r+g+b)/3 for every pixel). Third, only those colors that have their average ( (r+g+b)/3 ) below the threshold should be removed, with all, or almost all, the values of the remaining colors in the histogram being unchanged. A color quantization scheme has been developed that can drastically reduce the number of colors used while simplifying the process of removing character marks from the histograms and also rendering a good visual image. This algorithm is based on Heckbert's median cut algorithms. It allocates a certain number of colors to represent the character marks. This allocation of colors facilitates the identification and removal of these colors. The colors used in the images of red oak panel part faces could be reduced from 262,144 to as few as 500 while producing an image almost indistinguishable from the original image. The histograms produced in the resulting reduced color space will be called the reduced normalized color prototype histograms and the reduced normalized color part face histograms. The color sorting process is divided into two phases, training and real-time operation. Training is the process where the color sorting system learns (determines) the tolerance threshold and the class prototype for each color class. Speed is not crucial during training but the results have to be very accurate, i.e., the prototypes of each class have to be determined precisely, and this information is going to be used to do the color sorts during the real-time operation. During training, full 3D color histograms are computed. Pixels of any character marks that are on a face of a training sample are removed from the full 3D histograms. The 3D histograms of all the training samples are averaged to create a full 3D average histogram. This average 3D histogram is the one used to determine the reduced color palette. Once the reduced palette is obtained the reduced normalized prototype histograms are then formed for each class using the reduced palette. The reduced normalized prototype histograms are computed directly from the original full 3D histograms using the established color mapping.
172
During real-time operation, the character marks are removed from the reduced normalized color part face histogram and from the reduced normalized color class prototypes as well. The distance measure is applied to this set of histograms, i.e., the ones with the character mark colors removed. The difference measure used is the l1 -norm, i.e., the sum of the absolute values of the difference between each color element in the two histograms. This difference measure is compared to the threshold values for each class. This threshold defines the maximum distance a histogram can be from a class prototype and still be a member of that class. Thus if the difference measure is less than or equal to the threshold value, then the part is labeled as belonging to the color class. The smaller this threshold, the closer the sorted parts must be to the color class prototype. Once the acceptance/rejection process is completed for each color class, the part face is assigned to either a color class or the out class. A part face is assigned to the out class only if it is too far way from the prototypes of all the acceptable color classes. Once a color class has been assigned to each part face, a better face analysis is performed. The better face algorithm first checks to determine the percentage of each part face that is covered by character marks. If there is a substantial difference in the amount of character marks present, then the better face is the one with lesser amount of character marks. If the amount present is approximately the same, then the better face algorithm considers the color class priorities. The better face algorithm requires that a priority of color classes be specified in advance. The color priority describes which color class is most desirable or valuable. Given the priority values, the better face analysis selects the part face with the highest priority. If the color of each face is of equal priority, then the better face is assigned to that which is closest to the color class prototype histogram of the class to which it has been assigned. The color sorting system consists of the following hardware components: a materials conveyer for moving parts through a data collection area; a pair of Pulnix color line scan cameras positioned to view the top and bottom faces of the part to be imaged; a single switching power supply providing DC power to the tungsten halogen light sources; a special purpose image processing bard - MORRPH5; and a computer for analyzing the data from the top and bottom cameras. The color cameras have infrared filters, so that they respond only to visible light. Each color camera is connected to a controller that govern the data collection speed of the camera and performs A/D conversion of the camera signal. The output of the color camera is digitized so that 8 bits of information is available in each of the red, green, and blue color channels. This digital data is input into the MORRPH which applies a shade correction algorithm to the incoming image data to compensate for the non-linearities in the system 9, removes the background pixels from consideration, and generates the color histogram for the part face as well as the b/w histogram used in finding character marks. The MORRPH boards are also responsible for mapping the 24 bit image into the reduced palette during the real-time time operation. Consistent illumination is critical to the performance of the color sorting system. Hence, the system is designed to monitor illumination levels and control them to be within certain defined tolerances in real-time. Tungsten halogen bulbs are used because their color temperature and light intensity does not vary much across bulb lifetime. A switching power supply is used to provide conditioned and uniform power to the bulbs. The switching power supply can accommodate an input signal that can be used to control the output voltage supplied to the light sources. This input allows the illumination control system to adjust the power supply voltage when lighting intensity falls outside a specified tolerance. The MORRPH ignores color camera data until it senses that a part has entered the field of view at which time it begins processing the image and computing the 3-D color histogram. The MORRPH stops computing color data when it senses that the part has left the field of view. The cameras stay on-line all the time. The MORRPH continuously monitors the lighting, even when a part is not in the field of view. If the lighting changes beyond a defined tolerance, the MORRPH interrupts the image processing computer so that the computer can signal the light source power supply to increase or decrease the voltage supplied to the bulbs until the defined tolerance is regained.
3. OVERVIEW OF THE SYSTEM A set of panel parts which truly represent the color of a particular color class are hand picked (for each color class). A training sample is one face of an edge glued panel part considered to be prototypical of the color class to which the face has been assigned. The boards are so chosen that they have a minimal amount of character marks on them. The training algorithms are used to teach the system to identify the color classes that are to be used during the sorting process. The color sorting training algorithm is performed by analyzing a plurality of training samples which consists of a set of hand picked
173
prototypes for each of the classes which have to be sorted. Once the system is trained, the information is stored on the system and is used during the next phase of operation - real-time scanning, where each panel part is scanned and assigned a particular class and a best face. 3.1 Training Say, there are m classes and n samples in each class. The algorithm for the training operation is as follows: 1. 2. 3. 4. 5. 6. 7. 8. 9. 10.
11. 12.
collect a color image of a training sample apply shading correction to the image average the shade compensated image to obtain a black and white image compute the color and black and white histograms (Hnm = hnm(i, j, k), and Hbw, =hbw(i)), after ignoring the background pixels; apply a character mark detection algorithm to the black/white histogram Hbw to find a threshold value Tcm remove character mark pixels from the three dimensional color histogram, i.e., for all (i, j, k), set hnm(i, j, k) = 0 if (i +j+k) / 3 ≤ Tcm Normalize the three dimensional color histogram to convert it to an estimated probability function Pnm = [pnm(i,j,k)] Add the estimated probability function of the training sample to a running sum of the three dimensional estimated probability functions for the color class, i.e., S = [s(i, j, k)] = S + Pnm Also add Pnm to the running sum Sm = [sm(i, j, k)] for all part classes, i.e., Sm = Sm + Pnm Apply the color mapping algorithm to S after all the samples have been processed. This algorithm effectively reduces the dimensionality of the color measurement vector (Hnm). The output of this algorithm is a color lookup table CMlookup which is a mapping from full 3D color space to a one dimensional space. The color mapping algorithm also outputs a lookup table MSlookup which is a mapping from the black/white line to the reduced color space. Use CMlookup to map Sm into the reduced space to give the prototypes for each class Srm. Also map each of the individual histograms Pnm into the reduced space to give PRmn Calculate the distance (using l1 norm) of each of the PRnm from the corresponding prototype Srm. For each class, select a threshold on the distance Dm, by setting it equal to the maximum distance a histogram is from its prototype. However, the threshold for each class can also be changed at any time during the real-time operation. Thus if on a particular day, more panel parts for a certain class are needed, but the quality is not very important the tolerance for that class can be increased.
3.2 Real-time Operation The real-time operation algorithm is as follows: 1. Collect a color image of sample part faces, and shade compensate this image and also obtain the black/white image by averaging the r,g,b channels of information 2. Compute the black/white histogram Hbw of the part face ignoring any background pixels 3. Compute the reduced measurement vector (reduced Histogram) Ms using the color lookup table CMlookup 4. Apply the character mark algorithm to Hbw to obtain Tcm Remove character mark pixels from Ms and all the prototype histograms Srm, based on the color-black/white lookup table, i.e., for i = 0 to cmlookup(Tcm), let ms(i) = Srm (i) = 0 5. Normalize the reduced measurement vector Ms. 6. Compute the difference measurement Di of Ms from all the reduced normalized color class prototype histograms Srm, 7. If none of the D, fall within the threshold for any class, assign the part to the out class, else assign it to the color class for which Di is the smallest 8. Repeat steps 1 through 9 for the other face of the part. If there is a substantial difference in the amount of character mark present on the two faces pick the face with the lesser amount of character mark as the best face. Else if the faces are assigned to color classes that have different priorities pick the face assigned to the color class with the higher priority as the better face. Else if both part faces are assigned to either the same class or to classes that have the same priority, pick the face which is closer to its assigned class’s prototype as being the better face.
174
4. COLOR QUANTIZATION ALGORITHM Experimentation has shown that a full eight bits from each of the red, green and blue color channels are not needed to perform color sorts of hardwoods. Rather, only 6 bits are needed. The size of the measurement vector can thus be markedly reduced from 16,777,216 (256*256*256) to 262,144 (64*64*64) by simply ignoring the two least significant bits. We shall refer to 64*64*64 3D color space as the full color space. Color variations in hardwood species make up only a small part of the 64*64*64 full color space. A further reduction in the size of the measurement vector can be had by only considering those colors the part faces will possess. Experiments have shown that doing so will reduce the size of the measurement vector from 262,144 to something on the order of 10,000 to 12,000. However, if the desire is to do real-time processing on inexpensive computing systems, i.e., personal computers, a further reduction in the measurement vector size is needed. The goal is to reduce the dimensionality of the measurement vector to the something on the order of 2000 elements. To achieve this reduction a color quantization scheme was developed. But apart from reducing the number of colors needed to give a good visual rendering of a color image, this algorithm has an additional very important requirement by which it is distinguished from other color quantization algorithms. This algorithm must make removing elements in a reduced measurement vector that correspond to colors that might be areas containing character marks a computationally simple task to perform. That is, once the threshold Tcm has been estimated from the black and white histogram, Hbw, the algorithm must provide a convenient means for setting the elements in a reduced measurement vector that correspond to colors whose black and white values are less than Tcm to zero. The measurement vectors involved include the reduced measurement of a part face and the reduced measurement vectors of the color class prototypes. It should be noted that simple linear quantization techniques are inappropriate for this problem. Wood colors encompasses only a small volume of the 3D color spectrum. Thus the entire color space should not be quantized in the same way. Further the most popular algorithm5 that is based on picking n most frequently occurring colors and mapping the rest of the color space into these color is also not suitable for this problem. This follows from the fact that then most frequently occurring colors will tend to cluster around the mean of the 3D full color space histogram. This algorithm will give very bad results where wood grains or other character marks are present since these features in wood typically have colors some distance from the mean of the 3D full color histogram. The quantization technique developed for use in the color sorting system overcomes this problem placed there by improving the efficiency of the vision system. It is based on Heckbert's median cut algorithms. The original median cut algorithm is described in the next section. 4.1 The Median Cut Algorithm The concept behind the median cut algorithm is to have each of the colors in the synthesized colormap represent an equal number of pixels in the original image. This algorithm repeatedly subdivides color space into smaller and smaller rectangular boxes. They start with one box which tightly encloses the colors of all the pixels from the original image. The number of colors in the first box is dependent on the color resolution used. In our case it will be 262,144. Iteration Step: Split Box The box is “shrunk to fit tightly around the nonzero elements it encloses by finding the minimum and maximum coordinates of each of the extreme elements. Next this box is partitioned. To do this, the enclosed points are sorted along the longest dimension of the box and segregated into two halves at the median point. Approximately equal numbers of points will fall on each side of the cutting plane. The above step is recursively applied till Npc boxes are generated, where Npc is the desired number of colors in the reduced color space. Given the nature of the original histogram, and the number of colors needed in our problem, a box containing only one point would never be generated. Hence the split box algorithm would never be forced to handle the situation where it is asked to split a box containing only one element. After the desired number of boxes are generated, the representative for each box is computed by averaging the colors contained in each box. All the colors in the box are assigned to the representative color. This algorithm has some advantages. More colors are formed where the wood has majority of its colors. At the same time the colors away from the main wood cluster are not ignored or merged with the main cluster. But the algorithm is not
175
suitable in its present form for our purpose. As mentioned in the section 3.2, each of the real-time samples have to be mapped in the reduced space. This means that there might be colors in a part face which were not encountered during training. It is worth noting that Heckbert’s median cut algorithm is useful only on the image that was used to form the reduced color palette. It cannot be used in its present form on other color images, images that might contain colors not present in the original color image. A simple approach to get around this problem would probably be, to assign all the colors which were not present in the training sample to one other color. The flaw here is that the algorithm for recognizing character marks gives only the value Tcm in the black/white space. Based on this value the character marks have to be removed from the color space. If we remove all the other values we might be removing much more than we intended to. This problem was solved by modifying the median cut algorithm to generate an efficient mapping which will generate a lookup table from black/white to color space. 4.2 The Color Mapping Algorithm The first step involves allocating the optimum number of other colors in the color map. In order to reduce the number of computations, all the black/white values were assumed to be r + g + b rather than (r + g + b) / 3 during the computation of the color map. Since all the computations are performed in this manner, the results obtained for our purpose is the same as using (r+ g + b) / 3. Thus if n bits are used to represent each of the r, g, b channels the total number of colors formed is n3. Also, the total possible black/white values are 3 (n - 1) + 1, since r, g, b can be anything from 0 to n - l. Thus the number of other colors O = 3 (n - 1) + 1. So, if the total number of colors in the reduced space is required to be N, the number of boxes formed by the median cut algorithm can be at the most N - O. Once the number of other colors has been decided the algorithm is as follows 1. Compute N - O boxes as explained in the median cut algorithm. 2. Go back to the full color space, and look through the entire range of colors. Assign to each color, the number of the box to which it belongs (or the representative color) or assign it to the other value of (r + g + b) and mark it as an other value number in order to distinguish it from a number of a box. 3. Arrange all the colors in ascending order of their black/white values (r + g + b) placing the colors in the boxes before the other values. For a color which has been assigned to a box, the black/white value is the same as the black/white value of the representative color of the box. Re-number all the colors sequentially. Thus every color is now mapped to a unique number. Call this the color map look up table CMlookup 4. Form a color to black/white lookup table This consists of a table where the numbers of the other colors are stored. Each value of an other color has a certain position in CMlookup, and has a corresponding color number associated with it. This value is stored in the MSlookup table for that other color thus providing a simple mapping from the b/w space to color space. In other words, the color value corresponding to the b/w value of k is MSlookup (3 k). We now have a system where the character marks can be removed very efficiently during real-time processing. For every threshold Tcm selected, the color to black/white lookup table MSlookup , gives a color threshold TCcm. Character mark pixels can be removed by setting every pixel below TCcm to zero in the reduced palette histograms. Also step three ensures that all the colors below the threshold are removed. It was also found that the visual rendering of the images are of a very good quality. However one aspect needs to be noted. It is possible that the total number of colors formed are less than N. This happens when some of the other values that are not used. It depends on the number of colors that are present in the histograms after the character mark colors have been removed and the way in which the boxes are formed. If all the colors which of a certain gray level g are present in the normalized histogram, used to form the color palette, all these colors are assigned a specific box, and hence do not fall in the category of other colors. The lookup table MSlookup is then set to the next higher other value.
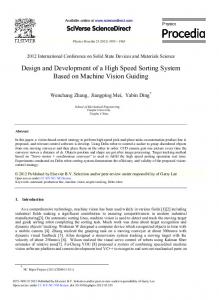
5. RESULTS The accuracy of the color-sorting algorithm was evaluated in an actual panel glue-up operation in a furniture plant. A set of color samples were selected to define six reference color classes for southern red-oak panel parts. The selected samples
176
were chosen by experienced plant personnel with extensive experience in color sorting panel parts. Twenty-five samples for each of the six classes were selected and then used to train the color sorting system. The color classes are listed in Table 1. The color quantization scheme described was used to reduce the number of colors in the histograms. The reduced palette is formed by using only 2000 colors out of which 190 are associated with other colors. The visual image of the reduced palette image was almost indistinguishable from the original. In some cases the number of colors could be reduced to as low as 500, and still obtain a good visual image. The visual image was generated by assigning the colors in one group to the average r, g, b value of all those colors. After training the system, the performance of the part sorting algorithm was tested. This particular glue-up operation graded panels into three categories: 1) clear, 2) acceptable, and 3) unacceptable. Clear panels have approximately the same color across the better face and are the most valuable panels. Acceptable panels have color characteristics that are within acceptable bounds but have some allowable color variation that can be compensated for by using darker finishes. Unacceptable panels have color characteristics that vary widely across their better face and are typically used to create painted panels. This particular manufacturing operation has set a production goal to generate at least 90% clear and acceptable panels form a stack of parts. One stack of parts usually contains 900-1000 pieces that require color sorting. The wood used in this test was southern red-oak. Since southern red-oak is generally considered to have the most color variation of all the commonly used hardwood species, an algorithm that works well on this species should work well on other species of wood as well. Table 2 shows the in plant test results for 17 stacks of parts. The test on these stacks occurred over a two month period. The average rate of clear and acceptable panels for the entire experiment was 91 .3% per stack. The highest and lowest rates achieved were 99.1 and 83.0 percent, respectively. The lowest rates in the study were attributed to mis-calibrated light levels, dust, and parts that had significantly different color variations that were not represented by any of the six color classes used to train the system. Overall, these results indicate that the system is capable of creating high quality edgeglued panels. Figure 1 shows a commercialized version of the color sorting system that was created by Virginia Tech. 6. REFERENCES 1. Brunner, CC., Shaw, B., Butler, D. A., Funck, J. W., “Using color in machine vision systems for wood processing”, Wood and Fiber Science. 22(4); 413-428, 1990. 2. Conners, R. W., C. W. McMillin, “The Utility of Color Information in the Location and Identification of Defects in Surfaced Hardwood Lumber”, Proceedings of the 1st International Conference on Scanning Technology in Sawmilling, October 10-11, San Fransisco, CA, Forest Industries/World Wood, pp. XVIII-1 - XVIII-33, 1985. 3. Conners, R., Ng, C., et. al., “Computer Vision Hardware System for Automating Rough Mills of Furniture Plants”, Proceedings of SPIE, Applications of Artificial Intelligence VII, pp. 777-787, April 1990. 4. Conners, R., Cho, T., et. al., “A Machine Vision System for Automatically Grading Hardwood Lumber”, Industrial Methodology, pp. 317-341, 1992. 5. Drayer, T. H., King, W. E., Tront, J., Conners, R., “A Modular and Reprogrammable Real-time Processing Hardware, MORRPH,” Proceedings of the IEEE Symposium on FPGAs for Custom Computing Machines, Napa Valley, California, April 19-21, 1995. 6. Drayer, T. H., King, W. E., Tront, J., Conners, R., “Using Multiple FPGA Architectures for Real-time Processing of Low level Machine Vision Functions:” Proceedings of IECON’95, 1995. 7. Haney, L, Precetti, C., Gibson, H., Krutz, G., Cassens, D., “Color Matching of Wood with a Real time Machine Vision System,” American Society of Agricultural Engineers, Atlanta, Georgia, December 13-16, 1994. 8. Heckbert, Paul., “Color Image Quantization for Frame Buffer Display”, Computer Graphics, Vol. 16, No. 3, July 1982. 9. Sawchuk, A., “Real time Correction of intensity non-linearities in Imaging System,” IEEE Transactions on Computers, Vol. 26, No 1, pp. 34-39, 1977.
177
10. Yoo S., C. Precitti, and D. Cassens, “Color Machine Vision Used to Establish Color Grading Standards for Hardwood Dimension Parts,” American Society of Agricultural Engineers, Nashville, Tennessee, December 15-18.
Table 1: Color Group Definitions
Table 2: In Plant Color Sorting Results
178
Figure 1: Commercialized Version of the Color Sorting System
179
PROCEEDINGS OF SPIE SPIE-The International Society for Optical Engineering
Machine Vision Applications, Architectures, and Systems Integration VI Susan Snell Solomon Bruce G. Batchelor John W. V. Miller Chairs/Editors
15-16 October 1997 Pittsburgh, Pennsylvania
Sponsored by SPIE—The International Society for Optical Engineering
Endorsed by MVA/SME—Machine Vision Association of the Society of Manufacturing Engineers
Cooperating Organizations NIST—National Institute of Standards and Technology ClMS—Coalition for Intelligent Manufacturing Systems A-ClMS—Academic Coalition for Intelligent Manufacturing Systems
Published by SPIE—The International Society for Optical Engineering
Volume 3205
SPIE is an international technical society dedicated to advancing engineering and scientific applications of optical, photonic, imaging, electronic, and optoelectronic technologies.