This article has been accepted for publication in a future issue of this journal, but has not been fully edited. Content may change prior to final publication. Citation information: DOI 10.1109/ACCESS.2018.2804623, IEEE Access 1
Real-time Probabilistic Data Fusion for Large-scale IoT Applications Adnan Akbar, George Kousiouris, Haris Pervaiz, Juan Sancho, Paula Ta-Shma, Francois Carrez and Klaus Moessner
Abstract—IoT data analytics is underpinning numerous applications, however the task is still challenging predominantly due to heterogeneous IoT data streams, unreliable networks and ever increasing size of the data. In this context, we propose a two layer architecture for analyzing IoT data. The first layer provides a generic interface using a service oriented gateway to ingest data from multiple interfaces and IoT systems, store it in a scalable manner and analyze it in real-time to extract high-level events whereas second layer is responsible for probabilistic fusion of these high-level events. In the second layer, we extend state-ofthe-art event processing using Bayesian networks (BNs) in order to take uncertainty into account while detecting complex events. We implement our proposed solution using open source components optimized for large-scale applications. We demonstrate our solution on real-world use-case in the domain of intelligent transportation system (ITS) where we analysed traffic, weather and social media data streams from Madrid city in order to predict probability of congestion in real-time. The performance of the system is evaluated qualitatively using a web-interface where traffic administrators can provide the feedback about the quality of predictions and quantitatively using F-measure with an accuracy of over 80%. Index Terms—Complex event processing, data analysis, internet of things, real-time systems, intelligent transportation systems
I. I NTRODUCTION Many Internet of Things (IoT) applications enable smart city initiatives all over the world by leveraging ubiquitous connectivity, big data and analytics [1]. The capabilities introduced by these new applications are tremendous such as the ability to remotely monitor, manage and control devices without human intervention, create new insights and actionable information from massive streams of data, which in return is improving standard of human living to a great extent. IoT offerings are transforming cities by improving public health management, enhancing public transportation and creating more efficient and cost effective municipal services [2]. Forward-thinking cities and smart city solution providers recognize that the full potential of IoT cannot be reached by providing disparate smart city point solutions but rather the focus should be an efficient and scalable IoT infrastructure A. Akbar, H. Pervaiz, F. Carrez and K. Moessner are with the Institute for Communication Systems, University of Surrey, UK (email:
[email protected];
[email protected];
[email protected];
[email protected]) George Kousiouris is with the Institute of Communication and Computer Systems (ICCS), National Technical University of Athens, Athens, Greece.(email id:
[email protected]) Juan Sancho is with the ATOS Research and Innovation Labs, Madrid, Spain. (email id:
[email protected]) P. Ta-Shma is with the IBM Research, Haifa, Israel (email:
[email protected])
Data Stream 1
Level 1 Analytics
Derived Event 1
Data Stream 2
Level 1 Analytics
Derived Event 2
Data Stream N
Level 1 Derived Event N Analytics
Level 2 Analytics
Probabilistic Complex Events
Fig. 1. Proposed Approach for Hierarchical Processing of Data Streams
that integrates multiple systems or data streams. Currently, most of the IoT data is under-used by limiting it for specific applications. For example, weather data sensors have been deployed for years but are seldom used for other applications. In the new world of connectivity, weather data has huge potential for a range of applications. It can be correlated with shopping centers sales to determine the effect of weather on shopping patterns or can be combined with traffic conditions to understand how weather can effect traffic. According to McKinsey, 40 percent of the total value that IoT can provide requires different IoT systems to work together [3]. There are many research challenges in this regard from data ingestion and storage at one end to scalable and efficient data analytics at the other end. Different IoT systems were built on different protocols and building a single and global ecosystem for IoT that can work together is certainly a challenging and non-trivial task. In this context, any proposed IoT data analytics solution should fulfil the following requirements; 1)
2)
3) 4)
A proposed solution should be generic enough to ingest data coming from different IoT systems in all types of format. It should have the capability to handle heterogeneous data streams with minimal modification of existing components. An efficient and scalable solution is provided for storing, managing and performing complex analytics on this ever increasing data. It should have the capability to perform real-time analytics for time sensitive applications. Finally, it should be able to take inherent uncertainty of real-world events into account while infusing data from heterogeneous sources and able to make decisions with missing or uncertain data as well.
In this regard, we propose a two layer analytics solution as shown in Figure 1. The first layer of analytics is responsible for ingesting and analysing individual IoT data
2169-3536 (c) 2018 IEEE. Translations and content mining are permitted for academic research only. Personal use is also permitted, but republication/redistribution requires IEEE permission. See http://www.ieee.org/publications_standards/publications/rights/index.html for more information.
This article has been accepted for publication in a future issue of this journal, but has not been fully edited. Content may change prior to final publication. Citation information: DOI 10.1109/ACCESS.2018.2804623, IEEE Access 2
streams generated by different IoT systems in order to extract high-level knowledge which we called derived events in our system. . Whereas the second layer of analytics provides the framework for probabilistic fusion of derived events by extending complex event processing (CEP) with Bayesian networks (BNs) for large-scale IoT applications. The hybrid framework based on CEP and BNs enables to combine derived events probabilistically and extract high-level knowledge in the form of probabilistic complex event. There are several terms used in this paper which have different meanings in different contexts. In order to have a common understanding, these terms are defined here in the context it has been used in this paper. Derived Event: Derived events can be defined as high-level events which are extracted from raw data streams; for example a hot weather derived from temperature data or bad traffic derived from traffic data are the examples of derived events. Probabilistic Complex Events: Probabilistic complex event in our system is referred as the final output which is extracted from the combination of different derived events using Bayesian networks and CEP. Heterogeneous data: Heterogeneous data is defined as the combination of data produced by different type of sensors or devices. A dataset consisting of traffic, weather and social media data is an example of heterogeneous data. Large-scale: Large-scale data or Big data is referred in this paper as the data sets which are voluminous and complex enough that it cannot be analysed using conventional methods. The key contributions of this paper are summarized below: •
•
•
A generic architecture is proposed to ingest data from heterogeneous IoT data streams1 , store it efficiently and provide scalable methods to extract high-level events in near real-time. We propose a novel method for fusion of high-level events in real-time. Our proposed method extends the current CEP technology with BNs using a scalable approach based on open-source tools. The proposed solution is demonstrated using a realworld use-case of intelligent transportation system (ITS) where heterogeneous data streams including traffic, weather and social media data were collected. We developed a complete end-to-end solution for managing traffic efficiently in real-time and evaluated it qualitatively using web-interface and quantitatively using F-measure with an accuracy of over 80%.
The remainder of the paper is organized as follows. Section II highlights the leading research work in the domain of big data analytics and event processing. Section III describes the use-case of ITS which we used to demonstrate the application of our proposed solution. Section IV explains the first layer of analytics of our proposed architecture followed by the description of second layer analytics in Section V. Section VI demonstrates the implementation of our proposed solution 1 In this work, the term ”heterogeneous IoT data streams” is used to refer the data streams coming from multiple and diverse sources such as traffic sensors data from Madrid city council, social media data in the form of twitter and weather data.
for ITS use case alongside its evaluation. Finally we draw conclusion and highlight our future work in Section VII. II. R ELATED W ORK IoT data analytcis has long been divided into two categories of Batch and Event processing [4]. Batch processing is an efficient way of processing high volumes of data where data is collected over a period of time; whereas, event processing involves analyzing data on the fly without storing it and making decisions on per single entry of system. MapReduce [5] is perhaps one of the most renowned batch processing technique which provides the basis of other open source solutions such as Hadoop [6]. MapReduce is a programming model for carrying computations on large amounts of data in a distributed manner. It was originally developed by Google as a generic but proprietary framework for carrying analytics on Google’s own big data. Although MapReduce provides a generic and scalable solution for big data but it is not designed for running iterative machine learning algorithms. A new mapper and reducer is initialized for every MapReduce iteration. Mappers read the same data from the disk again and again; and after processing, the results are stored in the disk in order to carry the next iteration. In such scenarios, disk access is a major bottleneck for iterative algorithms and hence degrading the overall performance [7]. A new cluster computing framework called Spark [8] was developed to overcome the limitations of MapReduce. Spark provides the ability to run computations in the memory which enables it to provide much faster computation times for complex and iterative applications as compared to systems based on traditional MapReduce. Spark is designed to be fast and general purpose for different data analysis applications including iterative algorithms such as machine learning. Recently, a lot of research effort has been put into spark streaming for real-time applications but it is still in its early stages with drawbacks such as the inability to process real-time data on per event basis [9]. In order to address the requirements of real-time data processing for IoT, solutions based on the concept of event driven architecture (EDA) [10] were proposed in recent times which has led to the development of new research area called complex event processing (CEP). CEP includes processing, analyzing and correlating event streams from different data sources using distributed message-based systems to extract high-level or actionable knowledge in near real-time [10].The research on CEP has been multi-disciplinary including active databases [11], business process management [12] and service-based systems [13]. Common goal for all these multidisciplinary research was to provide low delay processing of incoming primitive events in order to analyze streaming data on the run. It has often lead to the design of simplified solutions with no inherent support for handling uncertainty as shown by authors in [14]. The dichotomy of batch processing and event processing has resulted into multiple systems analyzing the same data for various applications. In order to address this issue, Nathan Marz proposed the Lambda architecture [15] which provides a
2169-3536 (c) 2018 IEEE. Translations and content mining are permitted for academic research only. Personal use is also permitted, but republication/redistribution requires IEEE permission. See http://www.ieee.org/publications_standards/publications/rights/index.html for more information.
This article has been accepted for publication in a future issue of this journal, but has not been fully edited. Content may change prior to final publication. Citation information: DOI 10.1109/ACCESS.2018.2804623, IEEE Access 3
scalable and fault tolerant architecture for processing both realtime and historical data in an integrated fashion. In Lambda architecture, the output of batch and speed layer are calculated separately and then the results are served through service layer. Batch layer provides more in-depth analysis but with time delay whereas speed layer provides quick results by using only recent data and compromising on the level of analysis. Both layers work independently of each other. In contrast to it, the Hut architecture was proposed in [16] for IoT data analytics based on the combination of batch processing and event processing where both layers work together to provide the best of both worlds. In addition, the modular approach of their architecture enables both batch processing and event processing to work independently as well. In addition to providing scalable solution for managing and analyzing real-time IoT data streams, handling inherent uncertainty in real-world IoT data streams represents another challenge. The scope of the IoT is global where the aim is to combine data generated by different devices in order to extract higher-level events. In this regard, it is important to provide solutions which can incorporate the uncertainty when fusing events from multiple sources. One of the early work for introducing uncertainty in probabilistic processing of different events was presented in [17] where authors build their system probabilistic event extractor (PEEX) on the top of traditional relational dataBase management system (RDBMS) in order to detect probabilistic events from RFID data. They validated the system on a real-world deployment of radio-frequency identification (RFID) tags for recognizing activities. From an implementation point of view, Peex uses a RDBMS for storing all information received from data sources and confidence score about them. Rules are then translated into SQL queries before running periodically. It introduces a small delay between the real occurrence time of events and the detection time of events. Another initial approach for handling uncertainty in events processing was proposed by authors in [18], where authors discussed two types of inherent uncertainty in CEP systems; uncertainty in data and uncertainty in relation between events. They presented theoretical framework for embedding uncertainty in events and later same authors extended their work in [19] where they proposed a mechanism for constructing probability space that captures the semantics of defined rules and used an abstraction based on Bayesian networks (BNs) to define the probabilities of possible combinations. Bayesian model was automatically created based on defined rules and explicit events. Experiments were performed on simulated data with the assumption of conditional probabilities given for BN. The authors highlighted the difficulties in obtaining conditional probabilities for real-world scenarios which limits the practical implementation of their work. Existing literature on using Bayesian network with CEP assumed that conditional probabilities are given which are vital for constructing BN. According to the best of our knowledge, there is no work in the literature focusing on the computation of conditional probabilities for real-world problems in order to construct BN with CEP. As the complexity of Bayesian inference process increases with an increase in the data size and number of data sources [20] , it is essential to propose a scalable and efficient
solution. III. I LLUSTRATIVE S CENARIO This work demonstrates the functionalities of proposed framework with the help of Intelligent transportation system (ITS) use-case. The use-case of ITS is chosen for several reasons. First, it represents a truly big data problem where different sensors at city-scale are generating large amounts of data. Second, it requires analysing this large data in realtime so that traffic administrators can manage traffic proactively. Third, ITS has an immense impact on the social and economical development of smart cities. The advent of IoT has made many data sources available but currently, most of them are deployed as a stand-alone systems. Such individual systems are limiting the true potential of IoT. If we take the example of ITS, the use of traffic sensors is the most conventional method for traffic administrators to observe and manage traffic. Although, many modern day cities have weather sensors installed and different research efforts as mentioned in [21][22] highlights the correlation of weather on the traffic patterns but it is not being yet exploited at city-level applications. Similarly, in the current era of digital technology social media is one of the quickest way to detect city events effecting traffic patterns. For example, a musical concert or a football match happening in nearby region can lead to unexpected increase in traffic and data analytics carried out on social media data streams can help us to detect it in a timely manner. Although different research efforts demonstrate the potential of using social media data such as twitter to detect city events in real-time as outlined in [23], they are seldomly preferred against the more conventional sensor based methods. In our proposed approach, we emphasis that the social media data and weather data can be exploited in order to predict traffic patterns more accurately and take pro-active measures. We propose to ingest and analyze different data streams in real-time and proposed a probabilistic event processing system for combining multiple high-level events extracted from these data streams. For ITS use case, we ingest traffic data captured by various traffic sensors deployed by Madrid city council2 , social media data in the form of twitter3 and weather data4 to derive highlevel events as summarized in table I. In order to get fair analysis of results, three different locations were selected from city of Madrid as shown in the Figure 2. More details about the methodology and individual data streams can be found in next section. TABLE I I NPUT DATA STREAMS AND DERIVED No. 1 2 3
Input Data Stream Traffic data Twitter data Weather data
EVENTS
Derived Event Traffic Congestion (C) Large Crowd Concentration (LCC) Weather conditions (W)
2 http://informo.munimadrid.es/informo/tmadrid/pm.xml 3 https://developer.twitter.com/ 4 http://api.wunderground.com/
2169-3536 (c) 2018 IEEE. Translations and content mining are permitted for academic research only. Personal use is also permitted, but republication/redistribution requires IEEE permission. See http://www.ieee.org/publications_standards/publications/rights/index.html for more information.
This article has been accepted for publication in a future issue of this journal, but has not been fully edited. Content may change prior to final publication. Citation information: DOI 10.1109/ACCESS.2018.2804623, IEEE Access 4
Fig. 2. Monitoring Locations for Analytics with Bounding Boxes in Madrid City
Derived Events
Real-time analytics using Complex Event Processing
Data acquisition and preprocessing
Push to Message Bus
Batch Analytics
Data Retrieval
Ingest in Cloud storage
Fig. 3. Level 1: Data Collection and Analytics
IV. DATA C OLLECTION AND A NALYTICS The diverse requirements of IoT data processing need event processing (for real-time data) and batch processing (for historical data) to work in parallel. The combination of two technologies poses many challenges. In our earlier work [24], we highlight these challenges and presented an approach to address these challenges. In this paper, we improve our initial approach to make it generic for heterogeneous data streams, extend our experimental evaluation and implement it using open source components which are optimized for large-scale IoT data streams Our proposed solution for data collection and analytics is shown in Figure 3. Node-RED [25] serves as the front end of our solution which is an open source visual tool for wiring IoT events coming from heterogeneous data sources. It provides a service oriented gateway which enables to ingest data coming from different data sources, performs pre-processing and push the data on a Apache Kafka [26] topic in a defined format and schema. It acts as a generic interface for ingesting data
from different IoT systems. In our system, we have used Apache Kafka as the message broker for real-time generated events because of its high throughput messaging capability and durability. One of the unique feature of Kafka which makes provides it an edge on other message brokers is its persistent nature to hold the messages for a given amount of time in the form of a log (ordered set of messages). All the data is stored in the form of objects in OpenStack Swift cloud storage [27]. The OpenStack Object Store project, known as Swift, offers cloud storage software so that data can be stored and retrieved efficiently with a simple API. It is a scalable storage which provides durability, concurrency and availability through the entire data set. It enables to CReate, Update and Delete (CRUD) objects using a simple REST API, and supports scalable and low-cost deployment using clusters of commodity machines. The open-source status of OpenStack was another important factor for choosing it as object storage framework. We configured Spark SQL to retrieve data efficiently from OpenStack swift and analyze using Spark MLlib to extract insight from it. Spark MLlib is a machine learning library for Apache Spark. Apache Spark is a general purpose analytics engine that can process large amounts of data from various data sources. It performs especially well for multi-pass applications which include many machine learning algorithms. Spark SQL is Apache Spark’s module for working with structured data. Real-time analytics are carried out using CEP in our architecture. CEP systems require rules based on different threshold values which have to be set by domain experts. In our proposed solution, historical data analysis using Apache Spark calculates these value automatically and keep updating it according to current context. More details about it can be found in [24]. Now we briefly describe different data streams which we ingested and analyzed using our architecture. A. Traffic Data We briefly describe about using our architecture for ingesting Madrid traffic data in this section. City of Madrid Council have deployed over 3000 traffic sensors in fixed locations in the city monitoring various traffic parameters including average traffic speed, density and occupancy. Traffic administrators utilize the data from these sensors to understand the traffic conditions and take reactive measures in order to ensure smooth traffic flow. Aggregated data is published as an IoT service using a RESTful API5 and data is updated every 5 minutes. We ingest this data in our system using Node-Red flows, add meta data such as time and location, push data to kafka and store in the form of objects in openstack swift cloud storage. The published data on kafka has the following schema, where intensidad denotes traffic intensity, velocidad denotes traffic speed, ts denotes the timestamp in epoch format and tf denotes the time of day. {"namespace": "traffic_data", "type": "record", "name": "MadridTrafficFlow", "fields": [ 5 http://informo.munimadrid.es/informo/tmadrid/pm.xml
2169-3536 (c) 2018 IEEE. Translations and content mining are permitted for academic research only. Personal use is also permitted, but republication/redistribution requires IEEE permission. See http://www.ieee.org/publications_standards/publications/rights/index.html for more information.
This article has been accepted for publication in a future issue of this journal, but has not been fully edited. Content may change prior to final publication. Citation information: DOI 10.1109/ACCESS.2018.2804623, IEEE Access 5
{"name": {"name": {"name": {"name": {"name": {"name": {"name": {"name": {"name": {"name":
"codigo", "type": "string"}, existing sophisticated methods for analyzing social media data, "ocupacion", "type": "int"}, we have followed a rather simple yet effective approach. The "carga", "type": "int"}, intuition behind our approach is that the number of tweets "nivelServicio", "type": "int"}, coming from a specific region is the indicative of number of "velocidad", "type": ["null","int"]}, people gathered in a region. For example, if we are extracting "intensidad", "type": ["null","int"]}, "error", "type": "string"}, tweets from a region including a football stadium, the number "subarea", "type": ["null","int"]},of tweets will be far higher on a match day as compared to "ts", "type": "long"}, other days indicating a large crowd concentration. Similarly, "tf", "type": "string"}
] }
In order to detect complex events using CEP, we require threshold values for different traffic features. These threshold values are calculated automatically by carrying analytics on historical data. The data is collected for more than two months and is analyzed using Spark SQL and Spark MLlib to learn traffic patterns and model the expected traffic behavior for different contexts such as morning, evening, weekdays and weekends. Then this information is used to automatically generate threshold values for CEP rules. As the traffic becomes bad or approaches to congestion, CEP generates complex event with a warning message. An example rule for CEP is shown below where threshold values are generated automatically by exploiting pattern learning algorithms [24] using Spark MLlib. Complex events detected are stored in the cloud storage with current intensity and velocity readings as shown in the Figure 4 where ‘1’ indicates a congestion event. I n i t i a t e d A t ( T r a f f i c C o n g e s t i o n ( locID ) , t ) HappensAt ( a g g r ( l o c I D , a v g i n t , a v g s p d ) , t ) 0 < a v g i n t < t h r e s h o l d ( i n t e n s i t y ) and 0 < avg spd < t h r e s h o l d ( speed )
Fig. 4. Traffic events table layout in cloud storage
B. Twitter Data Social networks have been identified as a rich source of information due to their extended uptake, through which significant inference may be achieved with relation to circumstances affecting the societal status. In this context, we have used Twitter data as another source of information that can aid in the prediction of congestion. Exploring social media analytics is beyond the scope of current work, which is primarily the construction of an integrated system with heterogeneous data streams and probabilistic inference framework. In contrast to
there will be more tweets coming from a region including city center or shopping malls during Christmas holidays as compared to a normal weekday indicating a crowd concentration. One reason for selecting twitter data is its easily available open API [28] through which it can be ingested into our system and dynamically alert about surges in population concentration in a given area, when compared to the normal tweeting activity of the past. Increased Twitter activity in an area can be considered as an indirect indication about abnormal activity, especially when this relates to highways and not residential areas that could include an increased number of false positives (e.g. due to popular Twitter trends in the specific timeslot). In order to focus on a specific area (a bounding box around the location), filtering of the acquired messages from Twitter needs to be performed. This is done upon registration, in which we define the geographical bounding box from where we need the relevant tweets to be forwarded. This is taken under consideration by the respective Twitter API and only the tweets that have enabled geolocation and fall within this box are forwarded (in our case the bounding boxes for every location is highlighted in Figure 2). It is necessary to stress that not all of the tweets are forwarded, but only a percentage of them, according to the Twitter API documentation [28]. Following tweets acquisition, ingestion takes place as follows: 1) Initial filtering is performed in order to reduce each tweet size, by discarding fields of no interest and thus reducing needed storage space 2) Enrichment with sentiment analysis information based on the tweet content is performed. This information is not currently used but it was considered a promising feature for future work. 3) Definition of an Apache Avro [29] schema necessary for describing how the data fields information will be stored in the Cloud storage and which fields will be maintained, which also affects the Node-RED manipulation 4) Adaptation of the incoming tweets to the Avro format and JSON structure of the output to the Message Bus (Apache Kafka), from which it is collected by Openstack Swift The published data on Kafka has the following schema; {"namespace": "cosmos", "type": "record", "name": "TwitterData", "fields": [ {"name": "ts", "type": "long"}, {"name": "text", "type": "string"}, {"name": "lon", "type": "double"}, {"name": "lat", "type": "double"}, {"name": "twitter_id", "type": "string"}, {"name": "sentiment", "type": "double"},
2169-3536 (c) 2018 IEEE. Translations and content mining are permitted for academic research only. Personal use is also permitted, but republication/redistribution requires IEEE permission. See http://www.ieee.org/publications_standards/publications/rights/index.html for more information.
This article has been accepted for publication in a future issue of this journal, but has not been fully edited. Content may change prior to final publication. Citation information: DOI 10.1109/ACCESS.2018.2804623, IEEE Access 6
] }
Once the ingestion flow has been established and sufficient data have been collected, they can be included in the run-time operation of the LCC event identification. Historical data is analyzed using Spark SQL and Spark MLlib to learn about expected number of tweets for given location and time and CEP is used to calculate the running sum of number of tweets. Depending on the number of tweets, it generates different levels of Large Crowd Concentration (LCC) event. After detecting LCC event, it is stored in the cloud storage along with twitter counts and time stamp. We have used three levels of LCC where ’0’ indicates no LCC or normal conditions, ’1’ indicates first level of LCC and ’2’ indicates second level of LCC event indicating a Large crowd in the region as shown in Figure 5. We validated our approach by performing several experiments around Santiago Bernabeu stadium in Madrid in order to detect the LCC for football matches and validate our proposed solution. Further details about the validation can be found in [30].
Fig. 6. Weather events table layout in object storage
layer of analytics. In state-of-the-art CEP systems, events are correlated using absolute rules where complex event detected is either true or false. Even if a single condition or rule is violated, complex event will not be generated. It is a major drawback given the random and probabilistic nature of real-world events. In contrast to conventional CEP systems, we propose a probabilistic CEP approach using BNs where complex events are detected in terms of probabilities. And even if any condition is not fulfilled, it will generate the complex event with reduced probability. In our system, BNs were trained using large historical data and integrated with CEP rules. A. Fundamentals of Bayesian Network
Fig. 5. LCC events table layout in object storage
C. Weather Data There are number of open source weather services available for retrieving real-time weather data. For our work, we used open API provided by Weather Underground6 to access data from the nearest weather station to our selected locations. Combined with a Node-RED flow, we parsed the received data in a JSON file and filter out the needed parameters according to our defined schema. We assigned weather data three different levels (0,1, 2) depending on the conditions where ‘0’ indicates a clear,sunny or cloudy weather, ‘1’ indicates light rain or light shower and ‘2’ represents heavy rain or stormy weather. An instance of weather table stored in cloud storage after processing raw data is shown in Figure 6. All the Node-RED flows used in this work are made available at [31]. V. L EVEL 2: P ROBABILISTIC E VENT P ROCESSING After extracting derived events from individual data streams, they are combine to extract high-level knowledge using second 6 http://api.wunderground.com/
A Bayesian Network (BN) is a graphical structure that allows to represent and reason the inherent uncertainty in real world problems. The nodes in a BN represent a set of random variables, X = X1 , ..Xi , ...Xn , from a specific domain. A set of directed arcs connect pairs of nodes, Xi → Xj, representing the direct dependencies between variables. The strength of the relationship between different random variables is quantified by conditional probability distributions associated with each node. The only constraint on the arcs allowed in a BN is that there must not be any directed cycles i.e. you cannot return to a node simply by following directed arcs. Such networks are called directed acyclic graphs (DAGS). The relationship between different nodes is specified using a conditional probability distribution for every node. In case of discrete variables, it takes the form of a conditional probability table (CPT). BNs model the quantitative strength of the connections between variables which allows it to update probabilistic beliefs about them automatically as new data arrive. Markovian assumption is an important property when modeling with Bayesian networks. In order to understand Markovian assumption, consider the following notation; • P arents(X) are the parents of X in DAG G, that is, the set of variables Y with an edge from Y to X. • Descendants(X) are the descendants of X in DAG G, that is, the set of variables Y with a directed path from X to Y. • N on − Descendants(X) are all variables in DAG G other than X, Parents (X), and Descendants (X).
2169-3536 (c) 2018 IEEE. Translations and content mining are permitted for academic research only. Personal use is also permitted, but republication/redistribution requires IEEE permission. See http://www.ieee.org/publications_standards/publications/rights/index.html for more information.
This article has been accepted for publication in a future issue of this journal, but has not been fully edited. Content may change prior to final publication. Citation information: DOI 10.1109/ACCESS.2018.2804623, IEEE Access 7
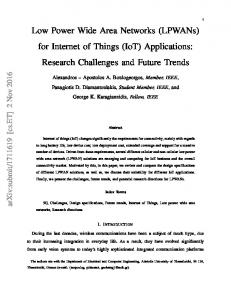
𝑊 0 - Clear or cloudy weather 𝑊 1 - Light rain or light shower 𝑊 2 - Heavy rain, shower or storm
𝐸 0 - No LCC 𝐸1- Level 1 LCC 𝐸 2 - Level 2 LCC LCC Event
Weather 𝑇 0- Morning 𝑇 1- Afternoon 𝑇 2- Evening 𝑇 3- Night
𝐷 0 - Weekday 𝐷1- Weekend Time
Congestion
Day
𝐶 0 - Normal Traffic 𝐶1 - Congestion Fig. 7. Proposed Bayesian Network
For the given notation, Markov property can be represented as: • I(X, P arents(X), non − descendants(X))
(1)
for all variables X in DAG G. That is, every variable is conditionally independent of its non-descendants given its parents. The probabilistic semantics of BNs can be interpreted using joint probability distribution. For a BN containing the n nodes, X1 → Xn, taken in that order, a particular value in the joint distribution is represented by P (X1 = x1, X2 = x2, ..., Xn = xn), or more compactly, P (x1, x2, ..., xn). The chain rule of probability theory allows us to factorize joint probabilities so: P (x1 , x2 , ..., xn ) = P (x1 ) × P (x2 |x1 )..., ×P (xn |x1 , ..., xn−1 ) Y = P (xi|x1, ..., xi−1 )
(2)
•
•
between variables can be exploited to infer missing information. The model has both a causal and probabilistic semantics which makes it as an ideal representation for combining prior knowledge (which often comes in causal form) and data. Anyone having performed a real-world analysis knows the importance of prior or domain knowledge, especially when data is scarce or expensive. A BN can be used to learn causal relationships, and hence can be used to gain understanding about a problem domain and to predict the consequences of different combination of events. Finally, statistical methods in conjunction with BNs provides a rather generic and efficient solution avoiding the over-fit ting of data. For BNs, there is no need to hold some data for testing, instead all available data can be used for training.
i
Applying Markovian assumption on BN structure implies that the value of a particular node is conditional only on the values of its parent nodes, this reduces to; Y P (x1, x2, ..., xn) = P (xi |P arents(Xi )) (3) i
1) Importance of Bayesian Network: Graphical models like BNs have several advantages when they are used in conjunction with statistical methods for data analysis which are summarized below; • Bayesian model encodes dependencies among all variables which enables it to handle situations where some data entries are missing. The dependencies
B. Bayesian Networks for Intelligent Transportation System In particular, to construct a Bayesian network for a given set of variables, we first identify cause and effect variables and then imply arcs from cause variables to their immediate effects. Traffic Congestion (C), Weather (W), Large Crowd Concentration Event (E), Time (T) and Day (D) are the set of variables in our system and we are interested to find the causal effect of these variables on a traffic Congestion (C). Assuming conditional independence between weather, LCC, time and and day, we come up with a simplified Bayesian structure as shown in the Figure 7. 1) Probabilistic Inference: Once a Bayesian network is constructed, we need to estimate prior and conditional prob-
2169-3536 (c) 2018 IEEE. Translations and content mining are permitted for academic research only. Personal use is also permitted, but republication/redistribution requires IEEE permission. See http://www.ieee.org/publications_standards/publications/rights/index.html for more information.
This article has been accepted for publication in a future issue of this journal, but has not been fully edited. Content may change prior to final publication. Citation information: DOI 10.1109/ACCESS.2018.2804623, IEEE Access 8
abilities from the historical data. Our final goal is to get the probability of congestion given observations of the other variables. It is not stored in the model and needs to be estimated at run-time. The procedure of estimating the probability of interest for given model is known as probabilistic inference. As BN for X variables determines a joint probability distribution for all X variables, we can in principle use this model to calculate any probability of interest using Bayes’ theorem. 2) Data fusion and analytics: Different data sources have different sampling time and every data reading has a different time stamp. Traffic data is updated every 5 minutes, weather data is refreshed every 30 minutes and twitter data generates several tweets every minute. In order to combine all data sources, we need to bring all data on a common time scale. We performed interpolation to fill missing values and aggregated available data for every 30 minutes and combine data from tables shown in Figure 4, 5 and 6. The instance of resulting table with all data is shown in the Figure 9. Once, all the data with individual derived events are combined in a single table, the calculation of conditional probabilities is a simple task using Spark SQL. As an example, probability of congestion when weather is good (represented by 0 in data), and no LCC event (represented by 0 in data) and afternoon time on a weekday can be calculated as below; s q l C o n t e x t . s q l ( ” SELECT * FROM t o t a l t a b l e WHERE c o n g e s t i o n = ’ 0 ’ AND L C C l e v e l = ’ 0 ’ AND day = ’ 0 ’ AND t f >= ’ 0 8 : 0 0 : 0 0 ’ AND t f