Mark H. Hammond. NOVA Research, Inc., Alexandria, Virginia. Daniel T. Gottuk, Mark T. Wright, Jennifer T. Wong. Hughes Associates, Inc., Baltimore, MD.
Susan L. Rose-Pehrsson, Sean J. Hart, Thomas T. Street, Patricia A. Tatem, and Frederick W. Williams Naval Research Laboratory, Chemistry Division, Washington DC Mark H. Hammond NOVA Research, Inc., Alexandria, Virginia Daniel T. Gottuk, Mark T. Wright, Jennifer T. Wong Hughes Associates, Inc., Baltimore, MD
Real-Time Probabilistic Neural Network Performance and Optimization for Fire Detection and Nuisance Alarm Rejection
The U.S. Navy program, Damage Control-Automation for Reduced Manning is focused on enhancing automation of shipboard fire and damage control systems. A key element to this objective is the improvement of current fire detection systems. As in many applications, it is desirable to increase detection sensitivity, decrease the detection time and increase the reliability of the detection system through improved nuisance alarm immunity.
The use of multi-criteria based detection technology offers the most
promising means to achieve both improved sensitivity to real fires and reduced susceptibility to nuisance alarm sources. An early warning fire detection system is being developed by properly processing the output from sensors that measure different parameters of a developing fire or from analyzing multiple aspects of a given sensor output (e.g., rate of change as well as absolute value). The classification performance and speed of the probabilistic neural network deployed in real-time during recent field tests have been evaluated aboard the ex-USS SHADWELL, the Advanced Damage Control fire research platform of the Naval Research Laboratory. The real-time performance is documented, and, as a result of optimization efforts, improvements in performance have been recognized. Early fire detection, while maintaining nuisance source immunity, has been demonstrated. A detailed examination of the PNN during
fire testing has been undertaken. Using real data and simulated data, a variety of scenarios (taken from recent field experiences) have been used or recreated for the purpose of understanding potential failure modes of the PNN in this application. 1. Introduction The U.S. Navy program, Damage Control-Automation for Reduced Manning (DCARM) is focused on enhancing automation of shipboard fire and damage control systems.
Improvement of current fire detection systems is a key element of the
program. Increased detection sensitivity, decreased detection time and increased reliability of the detection system through improved nuisance alarm immunity are desired. The use of multi-criteria based detection technology [1] offers the most promising means to achieve both improved sensitivity to real fires and reduced susceptibility to nuisance alarm sources. A multi-year effort to develop an early warning fire detection system is currently underway. The system being developed uses the output from sensors that measure different parameters of a developing fire and a neural network for fire recognition. Two test series were conducted on the ex-USS SHADWELL [2] to evaluate and optimize candidate prototypes of the early warning fire detection system (EWFD). A third test series was used to validate the optimized system. Improved fire recognition and low false alarm rates were observed using data from fullscale laboratory tests [3,4,5]. Several different sensor combinations were identified for use with a probabilistic neural network (PNN).
Full-scale shipboard tests were
conducted on the ex-USS SHADWELL to further develop detection algorithms and to expand the fire/nuisance source database [6,7]. Using these two data sets, two candidate suites of sensors were identified for prototype development. Test Series 1 tested the real-time responses of the prototypes [8,9]. Two months later, under different environmental conditions, the optimized prototypes were tested with more fire and nuisance sources in Test Series 2 [10]. Test Series 1 and 2 were used to optimize the prototype, which was then evaluated in Test Series 3 [11,12].
Two data sets (laboratory and shipboard tests) served as the basis for a comprehensive PNN training data set used for the subsequent real-time applications. The classification of fire and nuisance events and the alarm speed were used to determine the performance of the multi-criteria fire detection system in the test series. The EWFD system with the PNN developed for real-time detection demonstrated improved classification performance as well as faster response times to fires compared to commercial smoke detectors. Some problems with the real-time implementation of the algorithm were identified and have been addressed.
Using a variety of methods for speed and
classification improvements, the PNN has been extensively tested and modified accordingly. As a result of these optimization efforts, significant improvements in performance have been recognized. The best classification performance observed for Test Series 1 and 2, while maintaining a fast detection speed, was observed with a sensor array consisting of ionization (ION), photoelectric (Photo), carbon monoxide (CO), and carbon dioxide (CO2) [11]. This paper describes the results of Test Series 3 for the ION, Photo, CO, and CO2 sensors using magnitude and slope information, and background subtraction. A fire classification probability of 0.75 was used in Test Series 1 and 2 as the alarm threshold. The use of higher probability alarm thresholds has resulted in improved nuisance source rejection while still maintaining fast fire detection. The best probability cut off to maximize detection and minimize false alarms was investigated. Finally, detailed examination of potential PNN failures during fire testing has been undertaken. Using real data and simulated data, several scenarios have been used or recreated for the purpose of understanding the potential failure modes of the PNN in this application. 2. Experimental The tests consisted of different fire scenarios and several different nuisance sources. In general, incipient size sources were used to challenge the detection limits of the commercial smoke detectors and to establish the minimum detection capability of new multi-criteria detection algorithms. The shipboard tests presented in this study were conducted on the second deck of the ex-USS SHADWELL in a space with a volume of approximately 144 m3. The sensors were mounted on the ceiling, 2.9 m above the deck.
All of the sensors operated via gas diffusion to the unit. The fires were typically located about 4.3 m from the sensors and the nuisance sources were 1.5 m from the sensors. The heights of each source above the floor were selected to be representative of actual shipboard conditions. All sensors were hard-wired to a National Instruments/LabVIEW data acquisition system that was used to acquire data and execute the PNN alarm algorithm in real time, save the data, and display the data. During tests, the data acquisition/processing system was synchronized in time with the commercial-off-the-shelf (COTS) Simplex smoke detection system currently installed on the ship. The shipboard system consisted of ionization detectors (Model 4098-9717) and photoelectric detectors (Model 4098-9714) monitored with a single alarm panel (Model 4020). The alarm sensitivity of these detectors was 4.2% obs/m for ionization and 8% obs/m for photoelectric. A more detailed explanation of the data acquisition system can be found in other reports [8,10,12]. The PNN analysis of sensor data included pre-processing, pattern calculation and scaling. The vector of input sensor responses, one number for each sensor in the array, comprises the set of data that is passed to the algorithm for pre-processing and PNN analysis during real-time deployment. All sensor measurements were background subtracted (i.e., values were evaluated as a change from an ambient baseline value). Data were collected every 2 seconds. The pattern magnitudes and slopes were computed and then autoscaled (mean zero and unit variance) using the means and standard deviations derived from the training set.
The resulting scaled pattern was then
submitted to the PNN algorithm for event classification (fire and nuisance) and determination of the probability of a fire event. The training set for the PNN consisted of 140 background subtracted response patterns generated in previous laboratory and shipboard tests. The training set data were compared at discrete times corresponding to the 1.63% obs/m alarm setting of a commercial photoelectric detector. This method of comparing signatures at particular alarm times provides a means of identifying parameters with respect to a practical benchmark. However, it also has the drawback of
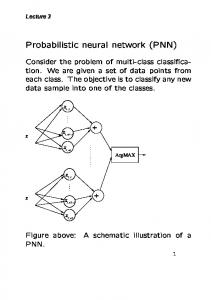
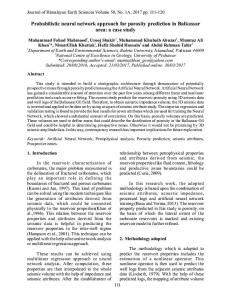
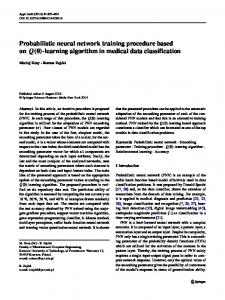
identifying signatures at a singular point in time, therefore, potentially missing key signature patterns. Algorithm development and optimization was executed on a PC using routines written in MATLAB, version 5.2 (Mathworks, Inc., Natick, MA). Many of the routines were implemented using the PLS_toolbox, version 2.0c (Eigenvector Technologies, Inc., Manson, WA). The classifier used in this study is a Probabilistic Neural Network (PNN) [13] that was developed at the Naval Research Laboratory for chemical sensor arrays [14]. Originally introduced to the neural network literature by Donald Specht in the 1980’s, the PNN is a nonlinear, nonparametric classification algorithm that has been described as the neural network implementation of kernel discriminant analysis [15,16,17]. The PNN operates by defining a probability density function (PDF) for each data class based on the training set data and the optimized kernel width parameter. The PDF defines the boundaries for each data class. For classifying new events, the PDF is used to estimate the probability that the new pattern belongs to each data class. The output probability can be used as a level of confidence in the classification decision, which can serve as a guide to reducing nuisance alarms. An improved PNN algorithm for chemical sensor array classification has also been developed at the NRL for use in real-time sensor systems [18]. 3. Results and Discussion Test Series 3 was used to test a revised prototype that utilized four sensors: ION, Photo, CO, and CO2 as described in Table 1. Thirty-nine tests were conducted that consisted of fire/nuisance sources used during previous tests as well as several new sources. The detection rate of the PNN verses the false alarm rate is shown in Figure 1 for each probability cut off. If the probability of fire is required to reach 100%, then the false alarm rate is zero, but only 60% of the incipient fires generated in this test series are detected. As the probability cut off is reduced, the false alarm rate increases. At a probability cut off of 85%, 78% of the fires are detected and less than 20% of the nuisance sources are improperly classified. Both replicates of cutting steel with a torch were the only nuisance sources incorrectly classified. An alarm threshold of 85%
provides a fire detection rate similar to both the COTS Photo and the combination of Photo and ION. When the COTS Photo and ION sensors are combined with an “OR” logic statement, the fire detection rate is better than either sensor used individually, however, the false alarm rate is also increased. The multi-criteria approach used here with the PNN classifier has a detection rate similar to the Photo+ION combination and a lower false alarm rate. Table 1. Details of Prototype Fire Detectors. No. Component 1 Ionization smoke detector 2 Photoelectric smoke detector Carbon monoxide (CO) 3 0-100 ppm Carbon dioxide (CO2) 6 0-5000 ppm
Instrument Model No. 1251 with base no. B501 2251 with base no. B501
Manufacturer System Sensor System Sensor
TB7F-1A
City Technology
2001V (EWFD1 and 2 only), Telaire/Engelhard 8002W Ventostat
The classification performance of the three EWFD prototypes is presented in Table 2. Each detector is presented as the number of tests correctly classified with respect to each of five categories; Overall, Total Fires, Flaming Fires, Smoldering Fires, and Nuisances. It should be noted that the overall and fire classifications are not 100 % for any detector because some of the fires were of such small size and duration (e.g., smoldering wire samples) that the detectors did not alarm. The EWFD system performed better than the COTS smoke detectors. The EWFD correctly classified more events than the COTS detectors in both flaming fires and nuisance source rejection. The EWFD performance to smoldering fires was not as good as the COTS Photo responses.
The Photo+ION combination provides equivalent fire detection to the
EWFD, but the nuisance alarm rate is poor. These results indicate that the PNN algorithm with the CO and CO2 signatures provide improved detection performance than can be achieved by co-locating ionization and photoelectric smoke detectors. The EWFD system is faster than the COTS detectors for smoldering fires and is similar to the COTS ION for flaming fires.
1 0.9 0.8
Detection Rate
0.7 0.6 0.5 0.4 0.3 EWFD 85% Photo ION Photo+ION
0.2 0.1 0
0
0.1
0.2
0.3
0.4
0.5
0.6
0.7
0.8
0.9
1
False Alarm Rate Figure 1. A Receiver Operator Curve (ROC Plot) showing the detection rate and false alarm rate for each PNN probability cut off. The 85% cut off level for the EWFD (*) is compared to the detection rate and false alarm rate of the COTS Photo (∆), COTS ION ( ), and the combination Photo + ION (✩).
Table 2. Summary of Classification Performance of Test Series 3.
EWFD 1 EWFD 3 EWFD 5 COTS Ion COTS Photo Photo+ION
Overall Total, % Correct (39) 79.5(31) 79.5 (31) 76.9 (30) 56.4 (22) 69.2 (27) 61.5(24)
Total Fires, % Correct (27) 77.8(21) 77.8 (21) 74.1 (20) 66.7 (18) 74.1 (20) 77.8 (21)
Flaming Fires, % Correct (13) 100.0 (13) 100.0 (13) 100.0 (13) 92.3 (12) 84.6 (11) 92.3 (12)
Smoldering Fires, % Correct (14) 57.1(8) 57.1 (8) 50.0 (7) 42.9 (6) 64.3 (9) 64.3 (9)
Nuisance Sources, % Correct (12) 83.3(10) 83.3 (10) 83.3 (10) 33.3 (4) 58.3 (7) 25.0(3)
4. Failure Mode Simulations A variety of simulations and tests were performed to evaluate several scenarios that could occur with a multi-sensor system and to elucidate PNN function, performance, and failure. Scenarios include increased noise on 1, 2, 3 channels while maintaining the integrity of the remaining channels, increasing the noise on all channels simultaneously, single sensor dropout (sensor value = 0), and single sensor erroneous values (values set to high or low values). The data used for testing were a heptane fire experiment performed in Test Series 1. 4.1 Noise simulations The effect of noise added to the data was investigated by adding noise to each sensor alone, while maintaining the integrity of the others. The noise was added to the background data (data prior to ignition) in 13 steps from typical S/N levels to a S/N level of 3. The test simulates a false alarm when exposed to typical background air. Additionally, noise was added to two, three, and finally all sensor channels to probe the ability of the PNN to function under extremely adverse conditions. If the S/N is reduced to low levels, between approximately 3 and 5, then the PNN false alarms. When the PNN predicts a fire at any point before the actual ignition time, this is considered to be a failure state, which cannot be tolerated. To understand the effects of noise in the sensor arrays, the number of alarms before ignition as a function of S/N was investigated for noise added to 1, 2, 3, and finally all
channels simultaneously. In general, the number of false alarms in background air increases as noise is added to more sensors simultaneously. The point immediately before the PNN fails is more important in terms of predicting and preventing future failures in the field. The pre-failure point is defined as the S/N level immediately before the PNN first fails. A summary of the pre-failure points is given in Table 3, in terms of the raw input data S/N. The pre-failure noise level is shown in bold. The S/N level for ION can drop to 4.8 if all the other sensors have typical noise levels. However, a S/N level below 5.8 will produce a false alarm if the S/N decreases on the CO2 to 6.6. These pre-failure points may be used to estimate the raw data S/N levels that are tolerable in each sensor when one or more sensors may have excessive noise present. 4.2 Extreme Sensor Failure Other sensor events that could occur in the field include sensor dropout (zero reading) and erroneous sensor values. There could be a case in the field where activities in the compartment cause temporary sensor responses of this kind, such as the use of hand radios for communication. Table 4 shows the results for each of these conditions on classification results. For sensor dropouts, the PNN will classify all but the most extreme cases. One or two sensors failing did not cause the EWFD system to fail. When sensor values are above the typical maximum values (constant high value), the PNN almost always produces an erroneous alarm condition. The erroneously high values used for each sensor were 120, 5.5, 50, and 2500 for Ion, Photo, CO, and CO2, respectively. When sensor values are below typical baseline values, the PNN results were variable. The below baseline values used for each sensor were -60, -2.5, -30, and 1000 for ION, Photo, CO, and CO2, respectively. The PNN produced an alarm for half of the various situations tested. The response times under these conditions have not been investigated.
Table 3. Summary of PNN Pre-Failure Points Due to Added Noise. Sensors Ion S / N 1 channel noise addition: Ion 4.8
Photo S / N
CO S / N
CO2 S / N
14.4
98.3
441.0
Photo CO
175.0 175.0
4.2 14.4
98.3 3.1
441.0 441.0
CO2 2 channel noise addition:
175.0
14.4
98.3
5.1
Ion and CO2 Ion and CO Ion and Photo Photo and CO
5.8 17.8 17.3 175.0
14.4 14.4 4.0 6.0
98.3 5.2 98.3 7.4
6.6 441.0 441.0 441.0
Photo and CO2
175.0
4.3
98.3
68.8
CO and CO2 3 channel noise addition: Ion, Photo, and CO
175.0
14.4
4.7
71.4
47.5
5.4
5.7
441.0
Ion, Photo, and CO2
21.5
4.3
98.3
233.5
Photo, CO, and CO2
175.0
3.9
3.4
258.3
Ion, CO, and CO2 4 channel noise addition:
11.3
14.4
3.7
52.2
Ion, Photo, CO, CO2
44.7
5.7
5.3
406.4
Table 4. Summary of PNN alarm states for sensor dropout (zero-reading), sensor responses erroneously high and low. Sensor(s) Ion Photo CO CO2 Ion, Photo Ion, CO Ion, CO2 Photo, CO Photo, CO2 CO, CO2 Ion, Photo, CO Ion, Photo, CO2 Ion, CO, CO2 Photo, CO, CO2
Dropout Missed Alarm No No No No No Yes No No No No No Yes No Yes
Sensor High False Alarm No Yes Yes Yes Yes Yes Yes Yes Yes No Yes Yes No Yes
Sensor Low Missed Alarm Yes Yes No No Yes No No Yes Yes No Yes Yes No Yes
5. Conclusions The results of these studies have demonstrated the advantage of a PNN classifier with the multi-sensor, multi-criteria approach for fire detection. The current alarm algorithm resulted in better overall performance than the commercial smoke detectors by providing both improved nuisance source immunity with generally equivalent or faster response times. Additional studies were performed that examined the effects of noise and erroneous sensor responses (sensor dropout, and high or low sensor values). The results of these experiments indicate that the PNN is robust to sensor noise and dropout. Unacceptable performance was not reached until the S/N level on a single sensor was reduced to 3-5. Noise introduced in multiple sensors produced mixed results with higher S/N levels producing poor PNN performance. The PNN classification results were not effected by single sensor dropout (flat-line zero). The remaining sensors and the PNN are capable of detecting the fires in the absence of one sensor. These effects are entirely acceptable for a continuous early warning fire detection system until such time that the problem can be corrected.
6. Acknowledgements The Office of Naval Research under the U.S. Navy Damage Control-Automation supported this work for Reduced Manning Program, PE-603608N. 7. References 1. Gottuk DT, Williams FW. Multi-Criteria Fire Detection: A Review of the State-ofthe-Art. NRL Ltr Rpt Ser 6180/0472, September 10, 1998. 2. Carhart HW, Toomey TA, Williams FW. The ex-USS SHADWELL Full-Scale Fire Research and Test Ship. NRL Memorandum Report 6074, October 1987, Reissue, September 1992. 3. Gottuk DT, Hill SA, Schemel CF, Strehlen BD, Shaffer RE, Rose-Pehrsson SL, Tatem PA, Williams FW. Identification of Fire Signatures for Shipboard Multi-criteria Fire Detection Systems. NRL Memorandum Report, NRL/MR/6180-99-8386, June 18, 1999. 4. Shaffer RE, Rose-Pehrsson SL, Barry C, Gottuk DT, Williams FW. Development of an Early Warning Multi-Criteria Fire Detection System: Analysis of Transient Fire Signatures Using a Probabilistic Neural Network. NRL Memorandum Report, NRL/MR/6110-00-8429, February 16, 2000. 5. Rose-Pehrsson SL, Shaffer RE, Hart SJ, Williams FW, Gottuk DT, Hill SA, Strehlen BD. Multi-Criteria Fire Detection Systems using a Probabilistic Neural Network. Sensors and Actuators, B, 2000; 69(3): 325-335. 6. Wong JT, Gottuk DT, Shaffer RE, Rose-Pehrsson SL, Hart SJ, Tatem PA, Williams FW. Results of Multi-Criteria Fire Detection System Tests. NRL Memorandum Report, NRL/MR/6180-00-8452, May 22, 2000. 7. Rose-Pehrsson SL, Hart SJ, Shaffer RE, Wong JT, Gottuk JT, Tatem PA, Williams FW. Analysis of Multi-Criteria Fire Detection Systems Results for Test Series 1. NRL Memorandum Report, NRL/MR/6110-00-8484, September 18, 2000. 8. Wright MT, Gottuk DT, Wong JT, Rose-Pehrsson SL, Hart SJ, Tatem PA, Williams FW. Prototype Early Warning Fire Detection System: Test Series 1 Results. NRL Memorandum Report, NRL/MR/6180-00-8486, September 18, 2000. 9. Hart SJ, Hammond MH, Rose-Pehrsson SL, Shaffer RE, Wong JT, Gottuk DT, Wright MT, Street TT, Tatem PA, Williams FW. Real-Time Probabilistic Neural Network Performance and Optimization for Fire Detection and Nuisance Alarm Rejection: Test Series 1 Results. NRL Memorandum Report, NLR/MR/6110-00-8480, August 31, 2000.
10. Wright MT, Gottuk, DT, Wong JT, Rose-Pehrsson SL, Hart SJ, Hammond MH, Tatem PA, Street TT, Williams FW. Prototype Early Warning Fire Detection System: Test Series 2 Results. NRL Memorandum Report, NRL/MR/6180-00-8506, October 23, 2000. 11. Rose-Pehrsson SL, Hart SJ, Hammond MH, Wong JT, Gottuk DT, Wright MT, Street TT, Tatem PA, Williams FW. Real-Time Probabilistic Neural Network Performance and Optimization for Fire Detection and Nuisance Alarm Rejection: Test Series 2 Results. NRL Memorandum Report, NRL/MR/6110-00-8499, October 10, 2000. 12. Wright MT, Gottuk DT, Wong JT, Pham H, Rose-Pehrsson SL, Hart SJ, Hammond MH, Tatem PA, Street TT, Williams FW. Prototype Early Warning Fire Detection System: Test Series 3 Results. NRL Memorandum Report, (In Preparation). 13. Shaffer RE, Rose-Pehrsson SL, McGill RA. Probabilistic Neural Networks for Chemical Sensor Array Pattern Recognition: Comparison Studies, Improvements and Automated Outlier Rejection. NRL Formal Report 6110-98-9879, 1998. 14. Shaffer RE, Rose-Pehrsson SL, McGill RA. A Comparison Study of Chemical Sensor Array Pattern Recognition Algorithms. Anal Chim Acta 1999; 384: 305-317. 15. Specht DF. Neural Networks 1990; 3: 109-118. 16. Masters T. Practical Neural Network Recipes in C++. Academic Press Inc, Boston, MA, 1993. 17. Masters T. Advanced Algorithms for Neural Networks. John Wiley, New York, 1995. 18. Shaffer RE, Rose-Pehrsson SL. Improved Probabilistic Neural Network Algorithm for Chemical Sensor Array Pattern Recognition. Anal Chem 1999; 71(9): 4263-4271.