1
Real-Time Simulation and Hardware-In-The-Loop Tests of a Battery System Javad Khazaei, Lakshan Piyasinghe, Vahid Rasouli Disfani, Zhixin Miao, Lingling Fan and George Gurlaskie
Abstract—In this paper, a real time model of the microgrid with an energy storage system has been implemented in RTLab. Coordinated control of the battery storage system with a PV system is simulated. To be more realistic, hardware-in-theloop (HIL) testbed has been implemented with a real battery cell (3.2-V, 40-Ahr) connected to the real-time simulation model of the microgrid. A programmable current source (Magna) and programmable load (Bk 8500) have been used to create charging and discharging paths between the energy storage unit and the RT-LAB. Index Terms—Real-Time Simulator (RT-LAB), Hardware-inthe-loop (HIL), Battery.
I. I NTRODUCTION Modern day microgrid is a combination of different kinds of distributed energy sources, power electronic devices, local loads and energy storage systems. A microgrid can be connected to the grid and work on Grid-Connected mode, or it can operate by its own in the autonomous mode (islanded mode) [1], [2]. With the increasing demand on clean energy these days, more and more renewable distributed energy sources are connected to microgrids which leads to complex operation. This complexity is related to high penetration of renewable sources, disconnections, reconnections, and weather condition. Hence detailed study and pre-planning need to be done before implementing real microgrid systems. Offline simulations and real-time simulations are two such techniques which can be applied to study and simulate complex microgrid operation. Most of the existing research on microgrids are limited to the off-line simulations [3], [4]. For example , in [3], an energy management algorithm is proposed and tested in grid connected and islanded operating modes of the microgrid. There are drawbacks regarding off-line simulations: simulation speed will be very slow when the model is complicated and limits of computer memory do not allow simulation to run a long period. In contrast with off-line simulation, the real-time simulation platforms have the advantages of realtime simulation speed, ability of HIL simulations and online parameter adjustment. These features can not only improve the simulation speed, but also bring efficiency and precision to models as well as results [5]. HIL simulation is an emerging method for advanced experiments in power system analysis. None of the analytical and experimental models can have the same accuracy as a real system. However, a test bed consisting of only physical J. Khazaei, L. Piyasinghe, VR. Disfani, Z. Miao, and L. Fan are with the Department of Electrical Engineering, University of South Florida, Tampa, FL 33620. Email:
[email protected].
systems is very expensive. Therefore, only for the important modules, physical devices will be used. The other modules of the testbed will be modeled in software. The physical system and the software simulation have to be interconnected. In the literature, research papers have been dedicated to HIL studies in the power system field [6]–[9]. In [9], a hybrid energy system consisting of a fuel cell and a battery storage system is simulated by HIL. The fuel cell and electric machines are simulated in MATLAB/Simulink while the battery storage system is a physical device. Studies are needed to verify the performance of the battery system in microgrids. Specifically, battery degradation studies can be handled through HIL simulations in forms of capacity loss, impedance rise (power fade) and potential change. The rate of capacity loss of a battery depends on the charging/discharging conditions, depth of discharge (DOD), magnitude of current, load profiles and temperature [10]–[12]. In order to perform above tasks, a complicated microgrid system has to be implemented in a real-time simulator. Hence, a microgrid composed of different renewable energy sources such as wind farm and PV system, as well as a battery energy storage system, a plug-in electric vehicle (PEV) and an induction machine (IM) load have been built in RT-LAB simulators at USF Smart Grid Research Lab. These devices have convenient I/O ports for digital, analog, and encoded signals with flexible definitions of ports. A real battery system is then connected to the RT-LAB to form a HIL system. Case studies have been conducted to examine the performance of battery system. The rest of the paper is organized as follows. In Section II the system configuration, simulation model of the microgrid and HIL setup are described. RT-lab simulation results of two case studies are presented in Section III. In the first case, effect of charging and discharging of the batteries has been studied. In the second case, coordinated control of a battery and a PV system is implemented and studied. The HIL simulation results are described in Section IV. Section V concludes the paper. II. S YSTEM T OPOLOGY The microgrid is a relatively small power system consisting of several different components. In Fig. 1, the microgrid is connected with the main grid via a transformer. Two renewable energy resources are included in the microgrid: a PV array and a wind farm (PMSG). An energy storage device is used to store the excess power generated by renewable energy resources or compensate the microgrid if more active power is needed.
2
An electric vehicle model is also included to represent the increasing penetration of electric vehicles. The customer load is modeled as an induction machine and a nonlinear power electronics load.
PCC 13.8/2.4
Vm
A. Modification of System Topology to Apply HIL Simulation
Charge
RT LAB
IM
Discharge
Current Source
Programmable Load
1.6MW 13.8/3.3
AC/DC 69 kV 69 kV/13.8 kV Grid
2MW PV
13.8/0.24
Host Computer
2kW PEV
AC/DC
0.73kV, 2 MVA
13.8/0.575 20km
Battery Pack
Fig. 2. HIL testbed setup.
In order to implement HIL, a real battery cell (3.2-V, 40Ahr)is used. As the voltage and size of the battery system in Rectifier 13.8/3.3 Battery the computer simulation model is 8.2 kV and 2 MWhr, two Load 8kV scaling factors equal to 2560 and 6 are applied to adjust the 2MWhr AC/DC voltage and the current, respectively. As illustrated in Fig. 2, the battery is modeled as a controllable voltage source in the Fig. 1. Microgrid topology. Simulink model. RT-Lab is the platform used for real time running of the Simulink model and communication with the The microgrid studied in this project consists of six com- hardware. The voltage source control signal is the scaled value ponents which is shown in Fig. 1. The microgrid is built in of voltage measured from the real battery system, which is RT-LAB Systems where all power electronic converters are provided as an analog signal to the RT-Lab. The value of modeled in details. The battery station consists of two groups current flowing through the battery in the Simulink model connected in series. Each group has an equivalent open circuit defines how much current must be applied to the real battery. dc voltage at 4.1 kV. The maximum active power capability Then it will be scaled down and fed into the a programmable is 1MW for each group, and the energy capacity is 1MWh, current source (Magna) through analog output ports of RTwhich means the whole battery station could inject 2MW Lab. Magna will capture the analog output from RT-LAB, active power to the microgrid for 1 hour. then inject this current in order to charge the batteries. For The PV array consists of many small PV panels, which discharging the batteries, a programable load, BK 8500, has could build up an open-circuit dc voltage to 2 kV for the whole been employed which will sink the battery current. Fig. 3 array. The short-circuit dc current under nominal insolation depicts the configuration designed for Hardware-in-the-Loop level is set to 1 kA. The PV array is connected to a dc/dc simulation of the battery system at USF Smart Grid Power converter, which is controlled by Maximum Power Point Systems Lab. Tracking (MPPT) algorithm. A dc/ac inverter connects the dc/dc converter to the microgrid. Hardware‐in‐the‐Loop Software‐in‐the‐Loop The PMSG is connected to the microgrid via a 20 km Current Signal transmission line. The stator of the PMSG is connected to a three-phase rectifier and then a three-phase inverter is used to convert the dc voltage back to ac voltage. Between the rectifier and inverter, a dc/dc converter is used to regulate the 13.8‐V Voltage Signal BATTERY 40 Ahr Busbar electric power generated by the wind turbine. Table I lists the 25.4 V parameters of each component in the microgrid. DC/AC
PMSG
TABLE I S IMULATION SYSTEM PARAMETERS . Quantity ac grid voltage Induction machine ratings PEV battery ratings Battery ratings PV ratings PMSG ratings Load ratings
Value 69kV (L-L RMS) 2.4kV, 1.6MW 0.375kV, 53kWhr 8.2kV, 2MWhr 2kV, 2MVA 0.73kV, 2MVA 100ohm+500mH
AC/DC
Fig. 3. Hardware-in-the-loop simulation of the battery system.
B. Battery inverter Control Before describing the HIL simulations it has to be mentioned that the battery inverter has been enhanced with different controllers for different purposes in the system. Three control modes are considered for the battery: power control, dc-link voltage control and voltage/frequency control [13]. The former two modes can be used when the microgrid
3
is grid-connected. The third control mode is applied when the microgrid is at its autonomous mode and there is no synchronous generator. The control system of a VSC for a battery consists of two loops: inner current control loop and outer control loop. The outer control loop can be either active power control loop or dc-link voltage control loop when the microgrid is grid-connected. When the battery is supplying a stand alone microgrid, the outer control loop will be switched to ac voltage and frequency control [13], [14].
V dc V dc* + − Pdc* +
PI
−
V dc
PI
i
Pdc Qac
Qac* +
−
Vac* + Vac − AC Voltage Magnitude Calculation
* d
+
PI
i
* − q
+
PI −
PI
vd′
−
v′q
*
vα 1
e− jθe vβ* 1
+
−
PI
vd*1 vq*1
−
θe
ωL
vd
+ +
v a*1, b 1, c 1 2/3
C
Measure
PWM
e
PPV and SOC
R
Voltage angle calculation
− jθe
C. Coordinated Control of Battery and PV In the microgrid, the battery and PV are designed to be controlled in a coordinated matter. The total power of battery and PV combined system is designed to inject 1 MW to the microgrid. The PV power varies with environmental conditions, such as irradiation level. When the irradiance is high, the PV panel generates power more than 1 MW, the extra power will be stored into the battery. When the irradiance is low which makes the PV panel generate power less than 1 MW, the remaining power will be supplied by the battery. That control scheme can ensure the total active power injected to the microgrid is always 1 MW ensuring smooth power profile in the microgrid by compensating the intermittence nature of PV power. Such coordination considering battery SOC limits is shown in Fig. 6.
calculate
L
vα ,β
va ,b , c
1 PPV
3/2
ωL
id
e− jθe
iq
iα , β
ia ,b,c
SOCMin SOC SOCMax
3/2
no P Battery 0
yes
PBattery 1 PPV
Fig. 4. Control of the battery inverter.
Fig. 6. Coordinated control of a battery and a PV.
III. S IMULATION R ESULTS FOR BATTERY P ERFORMANCE IN M ICROGRID A. Base Case In this case, the performance of the battery energy storage with P − Q control mode is validated. The battery should be able to respond to the reference active power changes and follow the reference signal perfectly. Simulation result for this case is illustrated in Fig. 7. 6
2 0 −2
SOCMin SOC SOCMax
no Disconnect
Power measurement Power command
4 P (MW)
The decoupled current control is shown in Fig. 4. As it can be observed, the abc variables will be transformed into the synchronous reference frame. The d and q axis components of the current flowing between the AC system and the battery inverter are used for controlling the inverter. The d axis is used to control the DC voltage or active power which in this study is set to active power control. The q axis is used for voltage regulation of reactive power support which in this study is not going to be used and it has been set to zero. In addition to the control strategy presented in Fig. 4, an upper level control scheme should be included to monitor SOC and protect the batteries. Fig. 5 shows the upper level control scheme, as long as the SOC is greater than minimal allowable value and less than maximum allowable value, the battery would continue operating at PQ mode. Otherwise, it should be disconnected, power balance will be kept by grid power transfer.
0
12
24
36
48 60 Time (min)
72
84
96
108
Battery
yes
Fig. 7. Reference active power change for a battery connected to the microgrid
Continue
Require Power From Grid
P - Q Mode
End Fig. 5. Upper level control considering SOC.
As it can be seen, charging and discharging processes are considered by changing the sign of the reference power command. Negative sign indicates charging of the batteries and positive sign indicates discharging the batteries. As it is illustrated, the battery control system can follow the reference power signal, which verifies the effectiveness of designed control loop.
4
As discussed in the previous chapter, the battery and PV are designed to control the grid power to be fixed at 1 MW. Simulation results for this case is illustrated in Fig. 8. The dashed line is the total power which is derived by summation of PV power and Battery power. During the simulation, the irradiation level varies which
SOC Status
B. Performance of PV and Battery Charging Stopped
0.91 0.9 0.89
Discharging Started
0
0.1
0.2
0.3
0.4
0.5
0.6
0.7
0.8
0.9
1
3 2 Power (MW)
2
1
1 0
0.5 0
−2 PV Power Battery Power Total Power 0.7
0.8
0.9 1 1.1 Time (Hour)
1.2
1.3
1.4
1.5
Fig. 8. Coordinated control of battery and PV.
makes the output power of PV panel to change. Because of the coordinated controller, the battery output power changes automatically to compensate the power change at PV site. The total power is always kept at 1MW with small oscillation when irradiation level changes. Due to the sudden irradiance decrease after 1 Hour, the PV power will fall down from 0.35 MW to −0.5 MW, in this condition the battery is discharged quickly to support the grid power. As it can be seen, the battery power will increase from 0.65 MW to 1.5 immediately to compensate the grid power.
0
0.1
0.2
0.3
0.4 0.5 0.6 Time (Hour)
0.7
0.8
0.9
1
Fig. 9. Coordinated control of battery and PV considering SOC limits.
Vcell (V)
0.6
3.5 3
ICharge (A)
−0.5 −1 0.5
PV Battery Total power
−1
Idischarge (A)
Power (MW)
1.5
0
10
20
30
40
50
60
0
10
20
30
40
50
60
0
10
20
30 Time (hrs)
40
50
60
10 5 0 10 5 0
Fig. 10. Measured voltage and current profiles of a single battery cell.
C. Simulation Results Considering SOC limits As it was discussed in previous chapter, whenever the SOC limit is kept within the predefined limits, the coordinated control is achieved. If the SOC is greater than SOCM ax or less than SOCM in , the battery will be disconnected and extra power will be supported by thegrid. At this situation, the coordination can not be achieved anymore. Fig. 9 shows that at 0.45 second, the SOC is greater than the SOCM ax = 0.908 and the battery is disconnected from the system. The battery will remain disconnected till the PV power is less than 1 MW. It is observed that at 0.57 second, the PV power is less than 1 MW and battery is now started to be discharged. This will decrease the SOC and keep SOC between limits.
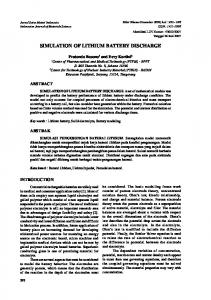
of the battery (40 Ahrs), the upper bound for the charging process has been selected as 3.58 Volt and the lower bound for discharging process has been selected as 3.1 Volt. Fig. 11 presents the charging and discharging process in a more detailed manner. The roundtrip efficiency of the battery can be calculated by referring to the energy graph which is presented in Fig. 12. The stored energy during charging process is 138.26 VAh and released energy during discharging is 130.36 VAh resulting 94.3 % roundtrip efficiency at the current operating point. 3.6 3.5
The HIL setup consists of RT-Lab, a physical battery cell, a Magna source and a BK programmable load. Fig. 10 illustrates the voltage and current profiles of the single cell battery during a charging and discharging process. A simple charge discharge profile has been implemented as the first case to study the degradation of batteries. Fig. 10 presents 60 hours of data collected through RT-LAB with HIL setup. In order to charge and discharge at a full rated capacity
Vcell (V)
IV. HIL E XPERIMENTS R ESULTS
Charging
3.4
Discharging
3.3 3.2 3.1 3
14
15
16
17
18 19 Time (hrs)
20
Fig. 11. Voltage and current profiles of a battery cell.
21
22
23
5
conducted in the HIL testbed to obtain 60-hour data. The experiments demonstrate the capability of the HIL testbed.
150 Energy (VAh)
Charging
Discharging
100
130.36
ACKNOWLEDGEMENT
138.26
50
0 42
43
44
45
46
47 48 Time (hrs)
49
50
51
52
R EFERENCES
Fig. 12. Energy profile of the battery cell. 3.6
Vcell (V)
3.5 X: 19.06 Y: 3.349
3.4
X: 19.18 Y: 3.282
3.3 Charging 3.2
Open Circuit
Discharging
3.1 3 18
18.5
19
19.5
Time (hrs)
Fig. 13. Battery cell voltage profile for calculation of internal resistance
Voltage profile presented in Fig. 13 can be utilized to calculate the internal resistance of a battery cell. The discharging of the battery can be represented by the equivalent circuit presented in Fig. 14. Hence the internal resistance can be calculated using, Rint =
Voc − Vdischarge Idischarge
(1)
Here Idischarge is set as 10 A. According to Fig. 13 Voc is 3.35 V and Vdischarge is 3.282 V . Hence internal resistance can be derived as 6.8 mΩ. V. CONCLUSION In this paper, how to setup an HIL testbed for a microgrid with a battery energy storage system is described. A HIL testbed has been created to connect RT-LAB with a real battery cell to test the performance of the battery. The performance of the battery system in P-Q control mode is tested in realtime simulations. Furthermore, a coordinated control strategy is designed and implemented for battery and PV. The coordinated control ensures that the total power of battery and PV always is kept constant regardless of the weather condition. A full capacity battery charge and discharging experiment is
Rint Vdischarge
Voc
Fig. 14. Resistance calculation circuit.
This research is funded in part by Duke Energy through Community Power Systems Simulation Project. The authors would also like to acknowledge the Opal-RT company for support in eMEGAsim and RT-LAB test setup.
[1] F. Katiraei, M. R. Iravani, and P. Lehn, “Micro-grid autonomous operation during and subsequent to islanding process,” Power Delivery, IEEE Transactions on, vol. 20, no. 1, pp. 248–257, 2005. [2] F. Katiraei and M. Iravani, “Power management strategies for a microgrid with multiple distributed generation units,” Power Systems, IEEE Transactions on, vol. 21, no. 4, pp. 1821–1831, 2006. [3] K. Tan, P. So, Y. Chu, and M. Chen, “Coordinated control and energy management of distributed generation inverters in a microgrid,” Power Delivery, IEEE Transactions on, vol. 28, no. 2, pp. 704–713, 2013. [4] S. Adhikari and F. Li, “Coordinated vf and pq control of solar photovoltaic generators with mppt and battery storage in microgrids,” 2014. [5] J. Khazaei, L. Piyasinghe, Z. Miao, and L. Fan, “Real-time digital simulation modeling of single-phase pv in rt-lab,” in PES General Meeting Conference & Exposition, 2014 IEEE. IEEE, 2014, pp. 1– 5. [6] M. Steurer, C. Edrington, M. Sloderbeck, W. Ren, and J. Langston, “A megawatt-scale power hardware-in-the-loop simulation setup for motor drives,” Industrial Electronics, IEEE Transactions on, vol. 57, no. 4, pp. 1254–1260, 2010. [7] H. Li, M. Steurer, K. L. Shi, S. Woodruff, and D. Zhang, “Development of a unified design, test, and research platform for wind energy systems based on hardware-in-the-loop real-time simulation,” Industrial Electronics, IEEE Transactions on, vol. 53, no. 4, pp. 1144–1151, 2006. [8] O. Craciun, A. Florescu, S. Bacha, I. Munteanu, and A. Bratcu, “Hardware-in-the-loop testing of pv control systems using rt-lab simulator,” in Power Electronics and Motion Control Conference (EPE/PEMC), 2010 14th International. IEEE, 2010, pp. S2–1. [9] L. Gauchia and J. Sanz, “A per-unit hardware-in-the-loop simulation of a fuel cell/battery hybrid energy system,” Industrial Electronics, IEEE Transactions on, vol. 57, no. 4, pp. 1186–1194, 2010. [10] J. Zhang and J. Lee, “A review on prognostics and health monitoring of li-ion battery,” Journal of Power Sources, vol. 196, no. 15, pp. 6007– 6014, 2011. [11] A. Millner, “Modeling lithium ion battery degradation in electric vehicles,” in Innovative Technologies for an Efficient and Reliable Electricity Supply (CITRES), 2010 IEEE Conference on. IEEE, 2010, pp. 349–356. [12] S. B. Peterson, J. Apt, and J. Whitacre, “Lithium-ion battery cell degradation resulting from realistic vehicle and vehicle-to-grid utilization,” Journal of Power Sources, vol. 195, no. 8, pp. 2385–2392, 2010. [13] P. F. Ribeiro, B. K. Johnson, M. L. Crow, A. Arsoy, and Y. Liu, “Energy storage systems for advanced power applications,” Proceedings of the IEEE, vol. 89, no. 12, pp. 1744–1756, 2001. [14] T. B. Johansson and L. Burnham, Renewable energy: sources for fuels and electricity. Island press, 1993.