A MATLAB Graphical User Interface for Battery Design and Simulation; From Cell Test Data to Real-World Automotive Simulation Abbas Fotouhi, Neda Shateri, Daniel J. Auger, Stefano Longo, Karsten Propp Advanced Vehicle Engineering Centre, SATM, Cranfield University, MK43 0AL, UK email:
[email protected];
[email protected] Abstract—This paper describes a graphical user interface (GUI) tool designed to support cell design and development of manufacturing processes for an automotive battery application. The GUI is built using the MATLAB environment and is able to load and analyze raw test data as its input. After data processing, a cell model is fitted to the experimental data using system identification techniques. The cell model’s parameters (such as open-circuit-voltage and ohmic resistance) are displayed to the user as functions of state of charge, providing a visual understanding of the cell’s characteristics. The GUI is also able to simulate the performance of a full battery pack consisting of a specified number of single cells using standard driving cycles and a generic electric vehicle model. After a simulation, the battery designer is able to see how well the vehicle would be able to follow the driving cycle using the tested cells. Although the GUI is developed for an automotive application, it could be extended to other applications as well. The GUI has been designed to be easily used by non-simulation experts (i.e. battery designers or electrochemists) and it is fully automated, only requiring the user to supply the location of raw test data. Keywords- battery; modelling; identification; electric vehicle (EV); simulation; MATLAB graphical user interface (GUI).
I.
INTRODUCTION
Nowadays, batteries are used in a wide range of applications varying from small smartphones and laptops to large high-power electric road vehicles, aircraft and marine craft. In response to this growing demand, much research is focused on the development of new battery technologies. Among these new battery technologies, lithium-sulfur (Li-S) is a promising technology, with a suggested specific energy up to 650 Wh/kg [1]. Common Lithium-ion batteries manage energy densities around 200-250 Wh/kg which roughly allows a range of 250 km for an electric vehicle (EV) with a reasonable and efficient battery size [2]. Li-S technology offers the potential for increased energy storage capacity without an increase in weight, and in applications where weight rather than space is the limiting factor, this offers a potential way to increase an EV’s range. Li-S technology has developed dramatically, but it has not yet been deployed in a full-scale EV to date. As part of efforts to bring it to market, this study is focused on modelling and simulation of Li-S cell for automotive application. A software tool is developed
978-1-5090-0490-4/16/$31.00 ©2016 IEEE
Rajlakshmi Purkayastha, Mark Wild OXIS Energy, Culham Science Centre, Abingdon, Oxfordshire OX14 3DB, UK e-mail:
[email protected]
in this study with unique distinguishing features. The targeted users of it are battery designers and manufacturers who are seeking new applications for their products. During the process of cell design and manufacturing, many experiments are needed to predict a cell’s performance in real conditions; accordingly, there is a need to analyze a large volume of battery test data to understand a cell’s features. Different features may be desirable, depending on the target application. For example, a cell that is going to be used in an EV should be able to deliver high current rates while maintaining a relatively high cycle life. However, these two features may not be vital for a cell in a space application where the weight of cell is the most important factor. Application-specific software tools can make the data analysis part of design process significantly easier and faster. In this study, such a tool is developed to facilitate design and analysis of battery tests for an automotive application: this tool is a MATLAB-based graphical-user-interface (GUI) for battery model identification and application load simulation. The proposed battery simulation GUI consists of two main parts which are: (i) cell model identification and (ii) battery pack simulation. The first part loads raw test data (i.e. current and terminal voltage measurements) and uses this to generate state-of-charge–dependent cell models. The second part simulates a typical EV using the battery model on realword driving cycles. Consequently, the user can visually evaluate a cell’s performance in an automotive application. The benefits of the proposed tool are: (i) it can be used easily by non-simulation experts (i.e. battery designers or electrochemists), (ii) it is fully automated, just needing to know the location of raw test data and returns the outputs, (iii) it runs in the widely-available commercial MATLAB environment, and (iv) the tool can be extended to other applications by replacing the EV model with another suitable models. There are good references of designing GUIs for other applications such as investigation of EV power demand from the grid [3], control of a lifting mechanism [4], Simulation of Modelica Models [5] and a GUI-based simulator for sensor networks [6]. However, there is no similar tool for battery identification and simulation in the literature.
II.
CELL DESIGN AND MANUFACTURE PROCESS AND BENEFITS OF A BATTERY SIMULATOR GUI
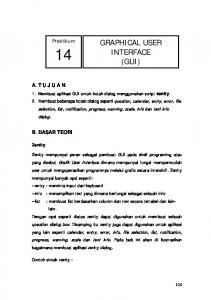
The manufacture of a battery pack for any application involves the combination of different approaches. A systems engineer analyses the application, say automotive, and designs a use case based on projected operation. Once this is done, he rates the pack power and capacity using other constraints such as volume and weight restrictions to come up with a complete design. This will many times include the complete breakdown of the pack into the smaller components i.e. the cell. Thus the cell manufacturers might need to create a bespoke cell to meet these criteria. Almost invariably, the battery manufacturers design the pack around standard cell designs, since creating bespoke cells with exact characteristics are problematic for reasons described below. A battery scientist approaches this from a completely different perspective that is centered around materials issues. For example, the materials which are needed for Li-S cell manufacturing are depicted in Figure 1. It includes a reel of current collector which is combined with electrolyte (shown in the bottle) and other components to give a complete Lithium Sulfur cell as shown in the foreground. In this approach the main question is: which particular combination of materials and chemistries (for anode, separator, cathode and electrolyte) will give us the optimum performance? For example in the Li-S case, sulfur utilization (for cathode), separator porosity, anode thickness, etc. are optimized. The number of parameters for each component is large and varied. Each of these variables is considered both individually and as a group, along with more basic overall issues such as cost and processability. After the material selection process, the cell is assembled and specific tests are run in order to determine the effects of applied loads and temperatures. Because this is fundamental materials research, parameter variations must be kept at a minimum, due to the unpredictable nature of interacting materials. The implications for testing are enormous and faced with limited resources; most cell manufacturers just perform basic industry standard tests. These tests normally involve fixed constant currents in temperature controlled environments. They are not helpful in predicting the cell response to any particular application, as the use case may have a unique combination of applied loads and environments not covered by the standard testing. Therefore even though the cell is designed with care and knowledge, the outcome remains unknown until actual verification testing is conducted. If issues are found then the cell has to undergo either a partial or complete redesign. In the above mentioned design and manufacturing process, using a battery simulator is useful because it provides a method of projecting cell performance into an application based use case, and spotting obvious deficiencies at early stages. The battery simulator is able to predict the cell’s performance in a larger scale (i.e. battery pack) in a specified application. This can be available rapidly at a very low cost by eliminating the need for an expansive test matrix that allows us to immediately identify areas of strengths and weaknesses. For this purpose, a MATLAB-based GUI is
designed for battery model identification and simulation as discussed in the following parts.
Figure 1. Li-S cell manufacturing materials
III.
GUI STRUCTURE
The proposed battery simulation GUI consists of two main parts which are (i) cell model identification and (ii) battery pack simulation. The whole GUI structure is depicted in Figure 7. In the model identification section at top, there is a push button that loads a cell’s test data, consisting of time series of current and terminal voltage measurements. There is not any limitation for the test procedure and the GUI is able to identify the cell model by using different data. However, continuous charge or discharge tests are not recommended for battery model identification. A common approach in the literature for battery modelling is to apply consecutive charge-discharge current pulses and measuring the battery terminal voltage [7]. Different current profiles are used in the literature however; a good profile should contain various current amplitudes and changing frequencies such as the one shown in Figure 2.
Figure 2. A charge-discharge test scaled for a Li-S cell
The data is used by a system identification routine that generates an equivalent circuit network (ECN) model for the cell and displays to the user the model’s parameters, such as open-circuit-voltage (OCV) and ohmic resistance (Figure 7, also to be discussed in Sec. 4). After cell modelling, preliminary battery pack sizing and simulation can be carried out with the GUI. A ‘typical’ EV model is simulated using the battery model, subject to realistic driving cycles. Consequently, the user (who is expected to be a cell designer, not an automotive simulation expert) can evaluate battery performance visually in terms of meeting the driving cycle demands. In the following section, two main parts of the GUI are explained.
A. Cell Model Identification and Battery Pack Design This study uses ECN models for cell model identification. These models are constructed from basic electrical elements: resistors, capacitors and voltage sources in a circuit. The simplest form of an ECN battery model is internal resistance model (R model) [8]. The R model includes an ideal voltage source and a resistance as depicted in Figure 3(a) in which VOC is OCV, RO is internal resistance, Vt is the battery terminal voltage and IL is the load current. Adding one RC network to the model increases its accuracy by considering the battery polarization characteristics. Such a model, called Thevenin model or 1RC model [9], is illustrated in Figure 3(b) in which RP and CP are equivalent polarization resistance and capacitance respectively. Adding more RC networks to the battery model (like 2RC model in Figure 3(c)) improves model’s accuracy however; it increases the complexity as well. So, a compromise is needed between computational effort and accuracy. A review on different battery models and modelling approaches can be found in [7].
Figure 3. ECN battery model structures: (a) R model, (b) 1RC model, (c) 2RC model
After selecting a structure for cell’s model, the model’s unknown parameters are determined. The cell model’s performance should be as much similar as possible to the real cell. This goal is achievable by changing the model’s parameters. So, a parameter vector (θ) is determined so that the error ( ε ) between measurements and model’s prediction is minimized as follows: (1) ε (tk ,θ ) = y(tk ) − yˆ (tk tk −1;θ ) where y ( t k ) is the measurement data at time k and yˆ(tk tk −1 ;θ ) is the model’s prediction at time k using parameters θ. In this case, the battery model’s parameters are optimized so that the least difference between the measured terminal voltage and the model’s output is achieved. For this purpose, a fitness function like the root mean square error (RMSE) can be used as follows: 1 RMSE = N
1
2 ε (tk , θ ) k =1 N
2
(2)
A mathematical algorithm is needed to minimize RMSE which is called identification algorithm. Here, prediction error minimization (PEM) algorithm is used. There is enough explanation about PEM algorithm in the literature and one of the best is presented in [10] by L. Ljung. More details of battery model parametrization using PEM can be found in [11]. Figure 4 demonstrates a comparison between the identified 1RC model’s output (obtained by using the proposed identification code) and experimental data for the charge-discharge test.
Figure 4. Li-S cell terminal voltage prediction vs. experimental data
Having the cell model, a battery pack is designed by determination of number of cells in series and number of parallel circuits. The overall performance of the pack is investigated by using the GUI in terms of power delivery. Thermal management of the pack is not considered in this version of the GUI which can be added later. The cell’s parameters are identified as a function of stateof-charge (SOC). This means that the tests should be conducted from fully charged state to depleted state in order to have a complete model. In the proposed GUI, battery pack simulation is performed at a fixed SOC value which is determined by the user as an input. Calculation of SOC by integrating the current is possible to have a varying SOC during the simulation however, it is fixed by purpose to make it simple and clear for non-simulation experts. B. Electric Vehicle Modelling and Simulation A typical EV model is developed based on Nissan Leaf EV as explained in this section. The model is a MATLAB/Simulink model which is recalled by GUI when the user clicks on the Run push-button. Numerical values of Nissan Leaf model’s parameters are presented in Table 1 [12],[13]. The first part of the EV model is a PI controller which is used as a driver to follow a driving cycle as illustrated in Figure 5. The PI controller’s gains are tuned using ZieglerNichols method as discussed in [14]. At each time step, vehicle’s velocity is compared to the driving cycle and a tracking error is calculated. Regarding the error value, driver’s command is generated which can be an acceleration command (Da) or a brake command (Db). These outputs are normalized between 0 and 1 corresponding to released pedal status and completely pushed pedal status respectively. The tractive force (Ft) is supplied by an electric motor regarding the driver’s acceleration command as follows:
Ft = η m .η gear .
G .Tm Rw
(3) (4)
Tm = Da .Tm ,max
where ηm and ηgear are efficiencies of electric motor (EM) and gearbox respectively. Rw is the wheel radius, G is the gear ratio, Tm is the electric motor’s required torque and Tm,max is the electric motor’s maximum torque at that specified speed. EM model determines final torque value and required power signal is sent to the battery block as shown in Figure 8. In the battery block, available power is calculated based on battery voltage and current limitations in the battery model. Finally, EV traction force is calculated based on available power (Figure 8). Having the traction force value, vehicle’s acceleration and speed can be calculated if opposing forces are available as depicted in Figure 6. The opposing forces are air drag, rolling resistance, road gradient and brake forces. The aerodynamic drag force (Fa) is: Fa =
1 ρ A f Cd V 2 2
TABLE 1: NUMERICAL VALUES OF EV MODEL PARAMETERS Parameter Af Cd Cr Fb f,max g G Mv Rw
ρ
ηm ηgear γregen
Description Vehicle frontal area Drag coefficient Rolling resistance coefficient Maximum brake force Gravity Gear ratio Vehicle mass Wheel’s radius Air density Electric motor’s efficiency Gearbox efficiency Regeneration efficiency
Value 2.27 0.29 0.012 3500 9.81 7.94 1685 0.31 1.225 0.88 0.97 0.3
Unit m2 – – N m/s2 – kg m kg/m3 – – –
(5)
where the parameters ρ, Af ,Cd and V are air density, vehicle's frontal area, drag coefficient and vehicle's velocity respectively. The rolling resistance force (Fr) is: (6)
Fr = Cr M v g
where Cr, Mv and g are the rolling resistance coefficient, vehicle's mass and gravity respectively. The gradient force (Fg) is calculated based on road grade (θ ): (7)
Fg = M v g sin θ
Brake forces are friction brake force (Fb f) and regenerative brake force (Fb,reg). Of the total required braking force, X ratio is supplied by the regenerative brake and (1 – X) ratio is supplied by the friction brake. The parameter X is determined as a function of vehicle's velocity. The friction brake force is obtained by the following formula, in which Fb f,max is the maximum friction brake force. Fb f = (1 − X ). Db . Fb f ,max
(8)
Fb , reg = X . Db . Fb f ,max
(9)
As shown in Figure 6, the total opposing force (Fo) is: Fo = Fa + Fr + Fg + Fb f + Fb , reg
Figure 5. Driver model block
(10)
Figure 6. Velocity calculation block
IV.
A CASE-STUDY
In a case-study, the proposed battery simulation GUI is used for simulation of a Li-S battery pack on New European Driving Cycle (NEDC). The GUI is used by the cell’s developer, i.e. OXIS Energy Ltd., to investigate cell’s performance for automotive application. For this purpose, a battery pack should be designed firstly. Figure 7 demonstrates the whole structure of the GUI where the user can build a battery pack by changing the number of cells in series and parallel. There is also an option for the battery designer to investigate cell’s performance at different charge levels. The GUI automatically selects proper values of battery parameters (OCV, ohmic resistance, etc.) with regard to the battery SOC by performing an interpolation. These battery parameters are obtained and stored by the GUI automatically from the raw data just by clicking on the identification button. In this case, cell’s test data is obtained by applying consecutive discharge current pulses (0.1C, 0.5C and 1C rates) to the cell by considering 600 seconds relaxation time in between. The current pulses are repeated from fully charge state to depleted state. There is no charging pulse in this case however, the GUI is able to identify cell’s model based on a mixed charge-discharge test as well which is essential for considering EV regenerative braking. In the existing version of the GUI, the internal resistance battery model (R model in Figure 3(a)) is utilized. However, an option will be added to the next version of the GUI that enables the user to select other ECN model structures as well. The steps of using the GUI are as follows:
(i) check that the raw test data source is in the folder of the GUI. (ii) the identification button (at top) should be used first to extract the battery model. (iii) then the input text boxes (at left) should be filled which means designing the battery pack and SOC determination. (iv) finally, the Run button (at left bottom) should be used to start a simulation. The above mentioned steps are performed for a Li-S cell. The cell model is identified and parameters are plotted at the top part of Figure 7. Then a Li-S battery pack is designed by putting 180 cells in series and 22 circuits in parallel which makes a 3960-cell pack. Nissan Leaf EV model and NEDC are used in the simulations. As shown in Figure 7, the driving cycle (solid line) is plotted in GUI as the reference for EV’s velocity profile (dashed line) at 10% SOC. In this case, the EV follows the driving cycle except at the points that power demand is more than the maximum deliverable power of the battery pack. At 10% SOC, the top speed of the EV will be limited to 100km/h whereas at 40% and 70% SOC it could achieve 110km/h and 120km/h respectively. V.
CONCLUSION
In this study, a GUI tool was developed for a real industrial application. The proposed GUI makes the process of cell design and manufacturing easier and faster. It has unique advantages such as: (i) it is designed to be easily used by battery designers or electrochemists, (ii) it is fully automated which just needs to know the location of raw test data, (iii) it is prepared using MATLAB environment which is an available software, (iv) it is extendable to other applications by replacing the EV model by other specified models. In a case-study, the proposed battery simulation GUI was tested for Li-S cell as a promising technology for automotive energy storage systems. The Li-S cell model was identified successfully and a simulation analysis was performed using a battery pack consisting of Li-S cells. The simulation results demonstrate that how the cell behaves in response to a vehicle-level driving cycle. Then the designer is able to repeat the procedure in order to get a better cell for each particular application. The proposed battery simulator can avoid over designing a cell. For example, at 10% SOC we lose say 20 km/h at the top end of NEDC, the question to answer is that in reality how much extra power the cell needs to deliver in order to perfectly follows the cycle. How much materials research effort is needed to just achieve that verses the needs of the user? Without this tool you could overestimate and strive for more than required and over develop the cell rather than move it forward into an acceptable application sooner. The GUI also allows us to see where to focus materials research efforts - at 10% SOC you are more likely to be dealing with the control of Li2S precipitation as the main cause of reduced power, not for example access to sulfur. If the curves deviated at >70% SOC instead, for example you might draw a different conclusion about access to sulfur limiting the kinetics of the chemistry. In the first case you
might look at tailoring the electrolyte towards Li2S solubility and/or adjust the battery temperature via the battery management system (BMS) at low SOC to improve power, whereas in the latter case, you may focus on electrolyte modification to improve Sulfur solubility and more porous cathode structure to help release sulfur. So the proposed tool can be used to focus materials research and make battery development more efficient in more ways than just reducing the number of test cells that need to be run. In this version of the battery simulator, a fixed EV model (i.e. Nissan Leaf) and just one driving cycle (i.e. NEDC) are used and the user cannot inspect or change them. Indeed, the GUI is intended to be used as a black-box tool by nonsimulation experts. However, more options can be added to next versions of the GUI so that the battery designer can choose from more than one EV or driving cycle. ACKNOWLEDGMENT This research was undertaken as part of two projects: the Revolutionary Electric Vehicle Battery project (REVB, TS/L000903/1), co-funded by Innovate UK, and the Future Vehicle project (EP/I038586/1) funded by EPSRC. Enquiries for access to the data referred to in this article should be directed to
[email protected]. REFERENCES [1] V.S. Kolosnitsyn, “Lithium-Sulfur Batteries: Problems and Solutions,” Russian Journal of Electrochemistry, 2008, 44, pp.506-509, doi: 10.1134/S1023193508050029. [2] C.E. Thomas, “Fuel cell and battery electric vehicles compared,” International Journal of Hydrogen Energy, 2009, pp. 6005-6020, doi: 10.1016/j.ijhydene.2009.06.003. [3] P. Cubon, J. Sedo, R. Radvan, J. Stancek, P. Spanik, J. Uricek, “Calculation of demand of electric power of small electric vehicle using Matlab GUI,” Proc. IEEE ELEKTRO, 2014, pp. 149-153, doi: 10.1109/ELEKTRO.2014.6847891. [4] C. Morales-Cruz, E. Vazquez-Santacruz, M. Gamboa-Zuniga, “Design of a Graphical User Interface to Control a Lifting Mechanism,” Proc. IEEE Mechatronics, Electronics and Automotive Engineering, 2015, pp.162-166, doi:10.1109/ICMEAE.2015.50. [5] C. Schlegel, R. Finsterwalder, “Automatic Generation of Graphical User Interfaces for Simulation of Modelica Models,” Proc. the 8th International Modelica Conference, 2011, doi: 10.3384/ecp11063796. [6] S. Kini, S. Ramasubramanian, “SenNetSim: A GUI-Based Simulator for Sensor Networks,” Proc. IEEE Communications Society, 2007, pp.703-704, doi: 10.1109/SAHCN.2007.4292890. [7] A. Fotouhi, D.J. Auger, K. Propp, S. Longo, M. Wild. “A review on electric vehicle battery modelling: From Lithium-ion toward Lithium–Sulphur,” Renewable and Sustainable Energy Reviews, 56, 2016, pp.1008-1021, doi:10.1016/j.rser.2015.12.009. [8] V.H. Johnson, “Battery performance models in ADVISOR,” J. Power Sources, 110, 2002, pp. 321-329, doi: 10.1016/S03787753(02)00194-5. [9] Z.M. Salameh, M.A. Casacca, W.A. Lynch, “A mathematical model for lead-acid batteries,” IEEE Transactions on Energy Conversion 7(1), 1992, pp. 93-98, doi: 10.1109/60.124547. [10] L. Ljung, “System Identification - Theory for the User,” Prentice Hall, New York, 1987. [11] A. Fotouhi, K. Propp, D.J. Auger, “Electric vehicle battery model identification and state of charge estimation in real world driving cycles,” Proc. IEEE Computer Science and Electronic Engineering, 2015, pp.243-248, doi: 10.1109/CEEC.2015.7332732.
[12] G. Choi, T.M. Jahns, “Design of Electric Machines for Electric Vehicles Based on Driving Schedules,” Proc. IEEE Electric Machines & Drives, 2013, pp.54-61, doi: 10.1109/IEMDC.2013.6556192. [13] J.G. Hayes, R.P.R. de Oliveira, S. Vaughan, M.G. Egan, “Simplified Electric Vehicle Power Train Models and Range Estimation,” Proc. IEEE Vehicle Power and Propulsion, 2011, pp.1-5, doi: 10.1109/VPPC.2011.6043163.
[14] A. Fotouhi, D.J. Auger, K. Propp, S. Longo, “Simulation for prediction of vehicle efficiency, performance, range and lifetime: a review of current techniques and their applicability to current and future testing standards,” Proc. IET Hybrid and Electric Vehicles, 2014, pp.1-8, doi: 10.1049/cp.2014.0959.
Figure 7. A practical use of GUI for Lithium-Sulfur cell model identification and battery simulation on NEDC drive cycle
Figure 8. Traction force calculation block