JBC Papers in Press. Published on November 29, 2016 as Manuscript M116.746743 The latest version is at http://www.jbc.org/cgi/doi/10.1074/jbc.M116.746743
C-di-GMP distribution during biofilm development
Real time, spatial and temporal mapping of the distribution of c-di-GMP during biofilm development Harikrishnan A. S. Nair1, 2, Saravanan Periasamy1,#,, Yang Liang1, 3, Staffan Kjelleberg1 ,3 and Scott A. Rice1, 3* 1
Singapore Centre for Environmental Life Sciences Engineering, 2Interdisciplinary Graduate School, 3School of Biological Sciences, Nanyang Technological University, Singapore. Running title: C-di-GMP distribution during biofilm development Present adress: Rajalakshmi Engineering College, Chennai-602105, India *corresponding author:
[email protected]
1 Copyright 2016 by The American Society for Biochemistry and Molecular Biology, Inc.
Downloaded from http://www.jbc.org/ by guest on March 24, 2017
Keywords: Biofilm development, c-di-GMP, bioreporter, Pseudomonas aeruginosa, image based quantifiction.
C-di-GMP distribution during biofilm development c-di-GMP and show that the amount of this biofilm regulating second messenger was dynamic with time and colony size, reflecting the extent of biofilm heterogenity in real time.
ABSTRACT Bis-(3 ́-5 ́)-cyclic dimeric guanosine monophosphate (c-di-GMP) is a dynamic intracellular signaling molecule that plays a central role in the biofilm life cycle. Current methodologies for the quantification of c-di-GMP are typically based on chemical extraction, representing end-point measurements. Chemical methodologies also fail to take into consideration the physiological heterogeneity of the biofilm and thus represents an average c-di-GMP concentration across the entire biofilm. To address these problems, a ratiometric, image-based quantification method has been developed based on expression of the green fluorescence protein (GFP) under the control of the c-di-GMP responsive cdrA promoter (1). The methodology uses the cyan fluorescent protein (CFP) as a biomass indicator and the green fluorescent protein as a c-diGMP reporter. Thus, the CFP/GFP ratio gives the effective c-di-GMP per biomass. A binary mask was applied to alleviate background fluorescence and fluorescence was calibrated against known c-di-GMP concentrations. Using flow cells for biofilm formation, c-diGMP showed a non-uniform distibution across the biofilm, with concentrated hots spots of c-di-GMP. Additionally, cdi-GMP was found to be localized at the outer boundary of mature colonies in contrast to a uniform distribution in early stage, small colonies. These data demonstrate the application of a method for the in situ, real time quantification of
INTRODUCTION
2
Downloaded from http://www.jbc.org/ by guest on March 24, 2017
The bacterial secondary messenger bis-(3 ́5 ́)-cyclic dimeric guanosine monophosphate (c-di-GMP) plays a central role in cell cycle, motility, virulence, biofilm formation and dispersal (2). Interestingly, the intracellular concentration of c-di-GMP appears to play a role in the regulation of multiple stages of the biofilm life cycle. For example, the first step of biofilm development, reversible attachment, is regulated by flagellar movement, mediated by FleQ, a transcriptional regulator of flagellar expression. Binding of c-di-GMP to FleQ results in a conformational change, leading to downstream gene activation. Other flagellar motility associated proteins such as YcgR and PilZ also have c-diGMP binding sites and function to reduce motility as c-di-GMP increases, leading to the initiation of biofilm formation in Pseudomonas aeruginosa (3). During biofilm maturation, bacteria produce extracellular polysaccharides and other biofilm matrix biopolymers, which are also regulated by c-di-GMP. For example, production of the polysaccharides Pel and Psl in P. aeruginosa is positively regulated by cdi-GMP (4). C-di-GMP is also intimately involved in regulating biofilm dispersal. It was recently shown that the
C-di-GMP distribution during biofilm development homogenization of the biofilm. Thus, concentrations are an average of the whole biofilm and do not take into account spatial variation in the biofilm as a consequence of metabolic gradients. To address whether there are localized cdi-GMP pools in the cell, Christen et al. (2010) constructed a fluorescence resonance energy transfer (FRET)–based biosensor to monitor the c-di-GMP concentration (9) and demonstrated the asymmetrical distribution of c-di-GMP in planktonic cells. Therefore, such reporters, which can be calibrated to the c-di-GMP concentration, can potentially be used to address the c-di-GMP concentration in different parts of the biofilm. Similarly, Rybtke et al., 2012 constructed a reporter for c-di-GMP, where the fluorescence intensity is directly proportional to the concentration of intracellular c-di-GMP and has been used for biofilm studies (1).
Given that biofilms display physiological heterogeneity (8) and that c-di-GMP modifying enzymes also respond to changes in oxygen, nutrients and other environmental signals, it is likely that the c-di-GMP concentration may differ in distinct regions of the biofilms, where bacteria are experiencing different concentrations of nutrients or signals. However, this heterogeneity in the distribution of c-diGMP has not been demonstrated to date. This is in partly due to the fact that the current method for quantifying c-diGMP is based on liquid chromatography–mass spectrometry (LC-MS), requires extraction and
Here, an image-based methodology has been developed to visualize and quantify c-di-GMP in situ in real time using the above-mentioned reporter. The methodology allows for the visualization of c-di-GMP across the biofilm during its developmental stages, and the nondestructive nature of the methodology allowed for repeated measurements of the same biofilm, enabling dynamic quantification during biofilm development. It can also provide a spatial map of c-di-GMP across the biofilm, allowing high spatial resolution. Since the methodology uses two different fluorophores, the signals for the two fluorophores can be slightly out of 3
Downloaded from http://www.jbc.org/ by guest on March 24, 2017
dispersed cells contain low levels of cdi-GMP compared to the biofilm cells (5). This change in c-di-GMP is likely to be a consequence of the cells perceiving particular signals or cues associated with the initiation of dispersal. For example, exposure of biofilms to nitric oxide (NO) releasing compounds causes dispersal of P. aeruginosa biofilms, where exposure to NO is directly linked to the induction of PDE activity, resulting in decreased concentrations of c-di-GMP (6). Similarly, glutamate induced dispersal, also known as nutrient induced dispersal, has been shown to be mediated through dipA, a known phosphodiesterase. The response to a wide range of signals or physiological cues may in part be controlled by distinct DGCs or PDEs, where P. aeruginosa has been shown to encode approximately 40 different proteins capable of modifying c-di-GMP concentrations (7).
C-di-GMP distribution during biofilm development alignment with each other and this property is referred to as the chromatic shift. Further, alignment of the two different wavelengths of light could be affected as they pass through the edges of the lenses rather than through the center of the lens. This can also create a distorted image and is referred to as spherical aberration. Therefore, both the chromatic shift and the spherical aberration effects need to be accounted for to focus and align the two colors appropriately. Using this reporter, it was observed that there was a striking difference in cdi-GMP concentrations across the biofilm where some parts of microcolonies were found to have relatively high concentrations of c-diGMP. Additionally, c-di-GMP was found to be localized in relatively high amounts at the outer boundary of mature colonies, while smaller, less mature colonies showed a more uniform distribution of c-di-GMP.
Plasmid stability Since it has been shown that the presence of antibiotics can induce biofilm formation (11) and hence may confound measures of c-di-GMP here, experiments were performed in the absence of gentamycin. P. aeruginosa PAO1 PcdrA::gfp (ASV) was serially passed in conical flasks for 3 d in the presence or absence of gentamycin at which time, the cells were stained with 4’, 6-diamidino-2- phenylindole (DAPI) and random images were captured using confocal laser scanning microscope using the blue and green channels to
RESULTS Evaluation of different c-di-GMP reporter constructs To determine which constructs of the cdrA::gfp reporter were the most appropriate for real time quantification of c-di-GMP concentrations, each was evaluated by confocal laser scanning microscopy. Overnight planktonic cultures were imaged and the mean intensity of the images was calculated as the total intensity of the image divided by the total cell count. The reporter 4
Downloaded from http://www.jbc.org/ by guest on March 24, 2017
carrying the plasmid PcdrA::gfp showed the highest relative fluorescence, 0.19±.07, while the least fluorescence, 0.013±.006, was observed for the strain where the construct was inserted into the genome and that used an unstable variant of the GFP protein, Tn7-MTR2 (Tn7PcdrA::gfp (ASV)). The P. aeruginosa strain carrying the plasmid based copy of the reporter with the unstable GFP and the strain with the reporter construct with the stable GFP inserted into the genome showed similar, very low levels of fluorescence 0.09±.04 and 0.07±.04, respectively (Figure 1). While the P. aeruginosa strain carrying the plasmid encoded reporter with the stable GFP gave the highest levels of fluorescence, it was unsuitable for the study of dynamic changes in c-di-GMP levels here since the GFP protein half-life is 26 h (10). Therefore, the strain carrying the unstable GFP based reporter on a plasmid was selected for further studies.
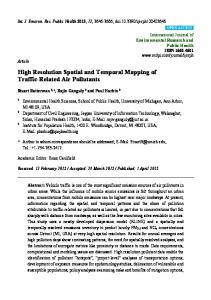
C-di-GMP distribution during biofilm development image total cells and the c-di-GMP reporter simultaneously. The results showed that more than 90% of the cells maintained c-di-GMP associated (green) fluorescence after 72 h and that there was no difference in the percentage of cells expressing GFP for the populations grown in the presence or absence of gentamicin selection (data not shown). C-di-GMP reporter validation The reporter strain has two fluorophores, where the CFP denotes the biomass and the GFP represents the c-diGMP concentration. As noted above, it is necessary to test for and correct any chromatic aberration or shift. When fluorescent beads with similar emission spectra were tested, it was observed that there was indeed a chromatic shift in the XZ plane but not in the XY plane (Figure 2). Therefore, the XZ shift was corrected for three dimensional image stacks in silico (Materials and Methods).
Dynamic nature of the reporter strain To demonstrate that the reporter produces fluorescence in proportion to cdi-GMP concentrations, treatments such as the nitric oxide (NO) donor sodium nitroprusside (SNP), that are known to either result in decreased c-di-GMP (6) or to increase c-di-GMP, e.g. tellurite (TeO2) (13), were added to planktonic cultures and the fluorescence responses were measured over time. The PAO1 ΔwspFΔpslBCDΔpelA mutant was used for the SNP addition studies since the baseline c-di-GMP concentration is already high, while the wild type strain carrying the PcdrA::gfp(ASV) reporter was used for the c-di-GMP induction experiments using tellurite.
To test the c-di-GMP reporter using planktonic cultures, where the sensitivity of the plate reader is low, the PcdrA::gfp (ASV) reporter was transformed into a P. aeruginosa wspF deletion mutant. The deletion of wspF results in high intercellular c-di-GMP (12). However, the high c-di-GMP also results in aggregate formation making the quantification of c-di-GMP unreliable. Therefore, the polysaccharide genes pel and psl were also deleted in the same strain resulting in the P. aeruginosa mutant ΔwspFΔpslBCDΔpelA into which the reporter PcdrA::gfp (ASV) was
Fluorescence intensity can be high due to the presence of a higher number of cells and therefore, cell growth was also measured and fluorescence was normalized to the OD600. Exposure of the 5
Downloaded from http://www.jbc.org/ by guest on March 24, 2017
introduced. Based on quantitative image analysis, it was observed that the mutants P. aeruginosa ΔwspF and P. aeruginosa ΔwspFΔpslBCDΔpelA produced more fluorescence than the wild type P. aeruginosa (Figure 3). The normalized GFP expression, and hence, c-di-GMP concentration, was the highest for the ΔwspF mutant (7324.7 gray value/cell), followed by the ΔwspFΔpslBCDΔpelA mutant (4552.4 gray value/cell) and the least fluorescence was observed for the wild type P. aeruginosa (264.8 gray value/cell).
C-di-GMP distribution during biofilm development a positive growth effect on P. aeruginosa, possibly due to presence of iron, which is a part of the chemical structure of this NO donor. While SNP exposure has been previously reported to result in decreased c-di-GMP levels (6), it is possible that the change in fluorescence of the reporter could be due to secondary effects of the treatment, as a consequence of altered growth. Therefore, careful normalisation of the reporter signal against growth is necessary and ideally should include more than one measure of growth for increased confidence. To demonstrate that the CFP signal was not affected by growth conditions, we monitored both the CFP and GFP signals separately before and after induction of starvation conditions (Figure 5). The raw imaging data showed that the CFP fluorescence was unchanged before and after starvation, whereas the c-di-GMP reporter fluorescence increased. Reporter calibration The fluorescence response of the PcdrA::gfp (ASV) reporter was calibrated against the intracellular concentration of c-di-GMP, as quantified by LC-MS/MS. This allows the arbitrary relative fluorescence units (RFU) to be correlated with cellular concentrations of c-di-GMP and thus, the RFU can be used to estimate c-di-GMP concentration. P. aeruginosa PcdrA::gfp (ASV) and P. aeruginosa ΔwspF PcdrA::gfp (ASV) were imaged using the ratiometric 6
Downloaded from http://www.jbc.org/ by guest on March 24, 2017
cells to SNP resulted in an increase in growth as measured by an increase in OD600 (Figure 4A). Exposure of bacteria (20 h) to 125 µM SNP showed the highest growth, OD600 1.07, followed by 250 µM SNP reaching a maximum OD600 of 0.91. P. aeruginosa PAO1 ΔwspFΔpslBCDΔpelA PcdrA::gfp (ASV) with no added SNP only achieved a maximum OD600 of 0.801. At the same time, exposure of P. aeruginosa PcdrA::gfp (ASV) to 20 µg/ml tellurite showed reduced growth for the wild type strain, which achieved approximately 50% (OD600 0.49) of the control P. aeruginosa PcdrA::gfp (ASV) within 20 h, while exposure to 50 µg/ml tellurite completely inhibited the growth of P. aeruginosa PcdrA::gfp (ASV). When the GFP production, an indication of the intracellular c-di-GMP concentration, was measured and normalized against growth (Figure 4B), it was observed that for the NO exposed cells, the c-di-GMP concentration was reduced in a dose dependent manner. P. aeruginosa ΔwspFΔpslBCDΔpelA PcdrA::gfp (ASV) exposed to 125 µM of SNP showed a relative fluorescent intensity drop of 85% within the first 30 min. There was a 59% decrease in fluorescence for the P. aeruginosa ΔwspFΔpslBCDΔpelA PcdrA::gfp (ASV) mutant in the presence of 250 µM of SNP. At the same time, the wild type P. aeruginosa PcdrA::gfp (ASV) with 20 µM tellurite showed a slight increase in RFU after 6 h of exposure, while no difference was observed at 50 µM tellurite. The nitric oxide donor SNP had
C-di-GMP distribution during biofilm development imaging method described above and subsequently the same cultures were extracted for c-di-GMP quantification using LC-MS/MS. As expected, planktonic cells of P. aeruginosa PcdrA::gfp (ASV) (Figure 6A) had the lowest c-di-GMP concentration as measured by LC-MS/MS (17 pg of c-diGMP/µg of protein) and the lowest average weighted pixel frequency of 157507 (Figure 6E). The planktonic culture of the P. aeruginosa ΔwspF mutant (Figure 6B) had a higher c-diGMP concentration of 248 pg of c-diGMP/µg of protein than the P. aeruginosa PcdrA::gfp (ASV) biofilm, 172 pg of c-di-GMP/µg of protein of protein. The same trend was also reflected in the pixel frequency, confirming that the ratiometric based imaging correlated with chemical measurements. Planktonic cultures of P. aeruginosa ΔwspF PcdrA::gfp (ASV) had a pixel frequency of 450073 compared to 226652 for biofilms of the P. aeruginosa PcdrA::gfp (ASV). The planktonic culture of the P. aeruginosa ΔwspF PcdrA::gfp (ASV) (Figure 6C) exhibited pellicle formation, and within the pellicles, there were some areas with very high or very low c-di-GMP, demonstrating a nonuniform distribution of c-di-GMP. The P. aeruginosa ΔwspF PcdrA::gfp (ASV) mutant biofilm had the highest measured c-di-GMP (587 pg of c-di-GMP/µg of protein) and the highest average weighted pixel frequency (630083). A standard curve was generated, where the average weighted pixel frequency was plotted against the c-di-GMP
concentration (Figure 6F). A color scale bar was generated from the standard graph with the highest c-di-GMP concentration of 52 ng of c-di-GMP/µg of protein represented by the white color and the lowest concentration of protein, 262 pg of c-di-GMP/µg of protein, represented by the blue color. The distribution of c-di-GMP in a developing biofilm
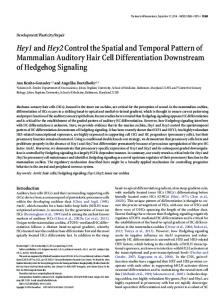
Microcolonies were found to have a uniform concentration of c-di-GMP on day 2, with an average pixel frequency of 424,138 (Figure 7A) and this increased to 525,174 on day 3. The overall pixel frequency on day 4 was lower, 162,321 and, in contrast to the uniform distribution observed on day 2, the distribution of c-di-GMP on day 4 appeared to be more localized, revealing areas of high and low c-di-GMP. Large colonies (diameter > 50 µm) had higher concentrations of c-di-GMP at the microcolony boundary than in the interior (Figure 7C). At the same time, 7
Downloaded from http://www.jbc.org/ by guest on March 24, 2017
Based on the validation studies above, the spatial distribution of c-diGMP across the different regions of a developing biofilm as well the relative concentration of c-di-GMP was determined for multiple stages of biofilm development. For these experiments, a flow cell biofilm was grown in the presence of M9-Glucose, z-stack images were taken at 24 h intervals and ratiometric imaging was applied for each time point at multiple positions across the biofilm.
C-di-GMP distribution during biofilm development
While the chromatic shift can be corrected, other errors could also occur, such as spherical aberration, which is the property of light bending differentially in different parts of a lenses such as at the center or around the edges (16). This effect depends on the refractive index of the medium, thickness of coverslip and the refractive index of the sample. The use of the correct coverslip can partly address the spherical aberration and objective lenses are typically adjusted by the manufacturer to the correct aberration. Nonetheless, spherical aberration due to the change in refractive index remains unanswered and there is not currently an approach to correct for this factor. For example, the fluid channels in the microcolony have a different refractive index than that of the biomass, so it is possible to have a spherical aberration when imaging the biofilm microcolony. It may be possible to directly measure these effects using an artificial biofilm made from fluorescent materials that replicates the
DISCUSSION The fluorescent reporter PcdrA::gfp has been used to measure c-di-GMP in planktonic cultures (1). To use this reporter with biofilms, a ratiometric imaging method was developed here. While ratiometric imaging is commonly used, especially for imaging intracellular levels of Zinc, Calcium and pH (14,15), it has some limitations, such as chromatic shift and spherical aberrations (16). Ratio imaging uses two different colors for imaging, with light of two different wavelengths. Chromatic aberration is the property of light to be focused at different points in space based on the wavelength. This can result in failure of the images to be superimposable despite being from the same source. This issue is generally managed through the design of corrective lenses to compensate for the 8
Downloaded from http://www.jbc.org/ by guest on March 24, 2017
chromatic shift. Both the CFP and GFP images, generated using PlanApochromat objectives, superimposed in the XY-axis almost perfectly, although there was a significant chromatic shift in the Z-axis. Since this can give inaccurate readings for 3-D images, the chromatic shift was measured and corrected by adjusting the individual slices (x-y images) in silico. The ratio image of the corrected image showed perfect superimposition. In this way, all of the ratio images used in the study were corrected for the chromatic shift.
small colonies (< 50 µm) had a uniform concentration of c-di-GMP and there was no pattern of spatial differentiation. The c-di-GMP concentration continued to decrease to day 5, reaching the lowest pixel frequency measured for the biofilm, 57,272 (Figure 7F). We have previously showed that P. aeruginosa monoculture biofilms typically disperse at day 4 when grown in a flowcell fed with M9-glucose medium (14). Even though we did not specifically quantify dispersal here, the lower level of c-diGMP observed on day 4 were consistent with previous studies, where the biofilm typically disperses at this time point.
C-di-GMP distribution during biofilm development microstructure of a biofilm as well as the fluid channels. Other factors that can impact the output or quantification based on ratiometric or other imaging techniques include settings for laser voltage, power, gain, offset etc. were kept constant for all imaging in this study. The c-di-GMP reporter used here is a promoter fusion of the c-di-GMP responsive cdrA gene (PA4624) with an unstable variant of the green fluorescent protein (GFP) (1). The mechanism of regulation of cdrA transcription by c-diGMP is not known, however, the expression levels of cdrA strongly correlate with c-di-GMP levels. The relative levels of the cdrA transcript were 27 fold higher in the c-di-GMP overproducing wspF strain in comparison to the wild type (17). The total c-di-GMP content of a cell includes the freely available c-di-GMP in the cell and the c-di-GMP bound to receptors proteins. However, the binding affinity of these receptor proteins are quite high (sub micromolar) (18) and hence it is likely that the reporter system only responds to the free c-di-GMP in the cell.
The ratio imaging of the developing biofilm showed that the distribution of cdi-GMP changed over time and had localized hotspots of high c-di-GMP across the biofilm. These areas with relatively high c-di-GMP in comparison to the neighboring areas are the first report of this kind. Similar hot spots have been observed in a variety of biological contexts such as calcium hotspots in neuroblastoma cells, copper hotspots in vineyard soils (21,22). The
In order to use the reporter system and the ratiometric imaging developed here in a semi-quantitative fashion the method was extended by binning the images into a fixed scale (Figure 6). The scale used here was a ratio of 0-1 in 500 bins and this was based on comparison of multiple images from our own system. The approach also involved the implementation of a binary mask, as has 9
Downloaded from http://www.jbc.org/ by guest on March 24, 2017
been used widely in computational auditory sensing and background noise cancellation (19). The corrected masked ratio image could be used for in situ, non-destructive live imaging, suitable for dynamic intracellular signaling molecules such as c-di-GMP. The ratio images for the visualization of c-di-GMP distribution in biofilm were correlated with chemical measurements of c-diGMP. During the chemical measurement, it was observed that the triple mutant of P. aeruginosa ΔwspFΔ pslBCDΔpelA showed less c-di-GMP than that of the P. aeruginosa ΔwspF mutant. The c-di-GMP concentration as determined by the ratiometric method developed here also indicated that the triple mutant had less c-di-GMP than the single mutant, although both were higher than the wild type. This may be explained by the observation that Psl can stimulate c-di-GMP production (20) and thus, the triple deletion strain would also be reduced in c-di-GMP production compared to a wspF strain with an intact Psl operon.
C-di-GMP distribution during biofilm development hot spots observed here could either represent high c-di-GMP expression in those cells in response to local physiological conditions or they could be the result of mutations in the bacteria in that region, leading to the constitutive overproduction of c-di-GMP. It has been shown that there is up to a 100 fold increase in the mutation rate in biofilms compared to planktonic cells (23). Such spontaneous mutations cause result in elevated c-di-GMP if the mutations are in genes such as wspF, which are known to modify the c-di-GMP pool. Indeed, such mutants are commonly isolated from biofilms (24,25). The nondestructive nature of the methodology allows for the repeated imaging of the same biofilm, enabling studies of the changes in c-di-GMP throughout the entire biofilm lifecycle as well as in response to different treatments, e.g. starvation or NO treatment. Even though the half–life of the unstable variant of GFP used here was 40 min (26), we saw changes in the fluorescence signal even within 10 min of the start of treatment (data not shown). While it was not a focus of our study, we observed no evidence of photobleaching in those 10 min intervals. More detailed studies would be necessary to determine the limits of imaging for this reporter with regard to the bleaching phenomenon though. The spatial resolution of the method developed here would be the same as for standard imaging. Since the results presented here are based on confocal microscopy, three dimensional reconstructions of the biofilm can be
generated with high spatial resolution. The resolution in the x and y planes are in the order of several micrometers under the conditions used here, although higher magnifications or even superresolution imaging could be used to obtain higher spatial resolution.
10
Downloaded from http://www.jbc.org/ by guest on March 24, 2017
A pattern of high c-di-GMP localized on the outside of the mature colony (diameter > 50 µm) with a much lower concentration in the interior of the microcolonies was observed on day 4. Whereas on day 3 and day 5, the center of the biofilm was found to have high cdi-GMP. This is in agreement with Almblad et al., 2015, where deeper layers of the biofilm have high c-diGMP levels compared to the outside of the microcolonies after 72 h of biofilm development (27). The authors used the same reporter system, but did not take into account the amount of biomass present, where more cells with the reporter in the same place can give rise to an apparently elevated GFP signal. To overcome this limitation, the methodology developed here normalizes the c-di-GMP signal with biomass, allowing us to continuously monitor the same biofilm. Using this approach, we have shown that the c-di-GMP pattern changes with time. This is also particularly interesting and fits with previous observations that dispersal initiates from the interior of the microcolony, where the c-di-GMP content would be expected to be lower (28) or that can be observed as motile
C-di-GMP distribution during biofilm development cells within the microcolony, called seething dispersal (29). The fluorescence of GFP is dependent on oxygen, and that the loss of the GFP signal observed in this study could be due to oxygen limitation in the interiors of the mature biofilm. Hansen et al., 2001 showed that GFP fluorophore maturation can occur at levels of oxygen as low as 0.1 ppm (3.125 µM) (30). De Beer et al. 1994, measured the oxygen gradient in a 160 µm thick biofilm and showed that the oxygen concentration was approximately 10 µM even at the substratum (31), which is much higher than the oxygen concentration needed for GFP to mature. Further, we and others have shown that, for constitutively expressed GFP and for the unstable GFP when used as a reporter, there is no reduction in signal, even for quite thick (60 µm) and mature biofilms (32). Nevertheless, to fully avoid the possibility of artifacts due to oxygen limitation, alternative fluorescent proteins that do not require oxygen for maturation, such as the LOV (light oxygen voltage) protein based on flavin mononucleotide (FMN) could also be used in the future (33).
The distribution of c-di-GMP differed depending on microcolonies size, where smaller microcolonies showed a uniform fluorescence and larger colonies only showed fluorescence around their perimeter. Since this pattern was primarily observed on day 4 at the time of dispersal, it is speculated that, based on this pattern of c-di-GMP, that dispersal initiates from these larger microcolonies. This is in agreement with other studies that have indicated that after the microcolony reaches the maturation stage (approximately 80 µm in diameter), the interior of the colony disperses from a breakout point and
Nutrient and oxygen concentrations are known to affect the c-di-GMP levels in bacteria (34). Since access to these, and other, nutrients by the biofilm will be dependent on a combination of diffusion and metabolic rates of the biofilm community, it is perhaps not surprising that the distribution of c-di11
Downloaded from http://www.jbc.org/ by guest on March 24, 2017
GMP is uneven across the biofilm. This is supported by studies using fluorescent tracers and oxygen sensing optode that have demonstrated their heterogeneous distribution in biofilm microcolonies. In those studies, the oxygen concentrations were observed to decrease steadily from the surface of the microcolonies to the interior (35). In contrast, the amount of c-di-GMP was sharply delineated, where there was a thin, high level around the edges of the larger colonies. Thus, there did not appear to be a gradient of c-diGMP and further work is necessary to understand the relationship between the distribution and local oxygen or nutrient concentrations in the same regions. This difference in c-di-GMP is likely to be due to the gradients of electron donors and acceptors that are established within the biofilm, resulting in physiological stratification of the cells embedded within the matrix (8).
C-di-GMP distribution during biofilm development leaves a nonmotile, empty colony behind (36, 37). The low levels of c-di-GMP on the interior also supports observations that there are often ‘hollow colonies’ left behind after dispersal. It is proposed here that the microcolony shell is maintained by a subpopulation of cells that retain the biofilm phenotype, due to high levels of c-di- GMP, while the interior cells have returned to the planktonic phase.
electroporation, 1 ml of LB broth (10 g/l Tryptone, 5 g/l Yeast extract and 5 g/l NaCl) was added, the cultures were transferred to a 15 ml tube and incubated in 37°C for 1 h with shaking at 180 rpm. Transformants were selected by plating onto LB agar plates supplemented with 300 µg/ml carbenicillin and incubated overnight at 37°C. Bacterial strains and culture media Bacteria (Table 1) were either cultured on LB agar (LB broth with 1.5% bacto agar) or M9 minimal medium (48 mM Na2HPO4; 22 mM KH2PO4; 9 mM NaCl; 19 mM NH4Cl; 2 mM MgSO4; 0.1 mM CaCl2) with 20 mM glucose. Biofilm development in flow cells Biofilms were cultivated in threechannel flow cells (channel dimensions, 1 x 4 x 40 mm) (39). The flow cells were fed with M9 minimal medium with 20 mM glucose as carbon source at a flow rate of 9 ml/h. Each channel was inoculated with 0.5 ml of diluted overnight culture containing 8 approximately 1 x 10 cfu/ml.
MATERIALS AND METHODS C-di-GMP transformation
reporter
and
C-di-GMP measurement in planktonic culture A TECAN Infinite 200 PRO plate reader was used to measure c-di-GMP in planktonic cells based on cdrA::gfp fluorescence (Excitation 485 nm, Emission 520 nm, excitation band width 9 nm and emission band width 20 nm; manual gain of 80) and growth was monitored by quantifying the absorbance at OD600. Measurements were recorded
Four constructs of the fluorescencebased reporter for c-di-GMP (Table 1) were obtained (1) and tested for their suitability in the current study. Electro competent P. aeruginosa PAO1 was prepared as described (38), mixed with plasmid and electroporated (Bio-Rad Gene Pulser Xcell™ Electroporation Systems) using 2500 V, 25 µF and 200 Ω resistance. Immediately after 12
Downloaded from http://www.jbc.org/ by guest on March 24, 2017
The bacteria at the outside of the colony may experience higher nutrient and oxygen compared to the bacteria inside of the microcolonies. Thus, the application of a real time c-di-GMP reporter can provide essential information on physiological status of cells within the biofilm, which enables an improved understanding of the response of those cells to dispersal agents as well as biocides that target different populations of cells.
C-di-GMP distribution during biofilm development in 10 min intervals. The relative fluorescence, GFP/OD600, was calculated and was used as a measure of c-di-GMP per cell.
identified by ploting the Z-axis profile for both channels individually. If the intensity maximum was on different zplanes for the different channels, the difference is the chromatic abberation. If there is a chromatic abberation, duplicate the first few slices at one channel and add slices at the end of other channel to match the total number of slices. Making a composite image with this corrected image will solve the chromatic abberation.
Microscopy and image analysis Biofilm images were acquired using a Carl Zeiss Confocal Laser Scanning Microscope CLSM 780 (Carl Zeiss, Germany) using 20x objective (LD planNeofluar 20x / 0.4 Korr M27). Two separate optical channels were used to image the biofilm biomass and c-diGMP reporter. A stably expressed CFP, inserted into the genome, was used to quantify the biomass and GFP was quantified as a reporter for c-di-GMP. Laser voltage was measured using a Sanwa™ CD800a digital multimeter and kept at 0.587 V throughout the experiment and pinholes of 50 µm and 58 µm were used for CFP and GFP, respectively. An emission bandwidth of 440-503 nm was used for CFP and 497598 nm was used for GFP while the master gain was set to 700 and the digital gain of 1.00 was used for all of the images. Images were processed using ImageJ Version 1.47 (40). of
To map the spatial distribution of cdi-GMP across the biofilm, it was necessary to develop a method that would allow for normalization of the cdi-GMP related GFP expression, with the total cell numbers. Thus, Z-stack images were captured by confocal microscopy and the images were then separated into channels corresponding to either CFP, representing the biomass, or GFP, representing c-di-GMP. Dividing the reporter channel (GFP) by the biomass channel (CFP) gives a ratio for each image, and this ratio is presented, as a pseudo-color image represents the effective amount of c-di-GMP per biomass. Areas where there is no biofilm or where there is some background fluorescence can artificially inflate the normalized data. Therefore, a mask was created from the biomass channel by adjusting the threshold. The mask was then converted to a binary format by dividing by 255 (the maximum pixel value of an 8 bit image 28-1= 255). The resulting binary mask contains values of
chromatic
Blue-green fluorescent beads, 10 µm, polystyrene (FluoSpheres® microspheres, Thermo Fischer Scientific) were imaged using the same parameters as above. Using the ImageJ software, a region of interest were drawn around the bead. Intensity maxima were 13
Downloaded from http://www.jbc.org/ by guest on March 24, 2017
Determination abberation
In situ ratio metric imaging
C-di-GMP distribution during biofilm development ice-cold 1 mM ammonium acetate. The pellets were then resuspended in 2 ml of ice-cold Acetonitrile, Methanol, Water (40%: 40%: 20%) and homogenized by passing it five times through a 20 G needle. The solution was then lysed for 30 min (Power 100%, frequency 37 kHz) in a water bath sonicator (Elma Schmidbauer GmbH, Singen, Germany) filled with ice water. The cell debris were then centrifuged at 10000 g for 10 min at 4°C and the supernatant was retained and kept on ice. The pellet was again resuspended in 2 ml of ice-cold Acetonitrile, Methanol, Water (40%:40%:20%) and extraction was repeated once more as above. The extracts were evaporated at 4°C in a cooling speed-vac (CentriVap® Benchtop Vacuum Concentrators) coupled with a CentriVap Cold Traps (Labconco Corporation USA, 73850 Series) until the volume reached approximately 500 µl. The extracted mixture was then cooled to -80°C and freeze-dried overnight (Labconco FreeZone 4.5 Liter Benchtop Freeze dry system). The dried extract was dissolved in 200 µl of 1 mM ice-cold ammonium acetate, and centrifuged at 10000 g for 10 min at 4°C. The supernatant was then transferred to HPLC vials and analysed by LC-MS/MS (NUS-Environmental Research Institute at the National University of Singapore). LC-MS/MS Quantification of c-di-GMP was performed in an EQuan MAX™ LC-MS system, using an Accela 1250 UHPLC pump connected to a Thermo Velos Pro
Chemical quantification of c-di-GMP by LC-MS/MS Biomass extraction from flow cell biofilms The planktonic phase of the flow cell biofilms were carefully decanted by tilting the flowcell to one end. A syringe containing 2 ml of 1 mM ice-cold ammonium acetate was attached to one end of the flow cell and another empty syringe was connected at the other end. The biomass inside the flow cell was removed through back and forth (10 times) washing using the syringes. C-di-GMP extraction Two milliliters of planktonic culture or 1.5 ml of extracted biofilm were centrifuged (10000 g for 10 min at 4°C) and the pellets were washed with 2 ml of 14
Downloaded from http://www.jbc.org/ by guest on March 24, 2017
either zero or one, where one represents the biomass and zero is the background. Multiplying the masked image with the ratio image gives the masked ratio image, eliminating background. The masked ratio image was then segmented into 500 bins from zero to one to create a histogram. This histogram can be used for quantifying images or comparison of different images. The masked ratio image was then converted to a look up table “16 colors” for visualizing the c-diGMP distribution. The ratio of GFP/CFP of 1 was colored as white and that of 0 was set to black. Using this approach, the areas colored in red correlate with microcolonies having high c-di-GMP, while the yellow region represents parts of the biofilm with lower concentrations of c-di-GMP.
C-di-GMP distribution during biofilm development (10000 g for 10 min at 4°C) and washed once with PBS (137 mM NaCl, 2.7 mM KCl, 10 mM Na2HPO4, 2 mM KH2PO4). The pellets were then resuspended in 1 ml of lysis buffer (0.1% SDS, 0.5 M triethylammonium hydrogen carbonate buffer, Sigma-Aldrich Co) and homogenized by passing five times through a 20 G needle. The solution was then lysed for 30 min (Power 100%, frequency 37 kHz) in a water bath sonicator filled with ice water. The extracted material was then centrifuged at 10000 g for 10 min at 4°C. A standard curve was generated using 25 µl of BSA standards (2000 µg/ml to 0 µg/ml) to quantify sample protein concentrations in triplicate at 562 nm. Acknowledgements The authors would like to acknowledge the financial support from National Research Foundation and Ministry of Education Singapore under its Research Centre of Excellence Program, and Nanyang Technological University research scholarship for the years 2012-2016. Further support was provided by the Australian Research Council (DP140102192). Conflict of interest The authors declare that they have no conflicts of interest with the contents of this article.
Author contributions HASN and SAR designed the experiments, HASN and SP conducted experiments and interpreted the data along with SAR. All of the authors 15
Downloaded from http://www.jbc.org/ by guest on March 24, 2017
Orbitrap mass spectrometer (Thermo Fisher Scientific, San Jose, CA). Chromatographic separation was achieved using a Nucleodur C18 Pyramid column (2 mm x 50 mm, 3 µm) (Macherey-Nagel GmbH, Düren, Germany), held at 40°C, with a solvent flow rate of 0.3 ml/min and an injection volume of 10 µl. The mobile phase A was 10 mM ammonium acetate buffer, containing 0.1% formic acid, and the mobile phase B was acetonitrile, containing 0.1% formic acid. The solvent gradient conditions were: 0% B from 0 min to 10% at 3 min, 90% at 4 min, hold for 5 min, then returned to 0% at 5.5 min and equilibrated for 4.5 min, with a total run time of 10 min. Quantification was performed by positive ion electrospray ionization (ESI+), using selected ion monitoring (SIM) scan type with center mass m/z 691.1021 at high-resolution (60,000). For qualitative analysis, MS/MS was performed using collision induced dissociation (CID) with normalized collision energy 20 (of maximum), with an isolation width of 1 Da and activation time of 30 min. The MS conditions were as follows: the source voltage was 3.6 kV, heater and capillary temperature were 300°C, sheath, auxiliary and sweeper gas flows were 40, 15 and 1 (arbitrary units), respectively. Protein quantification Protein concentrations were determined using the Bicinchoninic acid assay (BCA) protocol, where 1 ml of planktonic culture or 500 µl of biofilm extract was pelleted by centrifugation
C-di-GMP distribution during biofilm development contributed to the writing and reviewing of the manuscript in preparation for publication and approved the final version for submission.
Downloaded from http://www.jbc.org/ by guest on March 24, 2017
16
C-di-GMP distribution during biofilm development
REFERENCES Rybtke, M. T., Borlee, B. R., Murakami, K., Irie, Y., Hentzer, M., Nielsen, T. E., Givskov, M., Parsek, M. R., and Tolker-Nielsen, T. (2012) Fluorescence-based reporter for gauging cyclic di-GMP levels in Pseudomonas aeruginosa. Appl. Environ. Microbiol. 78, 5060-5069
2.
Jenal, U., and Malone, J. (2006) Mechanisms of cyclic-di-GMP signaling in bacteria. Annu. Rev. Genet. 40, 385-407
3.
Baraquet, C., and Harwood, C. S. (2013) Cyclic diguanosine monophosphate represses bacterial flagella synthesis by interacting with the Walker A motif of the enhancer-binding protein FleQ. Proc. Natl. Acad. Sci. U.S.A. 110, 18478-18483
4.
Franklin, M. J., Nivens, D. E., Weadge, J. T., and Howell, P. L. (2011) Biosynthesis of the Pseudomonas aeruginosa extracellular polysaccharides, alginate, Pel, and Psl. Front. Microbiol. 2, 167
5.
Chua, S. L., Liu, Y., Yam, J. K. H., Chen, Y., Vejborg, R. M., Tan, B. G. C., Kjelleberg, S., Tolker-Nielsen, T., Givskov, M., and Yang, L. (2014) Dispersed cells represent a distinct stage in the transition from bacterial biofilm to planktonic lifestyles. Nat. Commun. 5, doi:10.1038/ncomms5462
6.
Barraud, N., Schleheck, D., Klebensberger, J., Webb, J. S., Hassett, D. J., Rice, S. A., and Kjelleberg, S. (2009) Nitric oxide signaling in Pseudomonas aeruginosa biofilms mediates phosphodiesterase activity, decreased cyclic di-GMP levels, and enhanced dispersal. J. Bacteriol. 191, 7333-7342
7.
Römling, U., Galperin, M. Y., and Gomelsky, M. (2013) Cyclic di-GMP: the first 25 years of a universal bacterial second messenger. Microbiol. Mol. Biol. Rev. 77, 1-52
8.
Stewart, P. S., and Franklin, M. J. (2008) Physiological heterogeneity in biofilms. Nat. Rev. Microbiol. 6, 199-210
9.
Christen, M., Kulasekara, H. D., Christen, B., Kulasekara, B. R., Hoffman, L. R., and Miller, S. I. (2010) Asymmetrical distribution of the second messenger c-diGMP upon bacterial cell division. Science 328, 1295-1297
10.
Corish, P., and Tyler-Smith, C. (1999) Attenuation of green fluorescent protein half-life in mammalian cells. Protein Eng. 12, 1035-1040
17
Downloaded from http://www.jbc.org/ by guest on March 24, 2017
1.
C-di-GMP distribution during biofilm development Hoffman, L. R., D'Argenio, D. A., MacCoss, M. J., Zhang, Z., Jones, R. A., and Miller, S. (2005) Aminoglycoside antibiotics induce bacterial biofilm formation. Nature 436, 1171-1175
12.
Hickman, J. W., Tifrea, D. F., and Harwood, C. S. (2005) A chemosensory system that regulates biofilm formation through modulation of cyclic diguanylate levels. Proc. Natl. Acad. Sci. U.S.A. 102, 14422-14427
13.
Chua, S. L., Sivakumar, K., Rybtke, M., Yuan, M., Andersen, J. B., Nielsen, T. E., Givskov, M., Tolker-Nielsen, T., Cao, B., and Kjelleberg, S. (2015) C-di-GMP regulates Pseudomonas aeruginosa stress response to tellurite during both planktonic and biofilm modes of growth. Sci. Rep. 5, 10052
14.
Taki, M., Wolford, J. L., and O'Halloran, T. V. (2004) Emission ratiometric imaging of intracellular zinc: design of a benzoxazole fluorescent sensor and its application in two-photon microscopy. J. Am. Chem. Soc. 126, 712-713
15.
Kikuchi, K., Komatsu, K., and Nagano, T. (2004) Zinc sensing for cellular application. Curr. Opin. Chem. Biol. 8, 182-191
16.
North, A. J. (2006) Seeing is believing? A beginners' guide to practical pitfalls in image acquisition. J. Cell Biol. 172, 9-18
17.
Borlee, B. R., Goldman, A. D., Murakami, K., Samudrala, R., Wozniak, D. J., and Parsek, M. R. (2010) Pseudomonas aeruginosa uses a cyclic‐di‐GMP‐regulated adhesin to reinforce the biofilm extracellular matrix. Mol. Microbiol. 75, 827-842
18.
Chou, S.-H., and Galperin, M. Y. (2016) Diversity of cyclic-di-GMP-binding proteins and mechanisms. J. Bacteriol. 198, 32-46
19.
Wang, D. (2005) On ideal binary mask as the computational goal of auditory scene analysis. in Speech separation by humans and machines (Divenyi, P. ed.), 10 Ed., Springer, United States. pp 181-197
20.
Irie, Y., Borlee, B. R., O’Connor, J. R., Hill, P. J., Harwood, C. S., Wozniak, D. J., and Parsek, M. R. (2012) Self-produced exopolysaccharide is a signal that stimulates biofilm formation in Pseudomonas aeruginosa. Proc. Natl. Acad. Sci. U.S.A. 109, 20632-20636
21.
Silver, R. A., Lamb, A. G., and Bolsover, S. R. (1990) Calcium hotspots caused by L-channel clustering promote morphological changes in neuronal growth cones. Nature 343, 751-754
22.
Jacobson, A. R., Dousset, S., Andreux, F., and Baveye, P. C. (2007) Electron microprobe and synchrotron X-ray fluorescence mapping of the heterogeneous distribution of copper in high-copper vineyard soils. Environ. Sci. Technol. 41, 6343-6349 18
Downloaded from http://www.jbc.org/ by guest on March 24, 2017
11.
C-di-GMP distribution during biofilm development Conibear, T., Collins, S. L., and Webb, J. S. (2009) Role of mutation in Pseudomonas aeruginosa biofilm development. PLoS One 4, 6289
24.
Lee, K. W. K., Yam, J. K. H., Mukherjee, M., Periasamy, S., Steinberg, P. D., Kjelleberg, S., and Rice, S. A. (2015) Interspecific diversity reduces and functionally substitutes for intraspecific variation in biofilm communities. ISME J. 10, 846-885
25.
Koh, K. S., Lam, K. W., Alhede, M., Queck, S. Y., Labbate, M., Kjelleberg, S., and Rice, S. A. (2007) Phenotypic diversification and adaptation of Serratia marcescens MG1 biofilm-derived morphotypes. J. Bacteriol. 189, 119-130
26.
Andersen, J. B., Sternberg, C., Poulsen, L. K., Bjørn, S. P., Givskov, M., and Molin, S. (1998) New unstable variants of green fluorescent protein for studies of transient gene expression in bacteria. Appl. Environ. Microbiol. 64, 2240-2246
27.
Almblad, H., Harrison, J. J., Rybtke, M., Groizeleau, J., Givskov, M., Parsek, M. R., and Tolker-Nielsen, T. (2015) The cyclic AMP-Vfr signaling pathway in Pseudomonas aeruginosa is inhibited by cyclic-di-GMP. J. Bacteriol. 197, 21902200
28.
Stewart, P., Rani, S., Gjersing, E., Codd, S., Zheng, Z., and Pitts, B. (2007) Observations of cell cluster hollowing in Staphylococcus epidermidis biofilms. Lett. Appl. Microbiol. 44, 454-457
29.
Hunt, S. M., Werner, E. M., Huang, B., Hamilton, M. A., and Stewart, P. S. (2004) Hypothesis for the role of nutrient starvation in biofilm detachment. Appl. Environ. Microbiol. 70, 7418-7425
30.
Hansen, M. C., Palmer Jr, R. J., Udsen, C., White, D. C., and Molin, S. (2001) Assessment of GFP fluorescence in cells of Streptococcus gordonii under conditions of low pH and low oxygen concentration. Microbiology 147, 13831391
31.
De Beer, D., Stoodley, P., Roe, F., and Lewandowski, Z. (1994) Effects of biofilm structures on oxygen distribution and mass transport. Biotechnol. Bioeng. 43, 1131-1138
32.
Hwang, G., Liu, Y., Kim, D., Sun, V., Aviles-Reyes, A., Kajfasz, J. K., Lemos, J. A., and Koo, H. (2016) Simultaneous spatiotemporal mapping of in situ pH and bacterial activity within an intact 3D microcolony structure. Sci. Rep. 6, 32841
33.
Drepper, T., Eggert, T., Circolone, F., Heck, A., Krauß, U., Guterl, J.-K., Wendorff, M., Losi, A., Gärtner, W., and Jaeger, K.-E. (2007) Reporter proteins for in vivo fluorescence without oxygen. Nat. Biotechnol. 25, 443-445
19
Downloaded from http://www.jbc.org/ by guest on March 24, 2017
23.
C-di-GMP distribution during biofilm development Gjermansen, M., Ragas, P., Sternberg, C., Molin, S., and Tolker‐Nielsen, T. (2005) Characterization of starvation‐induced dispersion in Pseudomonas putida biofilms. Environ. Microbiol. 7, 894-904
35.
Rani, S. A., Pitts, B., and Stewart, P. S. (2005) Rapid diffusion of fluorescent tracers into Staphylococcus epidermidis biofilms visualized by time lapse microscopy. Antimicrob. Agents Chemother. 49, 728-732
36.
Purevdorj-Gage, B., Costerton, W., and Stoodley, P. (2005) Phenotypic differentiation and seeding dispersal in non-mucoid and mucoid Pseudomonas aeruginosa biofilms. Microbiology 151, 1569-1576
37.
Kirov, S. M., Webb, J. S., Che, Y., Reid, D. W., Woo, J. K., Rice, S. A., and Kjelleberg, S. (2007) Biofilm differentiation and dispersal in mucoid Pseudomonas aeruginosa isolates from patients with cystic fibrosis. Microbiology 153, 3264-3274
38.
Choi, K.-H., and Schweizer, H. P. (2005) An improved method for rapid generation of unmarked Pseudomonas aeruginosa deletion mutants. BMC Microbiol. 5, 30
39.
Tolker‐Nielsen, T., and Sternberg, C. (2011) Growing and analyzing biofilms in flow chambers. in Curr. Protoc. Microbiol. pp 2.1 - 2.17
40.
Abràmoff, M. D., Magalhães, P. J., and Ram, S. J. (2004) Image processing with ImageJ. Biophoto. Inter. 11, 36-42
20
Downloaded from http://www.jbc.org/ by guest on March 24, 2017
34.
C-di-GMP distribution during biofilm development TABLES Table 1: C-di- GMP reporter constructs used in this study. Reporter construct Description Reference Tn7 PcdrA::gfp Genomic insertion-stable GFP (1) Tn7 Genomic insertion-unstable GFP (1) PcdrA::gfp(ASV) PcdrA::gfp Plasmid- stable GFP (1) PcdrA::gfp(ASV) Plasmid-unstable GFP (1) Table 2: Bacterial strains used in this study Strain Description PAO1 ∆wspF Mutant expressing high cPcdrA::gfp (ASV) di-GMP with c-di-GMP reporter; Biofilm forming
Application Positive control for biofilm studies, c-diGMP monitoring
Reference (1)
Mutant expressing high cdi-GMP with c-di-GMP reporter; Non biofilm forming Wild type PAO1 with stable GFP
Positive control for planktonic studies, cdi-GMP monitoring
(1)
Positive control for stable GFP
This study
PAO1 PcdrA::gfp (ASV)
Wild type PAO1 with c-diGMP reporter
This study
PAO1 Tn7-GmeCFP PcdrA::gfp (ASV)
Wild type PAO1 stably expressing CFP with c-diGMP reporter
For dynamic c-diGMP studies in planktonic For c-di-GMP quantification in biofilm.
21
This study
Downloaded from http://www.jbc.org/ by guest on March 24, 2017
PAO1 ΔwspFΔpslBCD ΔpelA PcdrA::gfp (ASV) PAO1 Tn7::gfp
C-di-GMP distribution during biofilm development FIGURE LEGENDS Figure 1: Comparison of different cdrA reporter constructs in P. aeruginosa. Overnight grown, planktonic cultures of P. aeruginosa PAO1 with different versions of the cdrA::gfp reporter construct were compared for fluorescence intensity. Reporter activity was determined based on analysis of confocal images, where the mean intensity was calculated as the total image intensity per cell. Error bars represent the standard deviation (n = 15).
Figure 3: Comparison of c-di-GMP reporter based fluorescence of high c-di-GMP producing mutants versus wild type P. aeruginosa. Confocal images of (A) wild type P. aeruginosa. (B) P. aeruginosa ΔwspF (C) P. aeruginosa ΔwspFΔpslBCDΔpelA (D) Fluorescence intensity per cell. Error bars represent the standard deviation (n = 3). Magnification: 20x. Scale bar: 10 µm. Figure 4: The effect of c-di-GMP modulating compounds on the expression of the PcdrA::gfp (ASV) in P. aeruginosa. Bacteria were grown in 24 well plates in a Tecan plate reader with continuous shaking at 37°C. (A) Optical density (OD600), and (B) fluorescence intensity was measured every 10 min and fluorescence intensity was normalised with the optical density and is presented as relative fluorescence units (RFU). ●, P. aeruginosa ΔwspFΔpslBCDΔpelA PcdrA::gfp (ASV) 125 µM SNP; ■, P. aeruginosa ΔwspFΔpslBCDΔpelA PcdrA::gfp (ASV) 250 µM SNP; ▲, P. aeruginosa PcdrA::gfp (ASV); ▼, P. aeruginosa PcdrA::gfp (ASV) tellurite 20 µg/ml; ◆, P. aeruginosa PcdrA::gfp (ASV) tellurite 50 µg/ml. Representitive data from three biological replicates. Error bars represent the standard deviation (n = 3). Figure 5: Measurement of CFP and GFP signal separately on a P. aeruginosa wild type biofilm undergoing starvation. A-C) Before the start of carbon starvation and D-F) after 30 min of starvation. G) CFP grey values before and after treatment, H) GFP grey values before and after treatment and I) the ratio of GFP/CFP before and after induction of starvation. Figure 6: C-di-GMP reporter PcdrA::gfp (ASV) calibration. Ratiometric image of: (A) planktonic P. aeruginosa PcdrA::gfp (ASV); (B) a biofilm of P. aeruginosa PcdrA::gfp (ASV); (C) a planktonic culture of P. aeruginosa ΔwspF PcdrA::gfp (ASV) and (D) a biofilm of P. aeruginosa ΔwspF PcdrA::gfp (ASV). (E) A comparison of image 22
Downloaded from http://www.jbc.org/ by guest on March 24, 2017
Figure 2: Chromatic aberration analysis. A 6 µm bead expressing cyan and green colours was imaged using the same imaging parameters as that of ratiometric imaging. A) The fluorescent signals in the XY plane showed complete overlap between cyan and blue. B) The chromatic aberration in the YZ dimension was significant, showing non-overlapping cyan and green images. C) Corrected chromatic aberration in the YZ plane, showing overlapping cyan and green images. D) Ratio image created with the non-corrected bead, showing intensity changes as 16 color LUT. E) Ratio image of the corrected bead, showing identical ratios across the entire bead. The white colour represents a ratio of 1 in 16 color LUT.
C-di-GMP distribution during biofilm development quantification versus chemical quantification (F) where the c-di-GMP concentration was plotted versus the average weighted pixel frequency. R-squared value=0.90827, xintercept 0.07099, y-intercept 0.00527 and slope = -0.70655. Magnification 20x. The colour scale represents the c-di-GMP concentration normalised to protein concentration in 16 colour LUT, where white represents approximately 75 pM/µg of protein and black represents 0.38 pM/µg of protein. Planktonic cultures were grown at room temperature in M9-glucose medium in shakeflask for overnight and 2 ml of culture were centrifuged in a Corning® Costar® cell culture plates 24 well, flat ottom at 811 g for 10 min. Confocal images were captured after adjusting the correction ring in the 20x lense for the thickness of the plate.
23
Downloaded from http://www.jbc.org/ by guest on March 24, 2017
Figure 7: C-di-GMP distribution across a developing P. aeruginosa biofilm in a flowcell. (A) Day 2, (B) Day 3, (C) Day 4, (D) Day 5 and (E) Histogram of biofilm development on days 2, 3, 4 and 5. (F) Average weighted pixel intensity as determined by the ratiometric method. The colour scale represents the c-di-GMP concentration normalised to protein concentration, where white represents approximately 75 pM/µg of protein and black represents 0.38 pM/µg of protein. Representitive data from three biological replicates. Error bars represent the standard deviation (n = 3).
C-di-GMP distribution during biofilm development
Downloaded from http://www.jbc.org/ by guest on March 24, 2017
Figure 1.
A
D
B
E 24
C
C-di-GMP distribution during biofilm development Figure 2.
Downloaded from http://www.jbc.org/ by guest on March 24, 2017
Figure 3
A
B
Figure 4
25
C-di-GMP distribution during biofilm development
Downloaded from http://www.jbc.org/ by guest on March 24, 2017
Figure 5
26
C-di-GMP distribution during biofilm development
A
B
! !
!
Figure 6
!
! ! ! ! ! R#Square!value!0.90827!Intercept! 0.07099! Slope! #0.70655! 27 !
!
!!
!
0.00527!
Downloaded from http://www.jbc.org/ by guest on March 24, 2017
!
C-di-GMP distribution during biofilm development
Downloaded from http://www.jbc.org/ by guest on March 24, 2017
Figure 7
28
Real Time, Spatial and Temporal Mapping of the Distribution of c-di-GMP During Biofilm Development Harikrishnan A. S. Nair, Saravanan Periasamy, Yang Liang, Staffan Kjelleberg and Scott A. Rice J. Biol. Chem. published online November 29, 2016
Access the most updated version of this article at doi: 10.1074/jbc.M116.746743 Alerts: • When this article is cited • When a correction for this article is posted Click here to choose from all of JBC's e-mail alerts Downloaded from http://www.jbc.org/ by guest on March 24, 2017
This article cites 0 references, 0 of which can be accessed free at http://www.jbc.org/content/early/2016/11/29/jbc.M116.746743.full.html#ref-list-1