Real-Time UML-based Performance Engineering to Aid Manager’s Decisions in Multi-project Planning A. Bertolino Istituto di Elaborazione dell’Informazione CNR, Pisa, Italy +39 050 3152914
[email protected]
E. Marchetti Istituto di Elaborazione dell’Informazione CNR, Pisa, Italy +39 050 3153467
[email protected]
ABSTRACT We investigate the usage of software performance engineering to aid the project manager in making sound, reliable predictions in software development, and in optimizing the utilization of resources (typically the people). We assimilate the project teams to the processing elements of a performance model, and their activities to the tasks to be accomplished within established time intervals. The proposed methodology uses as the manager’s interface a subset of Real-Time UML, the recently adopted OMG standard specialized profile for addressing schedulability, performance and timeliness. To illustrate the approach, we model the case of a manager that must decide a release date for a product undergoing the testing phase. We show how by means of basic performance analyses, different workflow assumptions can be explored and their consequent outcomes automatically derived: by looking at the analysis results, the manager can thus take an informed, more responsible decision.
Keywords Product Release, Project Management, Real-Time UML, Software Performance Engineering.
1. INTRODUCTION From the more traditional application fields of hardware devices and computer systems, performance analysis gathers today growing interest also in software engineering, to model and estimate the QoS (quality of service) requirements of software systems. Our study concerns the application of performance engineering techniques to a related, yet different, field: the management of people and tasks during the software development process. All along software development, project managers are faced with difficult decisions. Typically, for instance, managers are in charge to judge whether the resources assigned to a specified task are adequate or whether under the existing organizational
R. Mirandola Dip. Informatica, S& P Università di Roma TorVergata Roma, Italy +39 06 72597381
[email protected]
schemes the predicted time schedules will be met. Making such assessments is very difficult, because the involved processes are highly complex: the influencing factors (both human and technical in kind) are many, and in most cases not easily measurable or predictable. Therefore, for taking the most appropriate resolutions, the manager’s matured skill and experience remain crucial and irreplaceable. However, it is our belief that modeling aids and analysis tools can make the manager’s task easier. There exist very different kinds of support tools for project management. They span from just simple graphical notations for modeling the flow of activities, such as the Gannt Charts, to quite sophisticated mathematical tools, that can predict, by analysis or simulation, the outcomes deriving from the manager’s hypotheses about the resources involved and the events flow. Our research addresses in particular the usage of Software Performance Engineering (SPE) to aid project managers. We believe in fact that, bypassing the classical application domain of computers operation, SPE techniques and tools can play an important role also in the framework of project management. At the basis of our study is the metaphor that project teams can be assimilated to the processing elements of performance models, and the development activities to the tasks to be performed by the processing elements within established time intervals. Following this metaphor, well known techniques from performance analysis can be usefully adapted to the purposes of assessing the time to completion of specified tasks, handling personnel multitasking over different projects, optimizing the workloads in development cycles, deciding about products release, and similar managerial issues. Among the advantages of using SPE for management, we highlight the capability to handle multiple projects and their mutual interfering in schedule and resources usage. Also of relevance is the soundness of the predictions provided by SPE tools, that can rely on a solid mathematical background and have a statistical validity. Clearly, performance techniques can provide the necessary analytical support, but the role of manager’s expertise remain essential for tuning the input models with the proper parameters values. The idea of using performance techniques for management actually is not completely new (as we notice in Section 6). However much work remains to be done, especially towards facilitating the practical and effective deployment of SPE techniques by managers, that, as universally known, are too busy to see favorably the adoption of novel technologies.
In this respect, we have identified two crucial directions for our research: on one side, we need to consider several trial applications and develop the relative performance models, so that blueprints for various plausible contexts in project management are already on hand. We have developed one possible application in [2] concerning a waterfall development process, another scenario is proposed in this paper to support the decision of releasing a product based on the management of trouble reports, and a more general case study encompassing the modeling of the Rational Unified Process (RUP) [10] is currently under study. On the other side, we need to equip the proposed methodology with an interface that appears familiar to managers. We aim at building a setting in which managers develop a model of the flow of activities and of tasks distribution, using notations and tools they normally use, and then a tool automatically translates the model in a format that is processable by performance analysis algorithms. We do not want to require that managers become knowledgeable of performance techniques, usually "perceived as difficult and time consuming" by software engineers [14]. In particular, we have adopted as the input modeling notation the Unified Modeling Language (UML) [17], [26]. UML is becoming the standard notation for analysis, design and implementation of object oriented systems, and is widely used in industry. Performance modeling of computer systems by means of UML diagrams has already been proposed in the literature [5], [14]. However, the modeling diagrams did not comply with the standard UML notation. So, on one side a widely used language is proposed; on the other managers are required to use it in a not standard way in order to be able to handle timing and resources in quantitative way. This contradiction could eventually get the opposite result than the intended one of facilitating the adoption of our methodology by managers. Fortunately, a specialized UML profile with extensions that can handle real time requirements has been recently introduced and adopted as an OMG standard, i.e., RT-UML [18]. RT-UML includes standard methods for UML-compliant modeling of timing aspects, such as physical time, timing specifications, timing services and mechanisms; for modeling resources (logical and physical), concurrency and scheduling, software and hardware infrastructures and their mappings, and allows for the introduction of more specialized notations where necessary. Therefore, the natural evolution of our methodology is to customise the methodology proposed in [5], [14] to adopt the standard RT-UML profile as the input modeling notation.
1.1 Paper structure The main contribution of this paper is the usage of the Real-Time UML profile for the performance modeling of project management contexts. RT-UML is briefly introduced in the next section. As an illustrative example, we consider a case study of a manager that must decide whether a product is ready to be released based on the status of the trouble reports compiled during the test and debug phase. The case study is described in Section 3. In Section 4 we illustrate the methodology and in Section 5 present an analysis of the obtained results for the case study
examined. Related work and Conclusions follow in Sections 6 and 7, respectively.
2. REAL-TIME UML Assuming that the reader is familiar with the standard UML notation (see, e.g., [17]), in this section we introduce the RealTime UML profile, and then briefly describe the specific RTUML extensions that we use in this paper. The Unified Modeling Language (UML) is generally recognized as a very useful tool for modeling the functional characteristics of a system (e.g., see papers in [23], [24]). However, several important system requirements such as response time, availability, throughput and bandwidth cannot be expressed functionally. These are often referred to in abstract as the QoS (quality of service) characteristics. Historically, UML had ignored non-functional requirements, and by general consensus the lack of a quantifiable notion of time and resources was felt as “an impediment to its broader use in the realtime and embedded domain” [18]. In 1999, to cope with the needs from this key area, the Object Management Group (OMG) issued an explicit request for proposals1 (RFP) for a UML domainspecific interpretation (fully conformant with the UML standard) capable to deal with non-functional requirements. The UML Profile for Schedulability, Performance and Time (RTUML) has been proposed as a response to this RFP by a working consortium of OMG member companies, and has been recently adopted as an OMG standard (September 2001 after two revisions). RT-UML is not an extension to the UML metamodel, but a set of domain profiles for UML allowing for the construction of models that can be used to make (early in the life cycle) quantitative predictions regarding the characteristics of timeliness, schedulability, and performance [18]. The RT-UML profile was not conceived for a specific analysis method, but is intended to provide a single unifying framework encompassing the existing analysis methods, still leaving enough flexibility for different specializations. Basically, the underlying idea is to import as annotations in the UML models the characteristics relative to the target domain viewpoint (performance, real-time, schedulability, concurrency), in such a way that various (existing and future) analysis techniques can usefully exploit the provided features. The overall structure of RT-UML is modularized so to allow system designers and developers to only use those elements of the profile that they need, and to consent future extensions. The profile is in fact partitioned into a number of sub-profiles, i.e., “profile packages dedicated to specific aspects and analysis techniques”. At the core of the profile is the general resource modeling framework, itself consisting of three sub-profiles dealing respectively with resource modeling, concurrency and time-specific concepts. Then, based on this common framework, more specific sub-profiles are defined. Here we focus on the performance analysis (PA) profile. A performance context specifies one or more scenarios, i.e., ordered sequences of steps, describing various dynamic situations 1
OMG document number: ad/99-03-13
involving the usage of a specified set of both processing and passive resources under specified workloads (i.e., the load intensity and the required or estimated response times for the scenario). A scenario might involve multiple concurrent threads due to forking whithin a scenario. The RT-UML PA sub-profile provides UML extensions to deal with the above notions of scenarios, resources, and workloads and the associated attributes (in the following, PA attributes), so to allow for extensive and wide-ranging performance analyses. In our methodology, we are actually interested only on a small subset of these extensions. In particular, PA scenarios can be modeled following either a Collaboration-based approach or and Activity-based approach. In the tradition of [5], [14], we take here the former approach, and represent a scenario by an annotated Sequence Diagram. In the future, we also intend to investigate the usage of activity graphs, which might present some advantages in expressiveness [18]. The subset of PA annotations we deal with concerns the workload, the steps and the resources involved in the considered scenario. Specifically, we consider a closed workload, where a fixed number of jobs remain indefinitely in the scenario, characterized by its size and by its response time (PA attributes: PApopulation and PAresptime, respectively). The main characteristics of a step we take into account are the number of times it is repeated, and its service demand (i.e., the request to be accomplished) on the host resource (PA attributes: PArep and PAdemand, respectively). Finally, for the involved resources, we are interested in modeling the resource scheduling policy; the possibility of service preemption; a relative speed factor with respect to a normative resource, and the percentage of resource utilization (PA attributes: PASchdPolicy, PApreemptable, PArate and PAutilization, respectively). The numerical values associated to the PA attributes may have different meanings; for example, they may represent a fixed value, a variable to be estimated, an average value or a distribution, or else they may be a prediction, a measure or a requirement. To model PA value semantics, RT-UML follows a predefined syntax [18], whereby it is possible to specify all the desired characteristics (for an example application see Section 4).
3. CASE STUDY The proposed methodology can be useful at any stage of development, when the project manager is called to dynamically take the most appropriate decision based on the actual project status and the emerging circumstances. SPE techniques can help to predict the outcomes that will result from manager’s assumptions and to early figure out whether under the current workflow the settled objectives will be met. In particular, the case study we investigate here concerns the release decision for a software product. The factors that influence this decision can be many, including marketing exigencies, timing constraints, or quality requirements. Here we consider that the release follows a test and debug phase, and that the decision is primarily driven by the product quality, measured in terms of found bugs. More precisely, we suppose that as usual the testers report each failure found during the test execution in a form, called the trouble report, and that the product will be released only after the testing is completed with no trouble report left open.
We consider that at the beginning of the test phase, the manager wants to early predict the expected time to release. The presented case study is derived from [8], to which we refer for major detail. As a first step we model the organization structure of the company considering the testing stage and the management of reported problems (we disregard the teams not directly involved in these activities). The organization is composed by a project manager PM, a test team T (1÷3 people), a development team D (2÷4 people), the system architects AR (1÷2 people). The testers start to execute the planned test cases and every few days (we assume 3 in this example), they insert the trouble reports in an on-line database, called the tracking system TS, which only the testers and the project manager can modify. At each TS update, the PM analyses the trouble reports and takes the proper resolution for each problem. We consider three possible outcomes from his/her analysis: •
The problem must be fixed: the PM classifies the problem as “open” and passes it on to the developers. In this case study for simplicity we assume no prioritization politics among failures, i.e., all reported problems are assigned the same severity (different priorities could also be handled, but the example would be more complicated)
•
The problem can be deferred. The PM chooses to leave the problem in the current version of the product and to do the fix in a subsequent release. The problem is classified as “deferred”.
•
The problem is not recognized as such. From the trouble report analysis the PM concludes that it is not a real problem, because the program was actually supposed to work in that way. The problem is classified as “as designed”.
The TS update with the problem classification as “deferred” or “as designed” by the PM closes the trouble report (at least for this product release). If instead the problem is classified as “open”, further actions must be taken as exemplified below. On receiving the open problem reports from the PM, the developers first analyze them to check whether they have enough information to fix the problems or need further explanation about the failure symptoms from the testers. In the latter case, the workflow may include an interaction cycle with the testers. Occasionally, the developers may realize that the fix requires a major design change and inform so the PM, who may require the intervention of the software architects to modify the design, after which the developers modify the code accordingly. After every problem fix, the testers have to retest the modified parts of the program (regression test). They hence either classify the problem as “closed”, updating consequently the associated trouble report in the TS, or possibly generate further trouble reports containing the new problems found during the test phase. Given this rough model of the activities and personnel involved, the project manager periodically analyzes the status of the TS and estimates the expected time at which the product can be released, that is when the TS only contains problem reports classified as “deferred” or “as designed”, i.e. there are not remaining “open” problems.
If the estimated release time is too late, for example with respect to the agreed date with the customer, the PM has to take the proper corrective actions. For instance, the PM could increase the number of people involved in the development or in the test phase or else decide to negotiate a later release date. Alternatively, if more projects are being handled contemporaneously by the involved personnel, the PM could decide to temporarily divert the people from one or more of the concurrent projects to accelerate this one. In such situations, it is very important that the PM can base his/her resolution on a reliable estimate, not on a subjective guess, and that he/she can objectively take into account all the likely combinations of events. This is the purpose of the methodology presented in the following section: we intend to supply the project manager with a tool that uses SPE techniques to: •
predict the release time, also allowing for multi-projects management, i.e., the teams are not dedicated full time to a single project
•
evidence the component that represents the bottleneck and is responsible of the release time delay
•
identify the most convenient teams composition in order to ensure the all the projects are released within the deadline.
4. THE METHODOLOGY As stated in the introduction, the objective of this research work is to propose sound, reliable solutions to support the manager’s decisional process in multi-project management. Our proposal is to apply for this purpose well-known techniques from the field of computer performance engineering, such as Software Performance Engineering (SPE) [19], [20] and queueing networks models [12]. Queuing networks, in fact, are the largest widespread method in performance field.2
completely specified, it can be analysed by use of classical solution techniques (simulation, analytical technique, hybrid simulation [12]) to obtain performance indices such as the mean network response time or the utilization index. We adapt here performance analysis methods to the purpose of handling personnel multitasking and of optimizing workloads in software project management. We follow the metaphor that project teams correspond to the processing resources in performance models, and project activities are the tasks to be performed within established time intervals. Using the above SPE concepts, the SM captures the aspects relative to the activity planning, while the MM the ones relative to people (over/under) utilization and distribution. In particular, we apply a method proposed in [5], [14] for the derivation of performance models based on SPE techniques, starting from a set of UML diagrams. The SM is thus derived from a Sequence Diagram SD, and the MM from a Deployment Diagram DD. The method then extracts from these diagrams the main factors affecting system performance and combines them to generate a performance model. The method, in its original conception, used the standard UML diagrams, with simple ad hoc annotations. We here introduce an improved version of that method, that relies on the standardised RT-UML profile, to which the derived SD and DD fully comply. Let us outline the steps to be performed (and who is in charge of each of them) to derive a queueing network based model of a software project stage. 1. Manager: analysis In this step the manager should estimate the basic activity steps, the number and role of people involved, the time necessary for completing the different steps and the resources available3. 2. Manager: modelling The analysis results from step 1 have to be modelled by use of RT-UML diagrams. In particular, a Sequence Diagrams models the project activities and a Deployment Diagram models the resources available and their characteristics.
The SPE basic concept is the separation of the software model (SM) from its execution environment model (i.e., hardware platform model or machinery model, MM). The SM captures the essential aspects of software behavior; we represent it by means of Execution Graphs (EG). An EG is a graph whose nodes represent software workload components and whose edges represent transfers of control. Each node is weighted by use of a demand vector that represents the resource usage of the node (i.e., the demand for each resource).
3. Automatic: SPE models generation By applying the method proposed in [5], that quite naturally suits to the RT-UML diagrams, it is possible to derive a model for the planned activity (the SM based on EG) and a model for the involved teams and resources (the MM based on EQNM).
The MM models the hardware platform and is based on the Extended Queueing Network Model (EQNM) [12]. To specify an EQNM, we need to define: the components (i.e., service centers), the topology (i.e., the connections among centers) and some relevant parameters (such as job classes, job routing among centers, scheduling discipline at service centers, service demand at service centers). Component and topology specification is performed according to the system description, while parameters specification is obtained from information derived by EGs and from knowledge of resource capabilities. Once the EQNM is
4.
Automatic: model evaluation The EQNM obtained in the previous step, which represents both the teams and the activities, can be solved to obtain results such as the completion time for the project (or for a single phase) and the resource utilization.
5.
Manager: analysis of results
2
The results presented in this paper could anyway be obtained via the application of other used approaches, like Petri nets, LQNs or process algebras, by applying the appropriate transformation rules [23], [24], [25] from the UML diagrams to these notations.
3
Note that this is a classical manager duty and not a specific request of the proposed method.
The results obtained in step 4 are analysed by the PM and, if different from those expected (or desired), he/she can go back to step 1 (or 2), make some modifications to
: Tracking System
: Program Manager
the settled parameters, and repeat the process until the desired results are obtained. Let us consider for each step the method application to the case study described in Section 3.
: Tester Team
: Development Team
: Architects
1. Software to test 1.1. Problem Report {PApopulation=NUsers PAresptime('msr',’mean',$t_to_release)}
2. Problem Request {PArep=Nrep PAdemand=('req','mean',ts)} 2.1. Data
{PArep=Nrep PAdemand=('req', 'mean',ts)}
{PAdemand=('req', 'mean', t_def_PM*$N*p_def)} 3. Bug Deferred {PAdemand=('req', 'mean', t_as_des_PM*$N*p_as_des)} 4. Bug as designed
{PAdemand=('req', 'mean', t_fix_PM*$N*p_fix)} 5. Bug to fix
5.1. Regression Test
{PAdemand=('req','mean', t_fix_DV*$N*p_fix)}
5.1.1. Problem Report Closure {PAdemand=('req','mean', t_fix_T*$N*p_fix)}
6. Bug to fix 6.1. info request 6.1.1. info
6.2. Regression Test 6.2.1. Problem Report Closure 7. Bug to fix
7.1. Bug Fix Review
7.1.1. Design Review
7.1.1.1. Design Implement 7.1.1.1.1. Regression Test 7.1.1.1.1.1. Problem ReportClosure
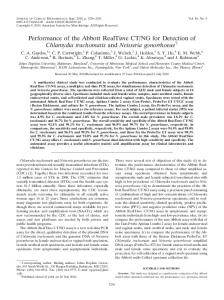
Figure 1: Sequence Diagram
Analysis: Several involved boundary conditions (number of resources, strategy for project realease, etc.) have already been established; some other are left undefined as parameters (symbolic expression) to be estimated in steps 4 and 5.
{PAschedPolicy=FIFO PArate=1 PAutilization=$util PActx tSwT=('est‘,'mean',1,‘ms')}
:TS
{PAschedPolicy=FIFO PArate=1 PAutilization=$util}
:PM
Modeling: The performed choices lead to the generation of the SD and the DD described in Figure 1: and Figure 2:, where several stereotypes and tagged values of RT-UML and described in Section 2 have been used.
:Intranet
:T
:D
:A
{PA s chedPolic y= FIFO PApreemtable=ye s P A rate = 1 PAutilization=$ut il}
{PAschedPolicy=FIFO PArate=1 PAutilization=$util} :Meeting {PAschedPolicy=FIFO PArate=1 PAutilization=$util}
Room
{PAschedPolicy=FIFO PArate=1 PAutilization=$util}
{PAschedPolicy=PS PArate=1 PAutilization=$util}
Figure 2: Deployment Diagram In particular, the SD (Fig. X) models the testing phase activities as illustrated in Section 3. For example, the workload in the scenario is modelled by associating, to the first scenario step, the stereotype PAclosedLoad with attributes PApopulation (modeling the number of jobs in the scenario), which is a variable equal to $Nuser, and Paresptime, which is an expected analysis results, modeled as a measured (‘msr’) distribution whose required mean is expressed as $t_to_release.
for instance, the Intranet to access the database TS and a meeting room symbolizing a “communication channel” among different teams. Each node represents a kind of resource and to model its main features we associate to each resource a stereotype PAhost with attributes: PaschdPolicy, modeling the service discipline equal to FIFO (First In First Out), PS (Processor Sharing) or PR (pre-empt-resume), PApreemptable with value Yes, and PAutilization, to be estimated as an analysis result, equal to $Util.
When the PM analyses the trouble report containing a variable number of bugs ($N), with a given probability (p_def) the bugs are deferred and the PM deals with this case in a time which is proportional to the number of deferred bugs. This is simply modeled by associating to the relative step the stereotipe PAstep with attribute PAdemand as a required (‘req’) distribution whose mean is given by t_def_PM*$N*p_def.
SPE model generation: Figures 3 and 4 illustrate the EGs obtained from figures 1 and 2, while Figure 5 shows the EQNM.
The DD models the organization structure of the company as described in Section 3. In this case, the DD nodes can refer to both classical resources (device, processor, database) and people teams. Moreover, the DD models also the communication nodes:
With respect to the SD and the DD, in this step we have made the following choices: i) the database TS and the connected Intranet have not been modelled, because the times involved in the TS accesses are order of magnitude less than the times required by the activity steps (msec vs days); ii) the meeting room has been considered simply as a delay center modeling the communications with the manager.
Figure 3 represents an EG at a high level of abstraction modeling the main activities of the testing phase without details, while Figure 4 shows the details of the block named “problem analysis”, by illustrating several activities modeled in Figure 1. Moreover, the demand vector for each block is derived by combining information coming from annotations in the SD and in the DD.
For example, the first block is called “3+4” because it models the interactions 3 and 4 in the SD; its associated demand vector represents the service demand to the resources involved in the scenario for the management of bugs that are deferred or classified “as designed”. In such a case only the manager is involved and his/her service demand can be derived from the annotated SD as (t_def_PM* $N*p_def + t_as_des_PM*$N*p_as_des).
start
An example of a possible EQNM, modeling resources and activity, is illustrated in figure 5, for an organization structure consisting of 1 PM, 1 T, 2 DV, 1 SA.
Test 3 days
Test 3/6 days
Note that the different kind of projects (depending, for example, on the the test duration or on the number of bugs) generate different instances of the demand vectors for the EGs in Figures 3 and 4, and therefore different routing chains in the EQNM. The possible choices lead to generate different models to be evaluated in the next step.
Problem analysis
Model evaluation: several analysis can be done by assigning different values to parameters in the EQNM. Examples of various model evaluations are illustrated in the next Section.
Problem analysis end
Analysis of results: the manager can make several kinds of decision by analysing the results obtained in the previous step, an example of this kind of results analysis is illustrated in the next section.
Figure 3: The high level EG obtained from SD in Figure 1
Demand vector:
Problem analysis: details
(d_PM, d_DV, d_T, d_SA, d_MR) 3+4
5 + 5.1+5.1.1
6
(t_def_PM* $N*p_def + t_as_des_PM*$N*p_as_des, 0, 0, 0,0) (t_fix1_PM* $N*p_fix1, t_fix1_DV* $N*p_fix1, t_fix1_T*$N*p_fix1, 0, t_MR)
(t_fix2_PM* $N*p_fix2, 0, 0, 0,0)
(0, t_fix2_DV* $N*p_fix2, 0,0,0)
(0, 0, t2_T* $N*p_fix2*p_T, 0,0) 6.2
6.1.1
6.2.1
7+7.1+7.1.1+ 7.1.1.1+ 7.1.1.1.1+ 7.1.1.1.1.1
(0, 0, t_fix2_T*$N*p_fix2, 0,t_MR)
(t_fix3_PM* $N*p_fix3 + t 3_PM* p_fix3, t_fix3_DV* $N*p_fix3 + t3_DV*p_fix3 , t_fix3_T* p_fix3, t_fix3_SA*p_fix3, t_MR)
Figure 4: The low level EG for “problem analysis” block obtained from SD in Figure 1
(plus of course the manager): this configuration is denoted as T1, D2, SA1, PM1;
SA
§ PM DV
DV MR
TS
Figure 5: The EQN Model obtained from SD in Figure 1 and from DD in Figure 2
5. ANALYSIS OF RESULTS We now illustrate how the above methodology can support the manager’s decisional process. Before, it is important to point out that on the manager’s side the only effort required to employ the methodology is to explicitly derive in a SD such as the one shown in Figure 1 a high level model of the workflow of the ongoing activities and in a DD (see Figure 2) the organization structure. He/she does not need to know all the other details given above on how such models are translated into SPE models and evaluated. Even the derivation of the RT-UML diagrams could be felt at first impact as an undesirable extra burden for the already overloaded manager. However it is not objectively a lot of effort: if one has a clear view (as plausibly the manager must have) of how the process is structured and of which are the activities to accomplish and their mutual influences, deriving the RT-UML diagrams that depict them at a high level of detail should not take much, especially with the support of an appropriate interactive tool. Besides, we expect that the returns make it worthwhile. In fact, once such diagrams have been derived, various interesting analyses can be conducted in completely automated way. The manager can make any different assumptions for the parameters of the derived model and obtain immediately a reliable prediction of what will be the outcomes consequent to each single assumption. Generally for each model there will be many parameters that can be varied. For the case study of the release decision, for instance, we have considered the following ones: the estimated duration of the test period, the number of registered trouble reports, the composition of the involved teams, and whether they are fully dedicated to the examined project or instead are contemporaneously handling other projects. Let us consider as a first example the following assumptions: §
the planned duration for the test phase of a given product is six days;
§
the personnel in charge for the test and debug phase consists of one tester, two developers and one software architect
the tester and the two developers are at the same time engaged in another project.
We figure out that before the test phase starts the manager wants an estimate of the release date. Assuming as a first guess that 10 trouble reports are issued, the SPE analysis estimates that on average the product will be ready for release (i.e., no more open trouble reports exist) after 17 days from the start of the test phase. If the manager had committed for an earlier release deadline, say in 12 days, it is unlikely that he/she will be able to meet it. Even considering the more optimistic hypothesis that only 2 bugs are encountered, in the present configuration the release time would not be shorter than 14 days. Thus, either the manager negotiates a more realistic deadline, or he/she takes some countermeasure. One obvious possibility is to add more personnel: using our methodology, revising the estimates is immediate. We change the parameters configuration, and re-obtain the release time estimates. If for instance one more tester is added, the product would be ready in 12 days with 2 bugs, but in 15 days with 10 bugs: this could not be sufficient. If the project under exam has high priority, another possible countermeasure could be to take away from the other parallel project the resources that are necessary to complete this one. If the tester and the two developers are fully dedicated to this project, than the predicted release time with 10 bugs is reduced to 12 days, which was the target deadline. Thus, by means of simple SPE analyses, the manager gets statistical predictions that can support his/her decisional process. Another interesting parameter is the rate of utilization of the human resources. This analysis can be very useful not only to better administrate the human resources, but also to identify which are the bottlenecks when a phase takes too long. In the initial configuration we assumed of one tester and two developers, employed in this and in another project, we can see that the bottleneck is clearly the tester, as the utilization rate is computed as 99%, while the two developers are well employed, with a rate of 55%. Deciding to fully dedicate one tester and two developers to the test and debug phase allows the manager to meet the deadline, but in such a configuration the developers are underutilized, at 29%. One further possibility to explore could be to devote full time one tester, while leaving the two developers on both projects. In such configuration we would get a release period of 13 days, but the resources are better employed (46% the tester and 58% the two developers). Another interesting fact to observe is that although obviously the duration of the test and debug process can be highly influenced by the number of bugs found, a rational organization of the personnel can be even more crucial, especially for large enterprises dealing with more development processes in parallel. We can observe in fact from the analysis results that the release delay increases faster as the teams get involved in more contemporaneous projects than if we increase the estimated number of bugs. For instance, considering a large product with a planned test period of 9 days, and a configuration of 1 tester, 2 developers, 1 software architect and the manager, when all these resources are completely dedicated the expected time to release, even foreseeing 20 bugs, is 18 days, against the 20 days estimated to handle half (i.e., 10)
bugs if the tester and the developers are contemporaneously employed in another project. If we further consider a configuration in which the tester and the developers are handling three more projects, even though in this project we optimistically assume to find only 2 bugs, handling them would take 28 days.
planned duration for the test and debug phase is three, six or nine days (with a group of four columns for each case), and when 2, or 10, or 20 trouble reports are issued, as indicated in each row. For each case, then, we derive the estimate when the resources (the people) are fully dedicated to the project under exam (denoted as 1-0-0); the test team is fully dedicated, while the developers are handling this and another project (1-0-1); both the testers and the developers are handling this and another project (1-1-1), and finally both the testers and the developers are handling three more projects in addition to this one (1-3-3).
To further illustrate the obtained results, we report in Table 1 below the estimated time to release measured in days (one working day has been considered equal to 8 hours, and the results shown are rounded to the closest integer). We considered two alternative configurations: T1, D2, SA1 and T2, D2, SA1 (i.e., one tester, two developers and one software architect or two testers, two developers and one software architect, plus in either case of course the PM). We investigate the release time when the
In Table 2 we report the utilization rate resulting for the testers and the developers in each considered configuration.
Table 1. Estimated time to release in days Planned Test Duration=3 days
T1 D2 SA1 T2 D2 SA1
Planned Test Duration=6 days
Planned Test Duration=9 days
Proj #Bugs
1-0-0
1-0-1
1-1-1
1-3-3
1-0-0
1-0-1
1-1-1
1-3-3
1-0-0
1-0-1
1-1-1
1-3-3
2
5
6
8
13
8
10
14
25
11
13
17
28
10
9
10
11
17
12
13
17
29
14
16
20
31
20
14
15
16
22
16
18
22
32
18
20
24
35
2
5
6
6
10
8
10
12
19
11
13
14
22
10
9
110
11
14
11
13
15
22
14
15
17
24
20
14
16
16
20
16
17
20
27
18
19
21
28
Table 2. Utilization rate of testers and developers Planned Test Duration=3 days
T1 D2 SA1 T2 D2 SA1
1-0-0
1-0-1
1-1-1
Planned Test Duration=6 days
1-3-3
1-0-0
1-0-1
1-1-1
Planned Test Duration=9 days
1-3-3
1-0-0
1-0-1
1-1-1
1-3-3
Proj #Bugs
T
D
T
D
T
D
T
T
D
T
D
T
D
T
D
T
D
T
D
T
D
T
D
2
21
23
15
59
99
55
100
77
66
10
50
56
99
53
100
76
79
70
65
54
99
52
100
75
D
10
29
29
25
57
99
56
100
74
56
29
46
58
99
55
100
76
69
16
59
56
99
54
100
76
20
31
31
28
55
99
55
100
73
49
30
46
56
99
55
100
74
69
23
56
55
99
55
100
76
2
12
24
7
59
55
58
76
77
37
10
26
29
55
55
74
75
40
70
34
54
55
54
70
76
10
14
29
13
57
55
56
76
75
30
22
24
31
56
56
75
75
36
17
33
56
56
55
72
76
20
15
30
14
55
54
55
75
70
26
27
22
31
56
57
74
74
33
24
28
55
56
55
74
74
6. RELATED WORK A voluminous literature about project management and development can be found in the last years, but little of it treats the problem of multiproject development planning and people multitasking on several contemporaneous projects. We report here a brief survey of both the previous related studies (we refer to [9] for a more complete review of the literature) and the more diffuse (decisional ) tools. Related studies
Two crucial aspects of project management are resources distribution and activity planning during the software development. These issues belong to a more general research field that is Concurrent Engineering (CE) [21]. This discipline became popular with the studies of Imai et al. [7] and Takeuchi and Nonaka [22] and has changed both the academic and the industrial approach to the product development process. However, these works focus mainly in organizing the tasks in a single project, considering in particular the decomposition of a complex product design into smaller activities and their subsequent coordination. On the other hand, considering the distribution of resources in a multiproject environment, PERT (Project Evaluation and Review
Technique) and CPM (Critical Path Methods) [6] are probably the first proposed methods. They describe an idealized flow of project activities, in which no new project is introduced over time and activity times are treated as deterministic. Markov chain models [9], [27], which assume activity time exponentially distributed and use matrix methods for deciding the task time order in development [3], were the natural subsequential evolutions. Personnel organization and resources distribution among several developed project at the same time is instead the problem studied by Adler et al. [1]. The authors put the attention on five basic process elements: jobs, tasks, procedure constraints, resources, and flow management control. In particular, a single process may need to handle a variety of job types, that in turn are divided in tasks (i.e., activities or operations). Tasks are connected by precedence relations. The resources are engineers and technicians and they are the units that execute the tasks. The flow management control represents how the resources executed a job’s constituent tasks. Lock [13] identifies a sixth element consisting of the assessment of individual contributions. The work presented here is related to Adler et al.’s [1]. These authors in fact use queueing networks and stochastic processing network models to represent product development and identify it’s the bottlenecks in task scheduling. Decisional tools To make a realistic planning, managers need to consider the current workloads of human resources and take the most appropriate decisions for meeting the project deadlines. The decisional support they can use generally is of two kinds. One consists of traditional techniques, like Control Charts or Gannt Charts [3]], that visualize resources and personnel and distribute them among the phases of project development. Tools oftentimes support these methods, which are extremely intuitive, but generally the validity of the plans depends strictly on the subjective skill of the managers. Besides, the use of these techniques in a multiproject context could be rather difficult. The second kind of decisional support consists of specialized tools for managers, like Microsoft Project tool [28] or the Kerzner Project Management Maturity Online Assessment tool [29]. These provide a valid help for maintaining an updated database of the available people and resources, and for producing and visualizing a project plan. However, most tools consider only a specific aspect of management, focusing for example either on the completion time or on the personnel distribution and, more importantly, they cannot explicitly manage several contemporaneous projects. Finally, the majority of available tools apply ad hoc algorithms for simulating the project evolution, based on some parameters values introduced by the user. Some of those tools generate approximate predictions without any guarantee of statistical significance.
7. CONCLUSIONS We have discussed the usage of classical SPE techniques to support the management of people and workflows in software processes. The SPE models are derived from RT-UML diagrams that model the flow of activities and the structure of the enterprise organization. Precisely, we used a Sequence Diagram for the former and a Deployment Diagram for the latter. We have illustrated in a case study encompassing the test and debug phase how the proposed methodology could be of help to a
manager for establishing a reliable release date avoiding over or under utilization of personnel. To use the methodology only the knowledge of a small subset of the RT-UML profile is requested on the manager’s side, and a small effort to develop the two diagrams. All the necessary transformations and desired analyses can then be conducted in automated way by SPE tools. It must also be considered that the diagrams have not to be rederived from scratch at each application of the methodology. It is in fact plausible to hypothesize that the processes that govern the various phases of development in the company are standardized and do not change completely at each new project. Therefore, after an initial investment to model the various stages of the development process in use, at each next application of the methodology the manager can only need to tune the parameters, or in the worst case to make some update to the existing diagrams. Our future work will include the investigation of further utilities of the RT-UML profile, such as for instance the usage of activity diagrams instead of the sequence diagrams; the development of more case studies, in particular we have started to investigate the model of the whole RUP (Rational Unified Process); finally, of course we are still working on the automation of RT-UML based SPE. A tool that translates the RT-UML diagrams in a format that is processable by SPE tools is currently under development. The transformation method relies on an earlier existing method RIF that used the standard UML notation with ad hoc annotations. Here we have adapted that method to deal with the standard RTUML profile.
8. REFERENCES [1] Adler. P., S., Mandelbaum, A., Nguyen, V., Schwerer, E. From Project to Process Management: An Empirically Based Framework for Analyzing Product Development Time. Management Science, Vol. 42, 1995, 458-484. [2] Basanieri F., Bertolino A., Marchetti, E., Mirandola, R. Automating the Management of Teams and Tasks in Software Multiprojects using UML and Queueing Networks. Technical Report, IEI-TR 17-2001, April 2001. [3] Burr, A. and Owen, M. Statistical Method for Software Quality: Using Metrics for Process Improvement. Int. Thomson Computer Press, 1996. [4] Black, T., A., Fine, C., H., and Sachs, E., M., A Method for Systems Design Using Precedence Relationships: An Application to Automotive Brake Systems. M.I.T. Sloan School of Management, Cambridge, MA, Working Paper no. 3208, 1990. [5] Cortellessa, V. and Mirandola, R. Deriving a Queueing Network based Performance Model from UML Diagrams in Proc. WOSP2000 (Ottawa Canada, September 2000), 58-70. [6] Dean, B., V., Project Management: Methods and Studies, North-Holland, Amsterdam 1985. [7] Imai, K., Nonaka, I., Takeuchi, H. Managing the New Product Development Process: How the Japanese Companies Learn an Unleran in Clark, K., b., Hayes, R., H., Lorenz, C. (eds.). The uneasy Alliance. Harvard Businnes School Press, Boston, 1985. [8] Kaner, C., Falk, J. Nguyen, H.Q., Testing Computer Software, Wiley & Sons, 1999.
[9] Krishnan, V., Ulrich, K., T., Product Development Decisions :A Review of the Literature Management Science, (Vol. 47, 2001), 1-21 [10] Kruchten, P. The Rational Unified Process: An Introduction. Addison-Wesley, 1998. [11] Kulkarni, V., G., Adlakha, V.,G. Markov an MorkovRegenerative PERT Networks Oper. Res. (1986) Vol. 34, 769781. [12] Lavenberg S.S. Computer Performance Modeling Handbook (New York, 1983), Academic Press. [13] Loch, C. H.: Operations Management and Reengineering, European Management Journal (Vol.16, 1998), 306 – 317. [14] Mirandola R., Cortellessa V. UML based Performance Modeling of Distributed Systems in Proc. UML2000 (York UK, October 2000) LNCS 1939, Springer Verlag, 2000. [15] Pooley R., Software Engineering and Performance: A Roadmap, (in Finkelstein A. ed.) The Future of Software Engineering, 22nd ICSE. [16] Putnam L.H., Mayers W. Mesaures for Exellence: Reliable Software on Time, within Budget, (Englewood Cliffs, New Jersey, 1992) Yourdon Press Computing Series. [17] Rumbaugh J., Jacobson I., Booch J. The Unified Modeling Language Reference Manual (1999) Addison Wesley. [18] Selic B. “Response to the OMG RFP for Schedulability, Performance and Time” OMG document Ad/2001-06-14. [19] Smith, C.U. Performance Engineering of Software Systems. Addison-Wesley, Reading, (MA, 1990).
[20] Smith, C.U. and L. Williams. Performance Solutions, Addison-Wesley, 2001. [21] Smith, R., The Historical Roots of Cuncurrent Engineering Fundamentals. IEEE Transaction on Engineering Mangement (Vol. 43, 1997), 67-78. [22] Takeuchi, H., Nonaka, I., The New Product Development Game. Harvard Businnes Review (vol.64, 1986), 137-146. [23] The Unified Modeling Language, Advancing the standard, Proceedings of Third International Conference (A. Evans, S. Kent, B. Selic, Eds.), York, UK, October 2000, LNCS 1939 [24] The Unified Modeling Language, Modeling Languages, Concepts and Tools, Proceedings of Fourth International Conference (M. Gogolla, C. Kobryn Eds.), Toronto, Canada, October 2001, LNCS 2185. [25] Wosp2000, Proccedings of Second International Workshop on Software andPerformance, Ottawa, Canada, September 2000, ACM press. [26] UML Documentation version 1.3 Web Site. On-line at http://www.rational.com/uml/resources/documentation/index.jsps/ [27] Weiss, G. Stochastic Bounds on Distribution of Optimal Value Function with Application to PERT, Network Flows and Reliability Oper. Res. (Vol. 36, 1986), 595-605. [28] http://www.microsoft.com/office/project/ [29] http://www.iil.com/brochures/kerzner.htm