PHOTONIC SENSORS / Vol. 5, No. 1, 2015: 91–96
Realization of Rapid Debugging for Detection Circuit of Optical Fiber Gas Sensor: Using an Analog Signal Source Changbin TIAN, Jun CHANG*, Qiang WANG, Wei WEI, and Cunguang ZHU School of Information Science and Engineering and Shandong Provincial Key Laboratory of Laser Technology and Application, Shandong University, Jinan, 250100, China *
Corresponding author: Jun CHANG
E-mail:
[email protected]
Abstract: An optical fiber gas sensor mainly consists of two parts: optical part and detection circuit. In the debugging for the detection circuit, the optical part usually serves as a signal source. However, in the debugging condition, the optical part can be easily influenced by many factors, such as the fluctuation of ambient temperature or driving current resulting in instability of the wavelength and intensity for the laser; for dual-beam sensor, the different bends and stresses of the optical fiber will lead to the fluctuation of the intensity and phase; the intensity noise from the collimator, coupler, and other optical devices in the system will also result in the impurity of the optical part based signal source. In order to dramatically improve the debugging efficiency of the detection circuit and shorten the period of research and development, this paper describes an analog signal source, consisting of a single chip microcomputer (SCM), an amplifier circuit, and a voltage-to-current conversion circuit. It can be used to realize the rapid debugging detection circuit of the optical fiber gas sensor instead of optical part based signal source. This analog signal source performs well with many other advantages, such as the simple operation, small size, and light weight. Keywords: Optical fiber gas sensor, detection circuit, analog signal source, rapid debugging Citation: Changbin TIAN, Jun CHANG, Qiang WANG, Wei WEI, and Cunguang ZHU, “Realization of Rapid Debugging for Detection Circuit of Optical Fiber Gas Sensor: Using an Analog Signal Source,” Photonic Sensors, 2015, 5(1): 91–96.
1. Introduction The optical fiber gas sensor, which appeared in the late 1980s, is a competitive choice in gas concentration analysis. With the rapid development in the past decades, it has been widely applied in many fields, such as coal, agriculture, petrochemical engineering, metallurgy, medicine, and electric power industries [1]. There is a great demand for the optical fiber gas sensor, because it has incomparable superiority to the traditional sensor, for example, the capability of non-contact measurement, safe measurement in hazardous environment, immunity
to electromagnetic interference, and easy to enlarge the scale of network [2]. The most common method used in a spectrum absorption type gas sensor is to utilize dual-beam differential absorption [3–5]. The common schematic diagram is shown in Fig. 1. Beam coupler DFB-LD
Gas cell
PD-a
PD-b
Signal processing
Fig. 1 Schematic diagram of dual-beam differential absorption.
Because of excellent monochromaticity (typically on the order of MHz) and high side-mode
Received: 26 July 2014 / Revised version: 6 December 2014 © The Author(s) 2014. This article is published with open access at Springerlink.com DOI: 10.1007/s13320-014-0214-z Article type: Regular
Photonic Sensors
92
suppression ratio (SMSR, typically on the order of 40 dB – 50 dB), a distributed feedback laser diode (DFB-LD) is usually used as a light source in this system. The output of the DFB-LD is split into a signal beam and a reference beam. The signal beam propagates through the gas cell to interact with the gas molecule. Simultaneously, the reference beam propagates through nearly the same length of the optic route. Then, both of them couple on their corresponding photo detectors (PD). Usually, photocurrents are transformed into voltages, and then subtraction or division of the transformed voltages is used to yield an output to demodulate the concentration of the probed gas [6]. The above system can be roughly divided into two parts by the PDs: the first part is the optical part, and the second part is the detection circuit. In the industry production process, debugging for the detection circuit is very important. What is more important is that the stability, sensitivity, and linearity of the signal source should perform well. Usually, the optical part is used as a signal source. However, the fluctuation of the working temperature and change in the driving current may result in frequency instability of the laser. The different bends and stresses of the optical fiber, which can be easily influenced by ambient factors, like temperature and vibration, will lead to the instability of the intensity, frequency, even phase of laser parameters, especially for the dual-beam sensor. In addition, inherent noises of the gas cell, coupler, and the other optical devices in the system may also influence the performance of the signal source [7]. In order to be an available signal source, the working temperature has to be controlled, and the optical fiber has to be fixed. Obviously, when the optical part based signal source is used, these bad factors can bring much inconvenience to the detection circuit debugging. The detection circuit cannot be debugged if the optical part would not provide the standard signal, because the debugging signals with the unstable
signal source cannot show the real performance of the detection circuit. During the industrial production, it is rather troublesome to obtain the standard signal from the optical part. Not only the control of temperature, gas pressure, and vibration should be precise, but also the preparation of the standard sample gas is strict and costly. These could bring about many problems to the research and development. In order to improve the efficiency of the detection circuit debugging and shorten the developing cycles, this paper describes an analog signal source consisting of a single chip microcomputer (SCM) module, an amplifier circuit, and a voltage-to-current conversion circuit. It is a kind of the all-electrical detection technology substituting for the two currents derived from PDs, which can be conveniently applied to debugging the detection circuit of the optical fiber gas sensor.
2. Principle of analog signal source In direct absorption spectroscopy measurement, the PD can generate photocurrents when it receives light. The photocurrent can be shown as i BI 0 (1) where I0 (W) is the incident intensity of the probe beam, B (A/W) is the photoelectric conversion coefficient, and i (A) is the intensity of the photocurrent. When the laser frequency is resonant with the frequency of a transition for the absorbing species in the gas, the laser energy will be absorbed. The attenuation of the laser intensity along the path length of L can be described by the Beer-Lambert law [8]: I I 0 exp[ (v) PL] (2) where I0 (W) and I (W) are the incident intensity and transmission intensity of laser, respectively, P (atm) is the total pressure, L (cm) is the gas path length, and α(ν) (atm–1·cm–1) is the absorption coefficient, which can be expressed as follows:
S (T ) g (v v0 )C (3) kT where S(T) (cm·mol–1), which can be found in the
(v )
Changbin TIAN et al.: Realization of Rapid Debugging for Detection Circuit of Optical Fiber Gas Sensor: Using an Analog Signal 93 Source
HITRAN 2008 database [9], is the intensity of the transition at temperature T (K). g(ν–ν0) (cm) is the line shape function, ν is the frequency of laser, and ν0 is the central absorption frequency. C is the mole fraction of the absorbing species in the mixed gas. k (J·K–1) is Boltzmann’s constant. The gas concentration is acquired by calculating C. In this paper, the analog signal source has been designed to replace the output of the two PDs. The schematic diagram is shown in Fig. 2.
ARM
DA
Amplifier circuit Voltage-to-current Conversion circuit
Reference voltage Amplifier circuit
Voltage-to-current Conversion circuit
Two 17 Hz ladder-shaped voltages are presented in Fig. 3. 0.8
Singal voltage Reference voltage
Isignal
0.7
In Fig. 2, the specific parameters of Advanced RISC Machines (ARM) (LPC1758, NXP, Netherlands) are as follows: (1) ARM Cortex-M3 Processor, running at frequencies of up to 100 MHz. (2) 12-bit analog-to-digital converter (ADC) with input multiplexing among six pins, conversion rates up to 200 kHz. (3) 10-bit digital-to-analog converter (DAC) with dedicated conversion and direct memory access (DMA) support. Two 17 Hz ladder-shaped voltages are generated by the ARM. One ladder-shaped voltage V1=V(t) without the absorption peak is used as the reference voltage, and the other ladder-shaped voltage V2=V(t)exp[–α(ν)PL] with the absorption peak is used as the signal voltage. When the pressure is not too high, the absorption peak can be fitted by the Lorentzian profile. The following is the Lorentzian function:
vL 1 2 (v v ) 2 ( vL ) 2 0 2 n vL 2 air (296 / T ) P
3. Experiment
Ireference
Fig. 2 Schematic diagram of the analog signal source.
g L (v v 0 )
Two ladder-shaped voltages are processed by the amplifier circuit and voltage-to-current conversion circuit. The output of two currents of this device which can be conveniently applied to the debugging detection circuit of the optical fiber gas sensor.
(4) (5)
where n is the temperature coefficient, ΔνL is the collision-broadening halfwidth, and γ is the
Amplitude (V)
DA
Signal voltage
pressure-broadening coefficient.
0.6 0.5 Time (s)
0.4 0.3 0.00
0.01
0.02
0.03 Time (s)
0.04
0.05
0.06
Fig. 3 Two 17 Hz ladder-shaped voltages are generated by the ARM.
The ladder-shaped voltage can be expressed as follows: T 0 x 22 x 0.298 3 T T x 0.76 3 2 y (6) 22 x 1.442 T x 5T 2 6 5T 0.298 x T 6 where x(s) is time, and y(V) is the amplitude of voltage. The output voltage of the ARM cannot be processed directly because of the low amplitude and high quantization noise. The amplitude of two ladder- shaped voltages should be amplified, and the ladder- shaped digital signal should be smoothed to reduce the quantization noise by the amplifier circuit. One output of the amplifier circuit is the reference
Photonic Sensors
94
circuit because the current signal is processed conveniently. The output reference current and signal current of the voltage-to-current conversion circuit are I and I0, respectively. The schematic diagrams of circuits are shown in Fig. 4.
voltage V3=mV(t) without the absorption peak, and the other one is the signal voltage V4=mV(t)exp[–α(ν)PL] with the absorption peak. Two ladder-shaped voltages should be transformed into currents by the voltage-to-current conversion
200 R5 2k VR1
GND
GND
Input signal voltage
Vin
200 R1
-
200 R3
+
200 R4
200 R2
-
200 R7
Iout
Output signal current
+
200 R6
+
200 R13 2k VR2
Input reference voltage Vin 200 R8
GND
-
200 R10
+
200 R11
200 R9
-
200 R14
Output reference current
+
200 R12
Iout
+
Fig. 4 Schematic diagram of the amplifier circuit and voltage-to-current conversion circuit.
In the above figure, the amplifier (using OP07) has good characteristics, whose working voltage is ±5 V. The balanced ratiometric detector (BRD) can cancel the excess noise and provide a very wide, temporal bandwidth and an excellent linearity. The use of the BRD is able to masterly solve the insufficiency of common methods [10, 11]. Thus, an analog signal source was applied to BRD debugging in this experiment. The schematic diagram is shown in Fig. 5. Ireference Isignal
BRD
Oscilloscope
could be set by the program, this is to say, the ARM was able to provide ladder-shaped voltages with different amplitude absorption peaks. These ladder-shaped voltages with different-amplitude absorption peaks were amplified and transformed into currents by the amplifier circuit and voltage-to-current conversion circuit, respectively. The currents with different values were connected to the BRD, and we could obtain the absorption peaks with different amplitudes. The stability, sensitivity, and linearity of the analog current source were measured. 0.6 0.5
Fig. 5 Schematic diagram of the measurement of the BRD.
When two standard currents were connected to the BRD, their outputs were the absorption profiles, which are shown in Fig. 6. Simultaneously, the absorption profile was collected by the ARM. Different amplitudes of the absorption peak represented different gas concentrations in the process of the experiment. The value of absorbance
Amplitude (V)
ARM
0.4 0.3 0.2 0.1 0.0 0.1 0.06
0.04
0.00 0.02 Time (s)
0.02
Fig. 6 Schematic diagram of the absorption peak.
Changbin TIAN et al.: Realization of Rapid Debugging for Detection Circuit of Optical Fiber Gas Sensor: Using an Analog Signal 95 Source
3.1 Measurement of stability
The value of absorbance was set by the program, and the BRD was able to detect the amplitude of the absorption peak. For a long-time experiment, the data were collected by the ARM. After this, we set different absorption peaks and repeated the above steps. The measurement of stability is shown in Fig. 7 regarding time as the horizontal axis and the
amplitude of the absorption peak as the vertical axis. In Fig. 7, A, B, C, and D represent different amplitudes of the absorption peak, which were measured at the atmospheric pressure with a temperature range of 18.1 ℃ to 23.3 ℃. The mean value and standard deviation, shown in Table 1, of the absorption peak with different amplitudes were obtained by calculation.
Fig. 7 Stable measurement of the absorption peak value. Table 1 Mean value versus standard deviation. Number
Mean value (mV)
Standard deviation (mV)
A
556.6768
0.2778
B
1151.582
0.3595
C
1551.749
0.4821
D
1913.142
0.4857
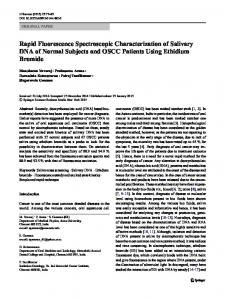
In Table 1, the lower the measured amplitude of the absorption peak is, the smaller the standard deviation is. With the higher measured amplitude of the absorption peak, the standard deviation increased. The experimental results showed that the analog current source had the wide measure range, small errors, and the performance was stable. 3.2 Measurement of linearity
Linearity is one of the important parameters of the analog signal source. In this experiment, the
value of absorbance represented the gas concentration, and the BRD was used to measure the amplitude of the absorption peak. Therefore, a linear relationship existed between the value of absorbance and the amplitude of the absorption peak. Different values of absorbance were set by the program, and different absorption peak values were measured. In Fig. 8, absorbance is regarded as the horizontal axis, and the detected amplitude is regarded as the vertical axis. The above experiment was achieved at the room temperature and pressure. In Fig. 8, the value of absorbance is well proportional to the detected amplitude ranging from 0.002 to 0.46. The proportional relationship was described by a linear equation with an R-square of 0.99989. Thus, this device is little affected by the ambient factors and has excellent linearity.
Photonic Sensors
Detected amplitude (mV)
96
2000
Equation y=a+b*x Adj. R-square 0.99989
1500
Intercept 39.33992 Book1_amplitude Slope 41835.47431 Book1_amplitude
Value
Fundamental Research University (2014YQ011).
Standard error 2.5653 93.54673
Funds
of
Shandong
Open Access This article is distributed under the terms of the Creative Commons Attribution License which permits any use, distribution, and reproduction in any medium, provided the original author(s) and source are credited.
1000 500 0
References 0.00
0.01
0.02 0.03 Absorbance
0.04
0.05
Fig. 8 Relationship between the absorbance and detected amplitude.
3.3 Measurement of sensitivity
In Fig. 8, when the absorbance was 0.02, the signal voltage was 0.88 mV. The noise voltage was measured to be 7.537×10⁻³ mV. Consequently, the signal-to-noise ratio (SNR) was calculated to be 116.757. When SNR = 1, the sensitivity in absorbance could be calculated to be 1.71×10⁻⁴.
4. Conclusions The optical part of the optical fiber gas sensor can be easily influenced by many factors. Obviously, these factors would result in the impurity of the optical part based signal source. Therefore, this paper describes an analog signal source, consisting of an SCM, an amplifier circuit, and a voltage-tocurrent conversion circuit. The experimental verification showed that the analog signal source has the good stability and excellent linearity, and the measuring result indicated the sensitivity could reach to 1.71×10⁻⁴. In addition, it also has some advantages, such as the simple operation, small size, and lightweight. Therefore, this device can be applied to debugging the detection circuit of the optical fiber gas sensor rapidly, which reduces debugging inconvenience and improves the working efficiency.
Acknowledgment This work was supported by the Natural Science Foundation of China (60977058) and the
[1] A. Zhang, “Study on spectrum absorptive fiber optic gas sensors,” M.S. thesis, Wuhan University of Technology, China, 2005. [2] D. Liu, “Research on the driving control system of Steady-frequency for light source in optical fiber gas sensing,” M.S. thesis, Huazhong University of Science and Technology, China, 2006. [3] Y. Zhang, J. Chang, Q. Wang, S. Zhang, and F. Song, “The theoretical and experimental exploration of a novel water vapor concentration measurement scheme based on scanning spectrometry,” in International Conference on Electronics and Optoelectronics 2011, Dalian, China, July, pp. 29–31, 2011. [4] Q. Wang, J. Chang, C. Zhu, C. Li, F. Song, Y. N. Liu, et al., “Detection of water vapor concentration based on differential value of two adjacent absorption peaks,” Laser Physics Letters, 2012, 9(6): 421–425. [5] Y. Sun and X. Lu, “Research on improving sensitivity of the characteristic spectrum in micro-gas monitor,” Spectroscopy and Spectral Analysis, 2010, 30(7): l890–1893. [6] Q. Wang, J. Chang, C. Zhu, Y. Liu, G. Lv, F. Wang, et al., “High-sensitive measurement of water vapor: shot-noise level performance via a noise canceller,” Applied Optics, 2013, 52(5): 1094–1099. [7] J. Qi, X. Dong, J. Zheng, and G. Lin, “An algorithm of filtering background noise of optical fiber gas sensor,” Chinese Journal of Lasers, 2011, 38(11): 1105008-1–1105008-6. [8] S. Zhang, Q. Wang, Y. Zhang, F. Song, K. Chen, G. Chou, et al., “Water vapor detection system based on scanning spectra,” Photonic Sensors, 2012, 2(1): 71–76. [9] L. S. Rothman, I. E. Gordon, A. Barbe, D. C. Benner, P. F. Bernath, M. Birk, et al., “The HITRAN 2008 molecular spectroscopic database,” Journal of Quantitative Spectroscopy and Radiative Transfer, 2009, 110(9–10): 533–572. [10] P. C. D. Hobbs, “Shot noise optical measurement at baseband with noisy lasers,” in Proc. SPIE, vol. 1376, pp. 216–221, 1990. [11] K. L. Haller and P. C. D. Hobbs, “Double beam laser absorption spectroscopy: shot noise-limited performance at baseband with a novel electronic noise canceller,” in Proc. SPIE,, vol. 1435, pp. 298–309, 1991.