MIT Laboratory for Computer Science. Cambridge, Massachusetts, USA. Abstract ...... Master's thesis, MIT. Kamppari, S. and Hazen, T. (2000). Word and phone ...
Preprint of article in Computer Speech and Language, vol. 16, no. 1, pp. 49-67, Jan. 2002.
Recognition Confidence Scoring and Its Use in Speech Understanding Systems Timothy J. Hazen, Stephanie Seneff and Joseph Polifroni Spoken Language Systems Group MIT Laboratory for Computer Science Cambridge, Massachusetts, USA
Abstract In this paper we present an approach to recognition confidence scoring and a set of techniques for integrating confidence scores into the understanding and dialogue components of a speech understanding system. The recognition component uses a multi-tiered approach where confidence scores are computed at the phonetic, word, and utterance levels. The scores are produced by extracting confidence features from the computation of the recognition hypotheses and processing these features using an accept/reject classifier for word and utterance hypotheses. The scores generated by the confidence classifier can then be passed on to the language understanding and dialogue modeling components of the system. In these components the confidence scores can be combined with linguistic scores and pragmatic constraints before the system makes a final decision about the appropriate action to be taken. To evaluate the system, experiments were conducted using the jupiter weather information system. An evaluation of the confidence classifier at the word-level shows that the system detects 66% of the recognizer’s errors with a false detection rate on correctly recognized words of only 5%. An evaluation was also performed at the understanding level using key-value pair concept error rate as the evaluation metric. When confidence scores were integrated into the understanding component of the system, a relative reduction of 35% in concept error rate was achieved.
1. Introduction The Spoken Language Systems Group conducts research leading to the development of conversational systems for human-machine interaction. These systems must not only recognize the words which are spoken by a user but also understand the user’s query and respond accordingly. To achieve this goal, accurate 1
Hazen, Seneff & Polifroni : Recognition Confidence Scoring
2
automatic speech recognition is a necessity. The presence of incorrectly recognized words may cause the system to misunderstand a user’s request, possibly resulting in the execution of an undesirable action. Unfortunately today’s speech recognition technology is far from perfect and errors in recognition must be expected. For example, let us consider the performance of the jupiter weather information system (Zue, 2000). On a randomly selected test set of 2388 utterances, the recognizer for jupiter achieves a word error rate of 19.1%. On utterances which contain no out-of-vocabulary words and are clean of other artifacts that make recognition difficult (i.e., background noise, partial words, etc.) the error rate is only 9.9%. However, these “clean” utterances constitute only 75% of the test data. The error rate on the remaining 25% of the data is over 50%! It is this type of performance which motivates the development of confidence scoring techniques. Because recognition systems cannot yet (and may never) completely avoid recognition errors, it alternatively becomes desirable for a system to be able to detect when recognition errors have occurred and take appropriate actions to recover from these errors. One simple approach to deal with recognition errors is to reject entire utterances which the system is having trouble recognizing. In cases where the recognizer is unable to produce a likely recognition hypothesis which conveys a clear and obvious semantic meaning it may be better for the system to reject the entire utterance rather than provide a response which is inconsistent with the user’s actual request. In this circumstance a variety of strategies could be employed to guide the user. One approach is to provide informative “help” messages which instruct the user about the system’s capabilities thereby steering the user towards queries that the system can handle. Another approach is to fall back into a strict directed dialogue paradigm where the system asks the user very specific questions in order to constrain the user to the vocabulary and knowledge domain of the system. The primary difficulty with utterance-level rejection strategies is that the user is not informed about the specific portions of the utterance with which the recognizer had difficulty. A lack of feedback about what portions of an utterance the system did and did not understand could lead to increased confusion about what the user can and cannot say to the system. For example, suppose a user asks this question: is there a flood warning for harper’s ferry If the system completely rejects this request at the utterance level the user does not know if the system couldn’t recognize the concept of a flood warning, the city of harper’s ferry, or both. Without more information about why the system rejected this utterance, the user may be unsure about what to say next. Ideally, the system should be able to detect word-level recognition errors. With knowledge about the confidence the recognizer had in each of the specific words that it hypothesized, the system could tailor a response to the user which is more
Hazen, Seneff & Polifroni : Recognition Confidence Scoring
3
informative about what it did and did not understand from the user’s request. For example, suppose a user asks jupiter the following question: what is the forecast for paramus park new jersey For this example, the jupiter speech recognizer does not have the word paramus in its vocabulary. As such, the recognizer will provide its best guess using the words it knows. Thus, it might hypothesize the following query: what is the forecast for paris park new jersey Using confidence scoring techniques jupiter should be able to determine that the word paris was not a reliable hypothesis. It could then mark this word as a potentially misrecognized word when passing the utterance on to the understanding component of the system. At that point the understanding component would need to be able to determine that the user is looking for the forecast for some place in New Jersey, but that the name of the place was misrecognized. Using this information the system could then prompt the user with the list of places in New Jersey for which it knows forecasts. The system might also prompt the user to spell the name of the city and learn it for future use. To develop a system capable of the actions described above, two specific research goals must be addressed. First, a recognition confidence scoring technique which accurately determines when a recognizer’s output hypothesis is reliable or unreliable must be developed. Second, confidence scores must be integrated into the back-end components of the system (e.g., language understanding and dialogue modeling) thereby enabling these components to make an informed decision about the action that should be taken when a confidence score indicates that a hypothesis may be incorrect. It is these two goals that our research strives to address. In this paper, we will present the details of our approach to this problem and present experimental results demonstrating the capabilities of our techniques.
2. Recognition Confidence Scoring 2.1. Overview
An accurate method for determining confidence scores for the speech recognition process must take into account two primary difficulties inherent in typical speech recognition systems. First, the models used in the recognition process may be inadequate, for any number of reasons, for discrimination between competing hypotheses. Second, recognizers are typically developed for closed set recognition (e.g., recognition using a pre-determined fixed vocabulary) and are thus not entirely appropriate for open set recognition problems where unknown words, partial words, and non-speech noises may corrupt the input. Thus, an accurate confidence scoring technique should take into account the
Hazen, Seneff & Polifroni : Recognition Confidence Scoring
4
various factors which can contribute to misrecognitions. First, the scoring technique must be able to determine whether or not the recognizer has many competing hypotheses which could cause confusions. Recognition errors are less likely to occur when one hypothesis easily out-scores all other competing hypotheses. Likewise, errors are far more likely to occur when multiple competing hypotheses all have similar scores (Hetherington, 1994). Second, the recognizer must be able to determine if the input speech is actually a good fit to the underlying models used by the system, regardless of the relative scores of the competing hypotheses. Errors are more likely when there is a poor fit between the input test data and the training data. This can be the case when unknown words or non-speech sounds are present in the input data. When examining the results of the recognition process, confidence scores for the recognition output can be computed on various levels, including the phonetic level, the word level, and the utterance level. In this paper we will refer to confidence at the phonetic level as the reliability of the individual acoustic model scores. In standard hidden Markov model (HMM) systems, this would correspond to the acoustic scores at the frame level. In our system we generate phonetic-level confidence scores only as an intermediate step towards generating word-level and utterance-level confidence scores. We utilize the same basic approach, as outlined below, for computing both word-level and utterance-level scores. To attack this problem we start by extracting a set of confidence features from the computations performed during recognition. The extraction of multiple confidence features has been investigated in many recent research efforts (Chase, 1997; Sui, Gish & Richardson, 1997; Schaaf & Kemp, 1997; Weintraub, 1997; Pao, Schmid & Glass, 1998) providing us with a wide variety of potential features to examine. These features can be selected based on their correlation with the correctness of the recognition hypotheses from which they are extracted (Schaaf & Kemp, 1997). In our case, we selected a subset of the many potential confidence features to utilize in our system using a greedy search over many candidate features. This search iteratively adds features to the feature set by choosing the one feature from the candidate set which most improves the confidence prediction results when used in conjunction with previously selected features. The algorithm stops adding features when the addition of new features fails to improve performance. The final set of selected confidence features are combined together into a single confidence feature vector. After the confidence feature vector for each particular hypothesis has been computed, it can be passed through a confidence scoring model which produces a single confidence score based on the entire feature vector. In past research efforts, a variety of different methods for generating a single confidence score from a multi-dimension feature vector have been explored. These methods include the use of Fisher linear discriminant projection (Schaaf & Kemp, 1997; Pao, Schmid & Glass, 1998), mixture Gaussian modeling (Kamppari, 1999), neural networks (Schaaf & Kemp, 1997; Wendemuth, 1999) and support vector machines (Ma, Randolph & Drish, 2001).
Hazen, Seneff & Polifroni : Recognition Confidence Scoring
5
Once a score for each hypothesis has been determined, a variety of possible actions can be taken. In very basic system designs, a discrete set of actions such as “accept”, “reject” or “confirm” can be applied to a hypothesis based on its confidence score. In more complicated systems, the recognizer can generate a full graph of hypotheses augmented with confidences scores which can be passed along to the understanding and dialogue modeling components of the system (Rose, et al, 2000; Hazen, et al, 2000). These components can combine the recognizer’s confidence scores with linguistic scores and pragmatic constraints to arrive at a final hypothesis and determine the appropriate action. 2.2. Phonetic-Level Scoring
Many confidence scoring techniques focus on an examination of the scores produced by the recognizer’s acoustic models at the phonetic level. Because the raw acoustic scores are usually not particularly useful as confidence measures (Bergen & Ward, 1997), various methods exist to normalize these scores (Lleida & Rose, 1996; Williams & Renals, 1999; Cox & Dasmahapatra, 1999; Kamppari & Hazen, 2000). In this work all of the acoustic scores produced at the phonetic level are normalized against a catch-all model. The normalization of the acoustic score does not affect the outcome of the recognition search but does allow the score produced for each phone to act as a phonetic-level confidence feature. Mathematically, the phonetic-level confidence score for a hypothesized phone u given an acoustic observation, ~x, is: p(~x|u) c(u|~x) = log (1) p(~x) This normalization process produces a score which is zero-centered with respect to the log of p(~x), allowing the scores to be consistent across different observations. In practice, the catch-all model that is used is an approximation of the p(~x) model that would result from the weighted summation of the p(~x|u) models over all u. The approximation of p(~x) is created by performing a bottom-up clustering of the full set of components in p(~x) and approximating large clusters of components with single Gaussian densities (Kamppari, 1999). All references to acoustic scores in the remainder of this paper refer to the normalized acoustic scores described above. Phonetic-level acoustic confidence scores can be useful for a variety of tasks. For example, these scores can be used to locate mismatches between the acoustic models dictated by a word’s given pronunciation and the acoustic observations for that word, thereby helping identify missing alternate pronunciations for any given word. In a similar vein, an examination of these scores during recognition could be used to help identify words that the user has mispronounced. In this work, we are primarily interested in identifying recognition errors at the word and utterance levels. In this scenario, examination of the individual phonetic confidence scores is performed only as an intermediate step towards producing higher-level confidence scores.
Hazen, Seneff & Polifroni : Recognition Confidence Scoring
6
2.3. Utterance-Level Features
For each utterance, a single confidence feature is constructed from a set of utterance-level features extracted from the recognizer. For this work 15 different features which have been observed to provide information about the correctness of an utterance hypothesis were utilized. These utterance-level features are: 1. Top-Choice Total Score: The total score from all models (i.e., the acoustic, language, and pronunciation models) for the top-choice hypothesis. 2. Top-Choice Average Score: The average score per word from all models for the top-choice hypothesis. 3. Top-Choice Total N-gram Score: The total score of the N-gram model for the top-choice hypothesis. 4. Top-Choice Average N-gram Score: The average score per word of the N-gram model for the top-choice hypothesis. 5. Top-Choice Total Acoustic Score: The total acoustic score summed over all acoustic observations for the top-choice hypothesis. 6. Top-Choice Average Acoustic Score: The average acoustic score per acoustic observation for the top-choice hypothesis. 7. Total Score Drop: The drop in the total score between the top hypothesis and the second hypothesis in the N-best list. 8. Acoustic Score Drop: The drop in the total acoustic score between the top hypothesis and the second hypothesis in the N-best list. 9. Lexical Score Drop: The drop in the total N-gram score between the top hypothesis and the second hypothesis in the N-best list. 10. Top-Choice Average N-best Purity: The average N-best purity of all words in the top-choice hypothesis. The N-best purity for a hypothesized word is the fraction of N-best hypotheses in which that particular hypothesized word appears in the same location in the sentence. The N-best purity is sometimes referred to as the “N-best Score” (Gillick, Ito & Young, 1997). 11. Top-Choice High N-best Purity: The fraction of words in the top-choice hypothesis which have an N-best purity of greater than one half. 12. Average N-best Purity: The average N-best purity of all words in all of the N-best list hypotheses. 13. High N-best Purity: The percentage of words across all N-best list hypotheses which have an N-best purity of greater than one half. 14. Number of N-best Hypotheses: The number of sentence hypotheses in the N-best list. This number is usually its maximum value of ten but can be lower if fewer than ten hypotheses are left after the search prunes away highly unlikely hypotheses. 15. Top-Choice Number of Words: The number of hypothesized words in the top-choice hypothesis.
Hazen, Seneff & Polifroni : Recognition Confidence Scoring
7
2.4. Word-Level Features
For each hypothesized word in each N-best hypothesis, a set of word-level features are extracted from the recognizer to create a confidence feature vector. For this work 10 different features, which have been observed to provide information about the correctness of a word hypothesis, were utilized. These features are: 1. Mean Acoustic Score: The mean log-likelihood acoustic score across all acoustic observations in the word hypothesis (where the acoustic score is a zero-centered log-likelihood ratio and not a raw density function score). 2. Mean Acoustic Likelihood Score: The mean of the acoustic likelihood scores (not the log scores) across all acoustic observations in the word hypothesis. 3. Minimum Acoustic Score: The minimum (or worst) log-likelihood score across all acoustic observations in the word hypothesis. 4. Acoustic Score Standard Deviation: The standard deviation of the log-likelihood acoustic scores across all acoustic observations in the word hypothesis. 5. Mean Difference From Maximum Score: The average difference between the acoustic score of a hypothesized phonetic unit and the acoustic score of the highest scoring (or best) phonetic unit for the same observation across all acoustic observations in the word hypothesis. 6. Mean Catch-All Score: Mean score of the catch-all model across all observations in the word hypothesis. 7. Number of Acoustic Observations: The number of phone-level acoustic observations within the word hypothesis. 8. N-best Purity: The fraction of the N-best hypotheses in which the hypothesized word appears in the same position in the utterance. 9. Number of N-best: The number of sentence-level N-best hypotheses generated by the recognizer. 10. Utterance Score: The utterance confidence score generated from the utterance features described above. 2.5. Classifier Training
2.5.1. The Training Data: To train the confidence scoring mechanism and the accept/reject classifier, a set of training data must be used which is independent of the training data used to train the recognizer. The independence is required to insure that the confidence scoring mechanism accurately predicts the recognizer’s performances on unseen data. In our experiments, which were conducted using the jupiter system, the confidence training data consists of 2506 jupiter utterances. Each utterance is
Hazen, Seneff & Polifroni : Recognition Confidence Scoring
8
passed through the recognizer to produce a set of N-best hypotheses (where N = 10) which are used to train the confidence scoring mechanism. When training the model for word confidence scoring, only the hypothesized words in the top-choice of the N-best list are used. 2.5.2. Data Labeling: The first step in the training process is to label the data. Each training token must be labeled either as correct or incorrect. The correct label is for tokens which should be accepted by the classifier, while the incorrect label is for tokens which should be rejected. This step must be taken for both the word and utterancelevel classifiers. In both cases, each correct/incorrect label is associated with the confidence feature vector extracted from the recognizer for that hypothesis. For word-level scoring the labeling scheme is obvious. Correctly hypothesized words are labeled as correct and incorrectly hypothesized words are labeled as incorrect. For utterance-level scoring the concept of correctness is not as clear. We have elected to use a set of heuristics to define the labels of correct and incorrect such that only utterances which the recognizer has extreme difficulties recognizing will be marked as incorrect. In this labeling scheme, we mark utterances in which the correct orthography is one of the top four sentence hypotheses as correct. Utterances in which at least two out of every three words in the topchoice hypothesis are correctly recognized are also marked as correct. All other utterances are labeled as incorrect. 2.5.3. The Classifier Model: The same confidence scoring technique is used for both word and utterance-level confidence scoring. To produce a single confidence score for a hypothesis, a simple linear discrimination projection vector is trained. This projection vector reduces the multi-dimensional confidence feature vector from the hypothesis down to a single confidence score. Mathematically this is expressed as r = p~ T f~
(2)
where f~ is the feature vector, p~ is the projection vector, and r is the raw confidence score. Because the raw confidence score r is simply a linear combination of a set of features, the score has no probabilistic meaning. Ideally, we prefer to generate scores which have a probabilistic meaning in order to make these scores more compatible with other probabilistic components of our entire system. To this end, a probabilistic confidence score based on maximum a posteriori probability (MAP) classification is created using the following expression: � � p(r|correct)P(correct) c = log −t (3) p(r|incorrect)P(incorrect)
Hazen, Seneff & Polifroni : Recognition Confidence Scoring
9
In this expression, the p(r|correct) and p(r|incorrect) terms are modeled with Gaussian density functions for r for correct and incorrect tokens, the P(correct) and P(incorrect) terms are a priori probabilities of observing correct or incorrect tokens, and c is the final probabilistic confidence score expressed in the log domain. Note that a constant decision threshold t is applied to the score to set the accept/reject decision threshold to zero. Thus, after the decision threshold t is subtracted, a negative score for c results in a rejection while a non-negative score results in an acceptance. Although various studies have utilized more complicated classification techniques, such as multi-layered perceptrons (Weintraub, 1997) and support vector machines (Ma, Randolph & Drish, 2001), it is not evident that a more complicated technique is needed for this task. In past work, we were able to achieve better results with a simple linear projection model than with a more complicated MAP classification approach using mixture Gaussian models (Kamppari, 1999; Kamppari & Hazen, 2000). Other studies have also observed that simple linear decision techniques work as well as more complicated classifiers, such as multi-layered perceptrons (Schaaf & Kemp, 1997; Wendemuth, 1999), on this task. We may return our attention to this open question in future studies. 2.5.4. The Training Method: The projection vector p~ is trained using a minimum classification error (MCE) training technique. In this technique the projection vector p~ is first initialized using Fisher linear discriminant analysis. After the initialization of ~p, a simple hill-climbing algorithm iterates through each dimension in p~ adjusting its values to minimize the classification error rate on the training data (Powell, 1964). The optimization continues until a local minimum in error rate is achieved. The Gaussian density parameters of the classifier model are trained from the raw scores generated after applying ~p to the feature vectors in the training set. The threshold t is determined by setting the operating point of the system to a desired location on the receiver-operator characteristic (ROC) curve. For the utterance-level scores, the threshold is set such that 98% of the utterances which are labeled as correct are accepted. This threshold is chosen to insure a high detection rate which discourages false rejections. For words, the minimum classification error rate is chosen as the desired operating point. 2.6. Experimental Test Conditions
To test the confidence scoring techniques, a test set of 2388 jupiter utterances is utilized. For recognition we utilize the summit speech recognition system (Glass, Chang & McCandless, 1996) as trained specifically for the jupiter weather domain (Glass, Hazen & Hetherington, 1999). The recognizer is trained on over 70,000 utterances collected from live telephone calls to our publicly available system. The recognizer’s vocabulary has 2005 words. As discussed in the introduction, the recognizer achieved a word error rate of 19.1% on this test set.
Hazen, Seneff & Polifroni : Recognition Confidence Scoring
10
2.7. Utterance-Level Experimental Results
The goal of utterance-level confidence scoring is to reject utterances with which the recognizer has extreme difficulty. With this in mind the utterance scoring mechanism rejected 13% of the utterances in the test set. The word error rate on this 13% of the data was over 100% (i.e., there were more errors than actual words in the reference orthographies). Closer examination reveals that only 27% of the reference words in the orthography were actually recognized correctly and that both substitution errors and insertion errors happened more frequently than correct recognitions. By comparison, the word error rate on the 87% of the utterances that were accepted was 14%. These results indicate that the utterance-level confidence scoring mechanism performs its job as intended. 2.8. Word-Level Experimental Results
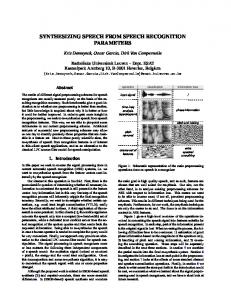
To evaluate word-level confidence scoring, there are a variety of metrics that have been proposed in the confidence scoring community (Sui & Gish, 1999). Of the wide variety of evaluation techniques available, we have chosen to evaluate our word confidence models using the ROC curve of the confidence model. We also examine the “accept/reject” classification error rate of the confidence model at the operating point along the ROC that our system actually utilizes. We choose these measures because they offer a clear and obvious interpretation of actual performance of a confidence model for a given recognizer. All of our evaluations are performed using the words in the recognizer’s top-choice sentence hypothesis for each utterance in our test set. The ROC curve of a confidence model measures the trade-off between the acceptance of correctly recognized words (i.e., the detection rate) and the false acceptance of incorrectly recognized words (i.e., the false alarm rate). Figure 1 shows the ROC curves for the three best individual word features (the mean acoustic score, the N-best purity, and the utterance-level confidence score). As can be seen in the figure, the ROC curve of the full MCE-trained model based on all 10 features dramatically improves upon the ROC curves of each of the three best individual features. When examining the individual features, it is observed that the relative capabilities of the individual features varies depending on their exact operating points on the curve. For speech understanding systems to be useful, the confidence scoring model cannot be overly aggressive in trying to reject misrecognitions. We typically operate our word confidence scoring model at the minimum classification rate of the ROC curve (as determined on development test data). At this operating point the correct acceptance rate is 94.9% and the false acceptance rate is 34.3%. In other words, the system correctly rejects 65.7% of incorrectly recognized words while falsely rejecting only 5.1% of correctly recognized words. Because we are primarily interested in the confidence model’s performance at its actual operating point (as opposed to its performance over the entire ROC curve), we can evaluate the system using a single-valued evaluation criterion: the
Hazen, Seneff & Polifroni : Recognition Confidence Scoring
11
1 0.9
Correct Acceptance Rate
0.8 0.7 0.6 0.5 0.4 0.3
10 Combined Features Mean Acoustic Score N−best Purity Score Utterance Confidence Score
0.2 0.1 0 0
0.1
0.2
0.3
0.4 0.5 0.6 0.7 False Acceptance Rate
0.8
0.9
1
Figure 1: ROC curve produced by three individual word confidence features and by the full MCE-trained model using 10 word confidence features.
error rate on “accept/reject” classification of the word hypotheses. Using this evaluation metric, an error occurs if the classifier accepts a misrecognized word or rejects a correctly recognized word. This error rate is directly related to a recognition metric we refer to as the hypothesized word error rate (HWER). The hypothesized word error rate is expressed as follows: HWER =
(# of substitutions) + (# of insertions) # of hypothesized words
(4)
The HWER differs from the standard word error rate (WER) in that it only considers the accuracy of the words observed in the hypothesized word string. It neglects deletion errors and is normalized by the number of hypothesized words and not the number of reference words. This metric is related to the accept/reject error rate because the accept/reject classifier can only operate on words which are actually present in the hypothesis. At present the confidence scoring technique has no ability to express the confidence that a word may have been deleted. The relationship between the accept/reject error rate and the HWER results from the fact that the HWER acts as an upper bound on the accept/reject error rate. This can be achieved by instructing the classifier to accept all word hypotheses.
Hazen, Seneff & Polifroni : Recognition Confidence Scoring
12
This assumes that the HWER is less than 50%. In cases where the HWER is actually greater than 50% the upper bound is based on a system which instead rejects all hypothesized words. With this in mind, the goal is to achieve an accept/reject error rate which dramatically improves upon this upper bound. The system which simply accepts (or rejects) all words will be referred to as the baseline system against which the accept/reject classifier is compared. Table 1 examines the accept/reject classification error rate under three conditions: (1) the baseline system, (2) a classifier using each of the 10 word features on an individual basis, and (3) the system using the complete set of features with the MCE-trained linear discriminant classifier. These results were computed over all hypothesized words from only utterances accepted by the utterance-level classifier. As can be seen in the table, the individual features based solely on the acoustic scores do not perform particularly well by themselves. In fact, the mean log-likelihood acoustic score, which is the best of the acoustically-based confidence features, has an accept/reject error rate which is only 3% less than the baseline system (11.7% vs. 12.1%). By comparison, the utterance-level score, which is the same for all words in any sentence hypothesis, yields a 7% improvement from the baseline (11.2% vs. 12.1%), and the N-best purity measure yields an 11% improvement (10.8% vs. 12.1%). When all of the features are combined, a relative error rate reduction of 22% from the baseline can be achieved (9.4% vs. 12.1%). Table 2 shows the performance of the classifier under two different constraints. First, the table shows the performance of the classifier when tested on accepted versus rejected utterances. For accepted utterances the baseline system accepts all words. In this case, the improvement over the baseline achieved by the accept/reject classifier comes from rejecting as many misrecognized words as possible while maintaining a low false rejection rate. For rejected utterance (where over 70% of the hypothesized words are incorrect), the baseline system rejects all hypothesized words. In this case, the improvement over the baseline system is achieved by accepting as many correctly recognized words as possible while maintaining a low false acceptance rate. As can be seen in the table, the classifier shows a larger reduction in classifier error rate from the baseline on rejected utterances than it does on accepted utterances. This result indicates that the word confidence scoring technique can be useful for both accepted and rejected utterances. Table 2 also shows the performance of the classifier when applied to all hypothesized words as compared to its application to only hypothesized words which are proper names of geographic locations. This analysis is useful because content words such as location names are typically more important to the correct understanding of an utterance than function words. The results indicate that the confidence scoring technique is more accurate on hypothesized location names than it is over all words in general. This result is very satisfying since it indicates that the confidence scoring technique works best on the words which are most important for understanding.
Hazen, Seneff & Polifroni : Recognition Confidence Scoring Test Condition or Feature Baseline (HWER) # of N -best Acoustic Score Std. Dev. # of Acoustic Observations Mean Catch-All Score Minimum Acoustic Score Mean Diff. from Max Score Mean Acoustic Likelihood Mean Acoustic Score (log) Utterance Score N -best Purity Combined
13
Accept/Reject Error Rate 12.1 % 12.1 % 12.1 % 12.1 % 12.1 % 12.1 % 12.0 % 11.9 % 11.7 % 11.2 % 10.8 % 9.4 %
Table 1: Accept/reject classification performance of word confidence scoring mechanism on accepted utterances when each feature is tested independently and when features are combined using linear combination with Minimum Classification Error training.
Utterances All Accepted Rejected All Accepted Rejected
Words All words All words All words Locations Locations Locations
Accept/Reject Error Rate Baseline Classifier 16.4 % 10.1 % 12.1 % 9.4 % 27.2 % 19.1 % 17.8 % 9.1 % 12.9 % 8.7 % 24.3 % 14.5 %
Table 2: Comparison of accept/reject classification performance of word confidence scoring mechanism over all utterances, accepted utterances only, and rejected utterances only, when considering all hypothesized words versus geographic location words only.
The performance of the accept/reject classifier can also be examined in several other interesting ways. When examining accepted utterances only, the system correctly rejects 51% of the incorrectly hypothesized words while only falsely rejecting 4% of correct words. These numbers improve to 54% and 3.5% when considering only words which are location names. Furthermore, across all utterances the combination of utterance and word-level scoring correctly detects 72% of the errors introduced by unknown words and 85% of the errors introduced by non-lexical artifacts.
3. Integrating Confidence Scores into Understanding 3.1. Overview
While it is interesting to examine the results of the confidence scoring techniques in the context of recognition, the ultimate goal of this work is to improve
Hazen, Seneff & Polifroni : Recognition Confidence Scoring
14
the understanding accuracy of our conversational systems. To achieve this, we must integrate the recognition confidence scores into the language understanding component of the system. For language understanding we utilize the tina natural language understanding system (Seneff, 1992). Tina utilizes a semanticallytagged probabilistic context free grammar to parse each utterance. In cases where tina is unable to generate a full parse, the system may back off to a robust (or partial) parse of the utterance. For utterances in which either a full or robust parse is found, a set of semantic concepts, represented as key-value pairs, can be extracted from the semantic information present in the parse tree. For example, consider the following query: what is the forecast for piscataway new jersey From the semantically-tagged parse tree of this utterance the following key-value representation is generated: weather: forecast city: piscataway state: new jersey In our experiments, language understanding is evaluated by examining the concept error rate from the set of key-value pairs (Polifroni, et al, 1998). To integrate confidence scores into the understanding component a two-step process can be utilized. First, if an utterance is rejected at the utterance-level, the understanding component does not attempt to understand the utterance and assumes that no useful information for understanding can be extracted from the recognizer’s output. In this case the system does not generate any key-value pairs. If the utterance is accepted, the second step is to create an N-best list which is augmented with confidence scores, and allow the natural language parser to try to interpret the utterance from the N-best list, given that some words may be misrecognized. An alternative approach is to ignore utterance-level rejection and perform understanding on all utterances regardless of how bad their utterancelevel confidence scores are. 3.2. N -best List Augmentation
To handle word confidence scores, only a few modifications to the basic Nbest list are required. First, the N-best list passed to the parser is augmented with confidence scores. The first list in Table 3 shows an example N-best list augmented with confidence scores. Two different word rejection strategies can be applied to the initial N-best list. The second list in Table 3 shows the application of hard rejection to the N-best list. In this case, any word with a confidence of less than zero is replaced with a rejected word marker which receives the neutral score of zero. The third list in Table 3 shows the application of optional rejection. This list is essentially the combination of the first two lists. Using optional rejection, poorly scoring words are retained in the final N-best list but must compete with the rejected word markers they generate, which have a higher score. In this process poorly scoring words can be selected over their rejected counterparts in
Hazen, Seneff & Polifroni : Recognition Confidence Scoring N -best list without rejection: what is 6.13 the 5.48 forecast what is 6.13 the 5.48 forecast what is 6.13 the 5.48 forecast what is 6.13 the 5.48 forecast
15
6.88 6.88 6.88 6.88
for for for for
5.43 4.47 5.12 4.28
paris hyannis venice france
-0.03 -0.16 -1.49 -1.76
park park park park
4.41 4.41 4.41 4.41
new new new new
jersey jersey jersey jersey
4.35 4.35 4.35 4.35
N -best list with hard rejection: what is 6.13 the 5.48 forecast 6.88 what is 6.13 the 5.48 forecast 6.88 what is 6.13 the 5.48 forecast 6.88 what is 6.13 the 5.48 forecast 6.88
for for for for
5.43 4.47 5.12 4.28
*reject* *reject* *reject* *reject*
0.00 0.00 0.00 0.00
park park park park
4.41 4.41 4.41 4.41
new new new new
jersey jersey jersey jersey
4.35 4.35 4.35 4.35
N -best list with soft rejection: what is 6.13 the 5.48 forecast what is 6.13 the 5.48 forecast what is 6.13 the 5.48 forecast what is 6.13 the 5.48 forecast what is 6.13 the 5.48 forecast what is 6.13 the 5.48 forecast what is 6.13 the 5.48 forecast what is 6.13 the 5.48 forecast
for for for for for for for for
5.43 5.43 4.47 4.47 5.12 5.12 4.28 4.28
paris -0.03 *reject* 0.00 hyannis -0.16 *reject * 0.00 venice -1.49 *reject* 0.00 france -1.76 *reject * 0.00
park park park park park park park park
4.41 4.41 4.41 4.41 4.41 4.41 4.41 4.41
new new new new new new new new
jersey jersey jersey jersey jersey jersey jersey jersey
4.35 4.35 4.35 4.35 4.35 4.35 4.35 4.35
6.88 6.88 6.88 6.88 6.88 6.88 6.88 6.88
Table 3: Example N -best lists augmented with confidence scores. The first list is the standard output from the recognizer. The second list shows how hard rejection is applied to poorly scoring words. The third list is the union of the first two lists allowing for soft or optional rejection.
cases where the parser’s linguistic probabilistic scores strongly prefer the poorly scoring hypothesis. 3.3. Word Graph Search
Within tina, the incoming N-best list is collapsed into a word graph. Each arc in the word graph is augmented with a score for its respective word. Before the implementation of word-level confidence scores, a heuristic word scoring method was utilized which generated scores based on the number of N-best hypotheses each word appeared in and the rank of those N-best hypotheses (Kamppari, 1999). In the new version of the system, each arc in the word graph is instead augmented with the word-level confidence scores generated from the recognizer. The parser performs a beam search through the graph combining the word scores with trained linguistic probabilities to generate a total score for each parse theory. From a ranked list of parse theories extracted from the word graph search, tina selects the highest scoring theory that produces a full parse. If no path through the word graph can be found that generates a full parse, then the system selects the highest scoring robust parse. The disadvantage of this approach is that it has the possibility of selecting any word sequence through
Hazen, Seneff & Polifroni : Recognition Confidence Scoring
16
the word graph in order to find a sentence that parses, even if one or more words in the hypothesis are highly likely to be misrecognitions. When the input Nbest list is augmented with word rejections, the resulting word graph allows the parser the option of selecting rejected words instead of poorly scoring words. 3.4. Grammar Augmentation
By allowing the words with bad confidence scores to be optionally rejected in the word graph, it becomes possible for the understanding component to generate new semantic representations that might not be possible from the original set of word hypotheses generated by the recognizer. For example, the system can now ascertain the syntactic and semantic role of a rejected word if there is enough surrounding context to allow the parser to incorporate the rejected word marker into a full parse tree. At the moment this is enabled by the author of the grammar who must explicitly augment the grammar to allow rejected word markers as terminals in certain locations within some parse tree structures. For example, in jupiter the grammar was adjusted to allow rejected words to be parsed as unknown city names in sentence contexts where the rejected word was almost certainly a city name. In the example in Table 3, for example, the word sequence “*reject* park” would be parsed as an unknown city name. This adjustment complemented an existing parsing mechanism which allowed unknown words (i.e., words not in the vocabulary of the grammar) to parse in a similar fashion. A second adjustment to the grammar that can be made is to allow rejected words appearing anywhere in the sentence to be skipped when the parser is attempting to find a robust parse. This allows the parser to concentrate on only the portions of the utterance which were recognized with high confidence and to perform a partial parse based on these islands of reliability. This modification is especially useful for eliminating problems that result from spurious sounds or speech at the beginning and/or end of an utterance. 3.5. Experimental Results
To examine the effects of confidence scoring on language understanding, the jupiter system can be evaluated on the test data under five different conditions: (1) using the original system which did not utilize word confidence scores, (2) using the new system which utilizes word confidence scores but does not perform any rejection, (3) using the new system with utterance rejection, (4) using the new system with utterance rejection and optional word rejection, and (5) using the new system with utterance rejection and hard word rejection. As discussed earlier, these conditions are investigated using key-value pair concept error rate (Polifroni, et al, 1998). The results are shown in Table 4 in terms of substitution, insertion, deletion, and total error rates. For these experiments, a substitution error occurs when a test utterance has a key-value pair where the key matches a key-value pair in the correct answer, but the value in the pair is
Hazen, Seneff & Polifroni : Recognition Confidence Scoring
17
different. An insertion occurs when a key-value concept is erroneously inserted. Likewise, a deletion occurs when a key-value concept is erroneously deleted. An examination of Table 4 yields several important observations. First, the new system using the probabilistic word confidence scores has an error rate which is 8% smaller than the error rate of the original system using the heuristic word scores. However, both the original and new systems suffer from excessive insertion errors when no rejection is utilized. This is primarily the result of the understanding component’s aggressive effort to find a reasonable interpretation of an utterance from any of the hypotheses in the N-best list. Without rejection, the understanding component can latch onto any hypothesis which produces a parse regardless of whether or not the recognizer is confident about the hypothesis. This generally produces the correct answer when the user is cooperative, speaks clearly and stays within domain. However, this approach yields many insertions when the utterance is out of domain, has unknown words, or has artifacts which cause difficulty for the recognizer. Next, when utterance-level rejection is added, the insertion error rate is reduced from 18.2% to 12.7% while the deletion error rate is only increased from 6.1% to 7.1%. In other words, the use of utterance rejection removes 5.5 insertion errors for every deletion error that is added. This translates into a relative error rate reduction of 17%. Next, the addition of word rejection to utterance rejection produces another significant improvement in the total error rate. While the total error rates for optional word rejection versus hard word rejection are virtually the same, the nature of the underlying errors is slightly different. Using optional word rejection, the insertion error rate remains higher than the deletion error rate. However, hard word rejection produces a result where deletions outnumber insertions. The relative desirability of each method would thus be dependent on whether or not insertion errors are more harmful to the user’s interaction with the system than deletions. The addition of word rejection allows a relative error rate reduction of 14% from the system using utterance rejection only. Overall, the use of utterance and word confidence scores and rejection within the understanding component achieved a relative reduction in concept error rate of 35%, from 28.5% to 18.6%.
Experimental Conditions Original system New system w/o reject. + utterance rejection + optional word reject. + hard word rejection
Concept Error Rates (%) Sub. Ins. Del. Total 1.9 20.2 6.4 28.5 2.1 18.2 6.1 26.3 1.8 12.7 7.1 21.7 1.3 9.0 8.4 18.7 1.0 7.2 10.5 18.6
Table 4: Concept error rates of the understanding component as confidence scores and different levels of confidence rejection are added to the system.
Hazen, Seneff & Polifroni : Recognition Confidence Scoring
18
After running the experiments shown in Table 4, we re-ran the word-level rejection experiments without using any utterance-level rejection. These followup experiments produced nearly identical results as the experiments that used utterance-level rejection. In essence utterances that were rejected tended to produce word-level scores that caused all or most of the individual words to be rejected as well. This led us to conclude that utterance-level rejection is actually unnecessary in our system from an understanding point of view, although a slight amount of computation can be saved by skipping a full natural language parse when an utterance is rejected. Additionally a closer examination of the error rate reductions achieved from word-level rejection reveals that almost all of the reduction is due to the system’s ability to skip rejected words during the parse and to revert to a partial parse of the confident portions of the utterance. Only a small handful of the test utterances displayed a full parse containing semantically tagged rejected words. This is predominately due to our conservative use of this technique in the grammars. We only attempted to tag rejected words as cities in very constrained grammatical environments in order to avoid ascribing incorrect semantic interpretations to rejected words. The careful addition of new grammar rules which generate new semantic interpretations of rejected words in other contexts might allow for further improvements.
4. Dialogue Modeling Issues At this time, we are just beginning to consider the dialogue modeling issues involved in utilizing the confidence scoring techniques that we have presented here. To be more specific, confidence scoring affects two major components of the dialogue manager, hypothesis selection and response planning. In our system we implement hypothesis selection (i.e., the process of selecting the best interpretation of the input utterance) as a process controlled by the dialogue manager. Many different pieces of knowledge should be incorporated into the hypothesis selection component of a system. This information not only includes the confidence scores of word hypotheses and the linguistic scores from the understanding grammar but also the knowledge of any constraints provided by the current dialogue state or by pragmatic considerations. It is thus important to retain as many plausible hypotheses as possible until all relevant information that is available is utilized in the final selection of a hypothesis. In our system, the dialogue manager is the natural place to integrate these many different sources of information. To assist in this goal, our system propagates the confidence scores through the understanding component to the dialogue modeling component. The understanding component is thus capable of generating multiple understanding hypotheses and creating a semantic representation augmented with confidence scores for each hypothesis. To provide an example, Table 5 shows a semantic frame (our
Hazen, Seneff & Polifroni : Recognition Confidence Scoring
19
{c wh_query :topic {q weather :confidence "4.20" :pred {p in :topic {q city :name "paris" :confidence "0.14" :pred {p in :topic {q state :name "new jersey" :confidence "3.45" } } } } } Table 5: Sample semantic frame augmented with concept-level confidence scores and the key value representation of this frame.
representation for semantic information) whose topics are augmented with confidence scores generated from the words representing each concept. Given a semantic frame augmented with confidence scores, the dialogue modeling component can then evaluate the semantic frame with respect to the current dialogue state and a set of underlying pragmatic constraints. For example, the semantic frame in Table 5, has conflicting city and state information (i.e., there is no city of “Paris” in the state of “New Jersey”). Because the confidence score for “New Jersey” is considerably higher than the score for “Paris” the dialogue manager could assume that “New Jersey” is correct and ignore the city information. Alternatively, the dialogue manager could also search other hypotheses from the understanding component for a more pragmatically plausible hypothesis. A more detailed description of how hypothesis selection is performed in our dialogue manager can be found in (Seneff & Polifroni, 2001). Sometimes no pragmatically plausible hypotheses exist within the word graphs generated by the recognizer. Often the implausibilities are the result of misrecognized words which contain poor confidence scores. As discussed earlier, with the ability of the understanding component to optionally reject word hypotheses with bad confidence scores, it becomes possible for the understanding component to generate new semantic representations that might not be possible from the original set of word hypotheses generated by the recognizer. Specifically, this system might be able to determine the semantic intent of a rejected word from surrounding context without knowing exactly what word was spoken by the user. The response planning component of the dialogue manager can take advantage of this ability by informing the user that it understood the high-level semantic intent of the utterance, but misunderstood some word or words that are important for full understanding. Table 6 shows an example of a case where the system understood that the user was looking for the forecast for some city in New Jersey but could not recognize which city was actually spoken. In this case, the dialogue manager then steers the user towards cities in New Jersey that it actually knows.
Hazen, Seneff & Polifroni : Recognition Confidence Scoring Turn 1:
User: Selected Hyp: Key-Values: System:
Turn 2:
User: Selected Hyp: Key-Values: System:
20
What is the forecast for Paramus Park, New Jersey? what is the forecast for *reject* park new jersey weather: forecast city: *reject* park state: new jersey I may not know the city you’re asking about. I know of the following places in New Jersey: Atlantic City, Camden, Newark, Piscataway, Princeton, and Trenton. Please select one. Piscataway. piscataway city: piscataway In Piscataway today, cloudy, 70 percent chance of rain. High 60, low 42. Can I help you with something else?
Table 6: Example of dialogue sequence spoken to jupiter demonstrating an action taken when the selected word string hypothesis contains a rejected word in the place of a misrecognized content word.
Turn 1:
Turn 2:
User: Selected Hyp: Key-Values: System: User: Selected Hyp: Key-Values: System:
Will the Yankees game be rained out tonight? will the *reject* *reject* be rainfall tonight weather: rain date: tonight What city are you interested in? New York. new york city: new york In New York City tonight, chance of thunderstorms. Can I help you with something else?
Table 7: Example of dialogue sequence spoken to jupiter demonstrating the understanding component’s ability to ignore rejected words and perform a partial parse on only the reliably recognized portion of the utterance.
A second capability that is improved by the use of rejected words in the understanding component is the ability to perform partial parses which ignore rejected words and concentrate on the islands of reliability in the word graph. This allows the understanding component to extract some portion of the user’s intent from the words that the confidence model feels are reliably recognized. The system can then prompt the user to supply additional information to complete the request. Table 7 presents an example demonstrating this capability. In this example the recognizer is unable to find word hypotheses with high confidence for the center portion of the utterance. The understanding component ignores this unreliable portion of the utterance, and focuses on the words rainfall tonight. Although these words are not exactly what the user said, the semantic concepts of “rain” and “tonight” are successfully extracted. The system then prompts the user for the name of a city in order to nudge the user towards a complete query it can answer. After the user responds with a city name, the system is able to provide a reasonable response to the user even though the original query was not completely inside the realm of its domain.
Hazen, Seneff & Polifroni : Recognition Confidence Scoring
21
5. Summary In this paper we have presented a multi-tiered confidence scoring approach which is able to produce confidence scores at the phonetic, word and utterance levels. These techniques have proven to be especially useful when the speech signal contains unknown words or non-lexical artifacts. This is evidenced by the fact that the system correctly detects 72% of the errors introduced by unknown words and 85% of the errors introduced by non-lexical artifacts. By integrating the word and utterance confidence scoring techniques into the understanding component of the jupiter weather information system, we were able to achieve a relative reduction of 35% in the concept error rate of the system. We have also shown several examples of how these confidence scores are used to help the dialogue manager guide the user towards a successful completion of their goal.
6. On-Going & Future Work Currently there are several efforts in our group aimed at improving the robustness of our recognizer. These efforts include the modeling of out-of-vocabulary (OOV) words (Bazzi & Glass, 2000; Chung, 2000) and the modeling of non-speech or noise artifacts (Hazen, Hetherington & Park, 2001). The incorporation of OOV models and non-speech models into our recognizer will affect the confidence scoring techniques that we utilize. We have conducted some preliminary experiments to understand how these techniques can be integrated with our existing confidence scoring module (Hazen & Bazzi, 2001). Early indications imply that these modeling techniques are complementary. Improvements to our confidence scoring techniques are also being investigated within our group. This includes incorporating prosodic features into our confidence scoring model (Wang, 2001), examining more complex classification techniques, and exploring the use of worddependent or word-class-dependent confidence models. We are also continuing to work on improvements to our hypothesis selection mechanisms within the dialogue modeling component of our system with the hope of devising an approach which more tightly couples the various sources of information (acoustic, linguistic, pragmatic, etc.) to help improve our understanding accuracy. One aspect of dialogue modeling research that we did not address in this paper is the issue of user satisfaction. While the end goal of our work is to improve the usability of the system, we have not yet attempted to determine the effects that the various methods we have discussed in this paper have on user satisfaction with our system. A proper comparative user study is the only way to determine the effectiveness of the various strategies for incorporating confidence scores in the dialogue modeling process. Unfortunately, we will have to leave this study to future work.
Hazen, Seneff & Polifroni : Recognition Confidence Scoring
22
Acknowledgements The authors wish to acknowledge the contributions of Jim Glass, Christine Pao, Philipp Schmid, and Simo Kamppari, whose prior work on confidence modeling laid the foundation for the experiments presented in this paper. The authors also wish to thank Theresa Burianek for her contributions to the experiments presented in this paper and to the original version of this paper which appeared in the ISCA ASR2000 Workshop and Tutorial. This research was supported by DARPA under contract N66001-99-1-8904, monitored through Naval Command, Control and Ocean Surveillance Center.
References Bazzi, I. and Glass, J. (2000) Modeling out-of-vocabulary words for robust speech recognition. Proceedings of the International Conference on Spoken Language Processing, Beijing, China, vol. 1, pp. 401–404. Bergen, Z. and Ward, W. (1997). A senone based confidence measure for speech recognition. Proceedings of the European Conference on Speech Communication and Technology, Rhodes, Greece, pp. 819–822. Chase, L. (1997). Word and acoustic confidence annotation for large vocabulary speech recognition. Proceedings of the European Conference on Speech Communication and Technology, Rhodes, Greece, pp. 815–818. Chung, G. (2000). Automatically incorporating unknown words in jupiter. Proceedings of the International Conference on Spoken Language Processing, Beijing, China, vol. 4, pp. 520–523. Cox, S. and Dasmahapatra, S. (1999). A high-level approach to confidence estimation in speech recognition. Proceedings of the European Conference on Speech Communication and Technology, Budapest, Hungary, pp. 41–44. Gillick, L., Ito, Y. and Young, J. (1997). A probabilistic approach to confidence estimation and evaluation. Proceedings of the International Conference on on Acoustics, Speech, and Signal Processing, Munich, pp. 879–883. Glass, J., Chang, J. and McCandless, M. (1996). A probabilistic framework for feature-based speech recognition. Proceedings of the International Conference on Spoken Language Processing, Philadelphia, pp. 2277–2280. Glass, J., Hazen, T. and Hetherington, L. (1999). Real-time telephone-based speech recognition in the jupiter domain. Proceedings of the International Conference on Acoustics, Speech, and Signal Processing, Phoenix, pp. 61–64. Hazen, T., Burianek, T., Polifroni, J. and Seneff, S. (2000). Recognition confidence scoring for use in speech understanding systems. Proceedings of The ISCA ASR2000 Tutorial and Research Workshop, Paris, pp. 213–220.
Hazen, Seneff & Polifroni : Recognition Confidence Scoring
23
Hazen, T. and Bazzi, I. (2001). A comparison and combination of methods for OOV word detection and word confidence scoring. Proceedings of the International Conference on Acoustics, Speech, and Signal Processing, Salt Lake City, pp. 397–400. Hazen, T., Hetherington, I. and Park, A. (2001). FST-based recognition techniques for multi-lingual and multi-domain spontaneous speech. Proceedings of the European Conference on Speech Communication and Technology, Aalborg, Denmark, to appear. Hetherington, L. (1994). A Characterization of the Problem of New, Out-ofVocabulary Words in Continuous-Speech Recognition and Understanding. PhD thesis, MIT. Kamppari, S. (1999). Word and Phone Level Acoustic Confidence Scoring for Speech Understanding Systems. Master’s thesis, MIT. Kamppari, S. and Hazen, T. (2000). Word and phone level acoustic confidence scoring. Proceedings of the International Conference on Acoustics, Speech, and Signal Processing, Istanbul, pp. 1799-2002. Lleida, E. and Rose, R. (1996). Efficient decoding and training procedures for utterance verification in continuous speech recognition. Proceedings of the International Conference on Acoustics, Speech, and Signal Processing, Atlanta, pp. 507–510. Ma, C., Randolph, M., and Drish, J. (2001). A support vector machines-based rejection techniques for speech recognition. Proceedings of the International Conference on Acoustics, Speech, and Signal Processing, Salt Lake City, pp. 381-384. Pao, C., Schmid, P. and Glass, J. (1998). Confidence scoring for speech understanding. Proceedings of the International Conference on Spoken Language Processing, Sydney, pp. 815–818. Polifroni, J., Seneff, S., Glass, J. and Hazen, T. (1998). Evaluation methodology for a telephone-based conversational system. Proceedings of the International Conference on Language Resources and Evaluation, Granada, Spain, pp. 43– 49. Powell, M. (1964) An efficient method of finding the minimum of a function of several variables without calculating derivatives. The Computer Journal, vol 7, pp. 155–162. Rose, R., Yao, H., Riccardi, G., and Wright, J. (2000) Integration of utterance verification with statistical language modeling and spoken language understanding. Speech Communication, vol 34, pp. 321–331.
Hazen, Seneff & Polifroni : Recognition Confidence Scoring
24
Schaaf, T. and Kemp, T. (1997) Confidence measures for spontaneous speech recognition. Proceedings of the International Conference on Acoustics, Speech, and Signal Processing, Munich, pp. 875–878. Seneff, S. (1992). Tina: A natural language system for spoken language applications, Computational Linguistics, vol. 18, no. 1., pp. 61–86. Seneff, S. and Polifroni, J. (2001). Hypothesis selection and resolution in the mercury flight reservation system. Proceedings of the DARPA Human Language Technology Workshop, San Diego, to appear. Sui, M., Gish, H. and Richardson, F. (1997). Improved estimation, evaluation and applications of confidence measures for speech recognition. Proceedings of the European Conference on Speech Communication and Technology. Rhodes, Greece, pp. 831-834. Sui, M. and Gish, H. (1999). Evaluation of word confidence for speech recognition systems. Computer Speech and Language, vol. 13, pp. 299-319. Wang, C. (2001). Prosodic Modeling for Improved Speech Recognition and Understanding. PhD thesis, MIT. Wendemuth, A., Rose, G., and Dolfing, J. (1999). Advances in confidence measures for large vocabulary. Proceedings of the International Conference on Acoustics, Speech, and Signal Processing, Phoenix, pp. 705–708. Weintraub, M., et al. (1997) Neural-network based measures of confidence for word recognition. Proceedings of the International Conference on Acoustics, Speech, and Signal Processing, Munich, pp. 887–890. Williams, G. and Renals, S. (1999). Confidence measures from local posterior probability estimates. Computer Speech and Language, vol. 13, pp. 395–411. Zue, V., et al (2000). Jupiter: A telephone-based conversational interface for weather information. IEEE Transaction on Speech and Audio Processing, vol. 8, no. 1, pp. 85–96.