Hindawi Wireless Communications and Mobile Computing Volume 2018, Article ID 2618045, 9 pages https://doi.org/10.1155/2018/2618045
Research Article Recognition of Daily Human Activity Using an Artificial Neural Network and Smartwatch Min-Cheol Kwon 1
1
and Sunwoong Choi
2
Department of Secured Smart Electric Vehicle, Kookmin University, Seoul 02707, Republic of Korea School of Electrical Engineering, Kookmin University, Seoul 02707, Republic of Korea
2
Correspondence should be addressed to Sunwoong Choi;
[email protected] Received 23 March 2018; Accepted 24 May 2018; Published 13 June 2018 Academic Editor: Dongkyun Kim Copyright © 2018 Min-Cheol Kwon and Sunwoong Choi. This is an open access article distributed under the Creative Commons Attribution License, which permits unrestricted use, distribution, and reproduction in any medium, provided the original work is properly cited. Human activity recognition using wearable devices has been actively investigated in a wide range of applications. Most of them, however, either focus on simple activities wherein whole body movement is involved or require a variety of sensors to identify daily activities. In this study, we propose a human activity recognition system that collects data from an off-the-shelf smartwatch and uses an artificial neural network for classification. The proposed system is further enhanced using location information. We consider 11 activities, including both simple and daily activities. Experimental results show that various activities can be classified with an accuracy of 95%.
1. Introduction As the Internet of Things (IoT) technology advances, various devices have been developed for smart life. The wireless sensor network technology has been used in industrial systems and smart homes [1–3]. Several wearable devices that can collect a large amount of physical activity data from sensors attached to a human body have been developed [4–7]. Human activity recognition (HAR) using wearable devices has been actively investigated for a wide range of applications, including healthcare, sports training, and abnormal behavior detection. Machine learning algorithms have been used to detect various human activities such as walking, running, and sitting using a smartphone as a sensing device [8]. Data regarding exercise motions such as standing triceps extension with a dumbbell and wide-grip bench press with a barbell were obtained using sensors worn on the forearm [9]. Another study classified the daily activities that are beneficial to the bones of premenopausal women [10]. A previous study also classified posture and motion with four accelerometer sensors at sternum, wrist, thigh, and lower leg [11]. Most existing studies focus on simple activities such as walking, running, and sitting wherein whole body movement
is required. It is, however, necessary to classify daily activities such as cooking, eating, and working to realize various applications. Daily human activities were identified in an IoT-enabled smart home equipped with a variety of sensors in a previous study [12]. An activity is characterized by a combination of sensing data obtained from multiple sensors. In this study, we propose an HAR system that collects data from an off-the-shelf smartwatch and uses an artificial neural network for classification. Smartwatches are effective and readily available wearable devices for use in HAR systems. Wrist-worn smartwatches can provide sensitive information on human activity as well as the information on whole body movement. We consider 11 activities such as walking, cooking, and working in this work. If we accurately predict the activity of the user, we can improve energy efficiency and enhance user convenience. Furthermore, we propose an enhanced HAR system using location information in addition to movement information. We expect this enhancement to improve classification performance since certain human activities can be done only in certain locations. For example, if the individual is located at a public transportation location, cooking is an activity that can be ruled out as a possible interpretation of the sensor data.
2
Wireless Communications and Mobile Computing Table 1: 11 Activities.
Location
The types of activity Office work, Reading, Writing, Taking a rest, Playing a Office computer game Kitchen Eating, Cooking, Washing dishes Outdoors Walking, Running, Taking a transport
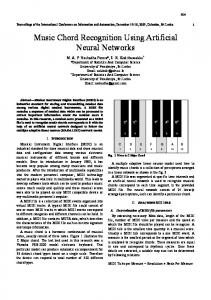
Figure 1: Overall system.
The rest of the study is organized as follows. In Section 2, we describe the motivation of our work. In Section 3, we explain the system overview, and we propose a novel classification scheme for classifying various human activities in Section 4. In Section 5, we evaluate the performance of the proposed classification scheme. The conclusions are given in Section 6.
2. Approach
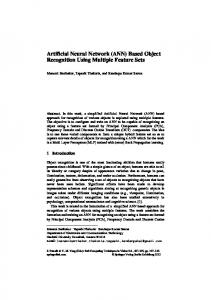
Figure 2: Smartwatch app.
Smartwatches are one of the most familiar and most widely used wearable devices. According to Strategy Analytics [13], global smartwatch shipments in the first quarter of 2016 amounted to 4.2 million and occupied 62.4% market share of wearable devices in 2016. Smartwatches are well suited for gathering data that can classify user activities in realtime, as it is used by many people and is constantly worn on the body. A wrist-worn smartwatch provides more sensitive information on user behavior than a smartphone in a pocket. Since it is likely that a typical user wears the smartwatch on the wrist of the dominant hand, it can sense the movements of that hand. We use the accelerometer in smartwatches for classifying human activities. In HAR research, both gyroscopes and accelerometers are usually used to classify activities. However, there is little improvement performance between using both sensors and using only an accelerometer [14]. Moreover, the accelerometer is embedded in most wearable devices and smartphones. Thus, the proposed system uses acceleration data. We also propose the use of location information. Certain human activities can be done only in certain locations. For example, office work takes place in the office but cooking does in the kitchen. By using the location information as a feature, we can set up more detailed classifiers according to the location and thus can improve performance. In this study, we consider three locations and 11 activities, as shown in Table 1. First, we consider five activities in offices: office work, reading, writing, taking a rest, and playing a computer game. Office work includes writing e-mail, coding, and writing a document on a computer. Second, we consider three activities in kitchens: eating, cooking, and washing dishes. Finally, we consider three outdoors activities: walking, running, and taking a transport. Transportation includes taking a bus or riding in a subway.
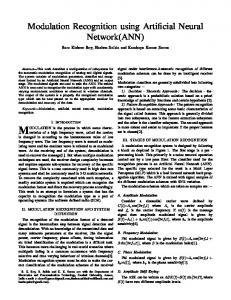
A user wears a smartwatch on his dominant hand, which collects data from the acceleration sensor. A smartphone gathers the sensor data from the smartwatch via Bluetooth communication and then transmits the data to a server. The server processes the collected data and classifies the activities using machine learning algorithms. A smartwatch application was developed to collect data values of the acceleration on the x, y, and z axes. Moreover, the user chooses an activity label from a list of available activities on the application before starting the activity, as shown in Figure 2. This ensures that the sensing data are classified accordingly and these labels are used for training the classifiers. A data capture is operated by the start/stop button on the smartwatch application interface. During the data capture, sensor data from the smartwatch are collected and sent to a smartphone. We assume that users do not perform multiple activities at the same time. After collecting the data of acceleration and activity, the smartwatch transmits data to a smartphone by Bluetooth communication. The smartphone provides a bridge for the data between the smartwatch and the server. The server has three roles: data storage, feature extraction, and classification. The data from the smartwatch and phone are saved on the server. This data are used to extract features for classification. The server makes datasets for HAR in the feature extraction stage. This dataset is used for training and testing the classifier. To evaluate the performance of the proposed system, we used an Apple Watch Series 2 and an Apple iPhone 6. The server, running the CentOS, is equipped with Intel Xeon E5-2630 v 2.2Ghz CPU 2EA, 256GB RAM, and GTX1080Ti GPU 4EA. We designed the proposed classifier based on Tensorflow [15], which is an open-source software library for machine learning.
3. System Overview
4. HAR System
3.1. System Structure. The proposed system comprises a smartwatch, smartphone, and server, as shown in Figure 1.
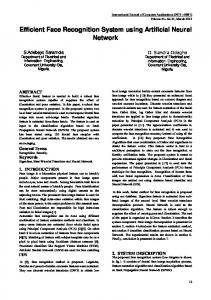
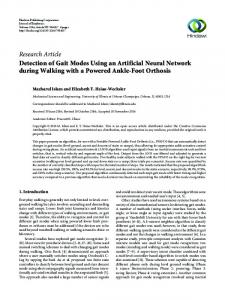
In this section, we explain the proposed HAR system in detail, as shown in Figure 3. We designed two models.
Wireless Communications and Mobile Computing
3
X Temporal segmentation
Y
Feature extraction
Classifier
Activities
Z (a) w/o location model
X
#F;MMCfi?L /ffi=?
Y
Temporal segmentation
Z
Feature extraction
#F;MMCfi?L +CN=B?H
location
Activities
#F;MMCfi?L /ON>IILM
Location (b) w/ location model
Figure 3: Proposed HAR system. → Dt
→ Dt+1
→ Dt
→ Dt+2
X
X
Y
Y
Z
Z
Δt
Δt
Δt
(a) Nonoverlapping window
Δt
→ Dt+1
→ Dt+2
→ Dt+3
→ Dt+4
Δt
Δt
Δt
Δt
(b) Overlapping window
Figure 4: Sliding window.
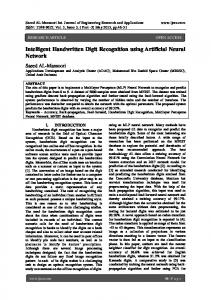
Figure 3(a) shows a basic model that uses only acceleration sensor data. Figure 3(b) shows a model that uses location information in addition to the acceleration sensor data. Use of the location information allows for more appropriate, specific, and detailed classifiers. 4.1. Temporal Segmentation. Acceleration data measured in smartwatch are divided into time segments before extraction [14]. The sliding window technique is widely used and has been proven effective for handling streaming data [16, 17]. Figure 4 shows two schemes with an example of segmenting the accelerometer signal, where X, Y, and Z represent the three components of a triaxial acceleration sensor. All of time → interval is the same as Δt. Δt is defined as the window size. D 𝑡
refers to the readings of X, Y, and Z in the period of time [t, → → t + Δt]. In the case of nonoverlap, D 𝑡 and D 𝑡+1 come from different periods of time, as shown in Figure 4(a). For the → → overlapping situation, D 𝑡 and D 𝑡+1 share parts of the sensor readings. We use the overlapping window method because it generally has better smoothness than the nonoverlapping window method when handling continuous data. The two adjacent time windows overlap by 50%. 4.2. Feature Extraction. In this section, we explain the feature extraction. The features are very important in our machine learning model because their configuration changes the output based on six types of grouped streaming data.
4
Wireless Communications and Mobile Computing
We extract informative features from each time window. For each time window, we extract a single feature vector f as follows: → → → 𝑓 = (mean ( D 𝑡 (X)) , mean ( D 𝑡 (Y)) , mean ( D 𝑡 (Z)) , → → → std ( D 𝑡 (X)) , std ( D 𝑡 (Y)) , std ( D 𝑡 (Z)))
(1)
→ → → where D 𝑡 (X), D 𝑡 (Y), and D 𝑡 (Z) represent the acceleration vector of an axis X, Y, and Z, respectively. We calculate the average and standard deviation of each axis of the triaxial accelerometer as features for machine learning algorithm. The average value is a good indicator of the extent to which each axis value of the acceleration sensor is measured for each activity. The standard deviation is a useful measure to quantify the amount of variation or dispersion of a set of activity data. The active degree of the activity can be predicted by using the standard deviations. 4.3. Classifier. The feature vector of the time window is used as the input to the classifier. We consider two models: one uses only acceleration sensor data, as shown in Figure 3(a), and the other uses the location information as well, as shown in Figure 3(b). Using location information, a more specific and detailed location-based classifier can be applied. There are well-known ways to obtain location information indoors [18, 19] and outdoors [20, 21]. In this study, however, the location information is not collected from the system and derived from the type of activities. For example, if the activity label of the time window is cooking, the location information is derived to kitchen. We consider three locations: office, kitchen, and outdoors. In real life, the location information can be collected from GPS and indoor positioning system. The classifier is designed by a multilayer perceptron which is a class of feedforward artificial neural network (ANN). Weight is initialized using Xavier algorithm [22] and bias is initialized randomly. We use ReLU as the activation function. Xavier and ReLU are commonly used algorithms to reduce the learning time in the field of ANN. The mean value of cross entropy is used for the cost function. The learning rate is set to 0.01, and the Adam optimizer [23] is used since it is known to achieve good results fast.
5. Performance Evaluation 5.1. Experiment Dataset. Table 2 is an overview of the dataset used in this study. The dataset, which has been deposited on the website http://ncl.kookmin.ac.kr/HAR/, was collected from two volunteers who performed activities using a smartwatch attached on the wrist of their dominant hand for four weeks. The accelerometer worked at a sampling rate of 10 Hz. The task was to distinguish the following eleven activities. The dataset was preprocessed and segmented with the sliding window, which was variable in one experiment, 10 s long in other experiments, and had fifty percent overlap between two adjacent segments. We extract a range of features associated with the accelerometer. In all experiments, we used a 5-fold validation algorithm for reliability.
Table 2: The number of raw data. Class A1 A2 A3 A4 A5 A6 A7 A8 A9 A10 A11
Activity Office work Reading Writing Taking a rest Playing a game Eating Cooking Washing dishes Walking Running Taking a transport Total
Total 62711 36976 27677 31265 51906 46155 10563 10712 25768 6452 28483 338671
5.2. Performance Measures. For the effective performance evaluation of the proposed system, we used the following four indicators: accuracy, precision, recall, and F1-score. Table 3 and Equations (2) to (5) show how accuracy, precision, recall, and F1-score are derived, respectively. These four expressions are the most frequently used performance indicators for machine learning models. Accuracy =
(𝑇𝑃 + 𝑇𝑁) (𝑇𝑃 + 𝑇𝑁 + 𝐹𝑃 + 𝐹𝑁)
(2)
Precision =
(𝑇𝑃) (𝑇𝑃 + 𝐹𝑃)
(3)
Recall =
(𝑇𝑃) (𝑇𝑃 + 𝐹𝑁)
(4)
F1-Score = 2 ∗
(𝑃𝑟𝑒𝑐𝑖𝑠𝑖𝑜𝑛 ∗ 𝑅𝑒𝑐𝑎𝑙𝑙) (𝑃𝑟𝑒𝑐𝑖𝑠𝑖𝑜𝑛 + 𝑅𝑒𝑐𝑎𝑙𝑙)
(5)
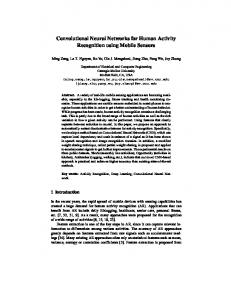
5.3. Effect of Location Information. The experiment tests and evaluates two models: one using the dataset with location information and the other using the dataset without location information. Figure 5 shows the accuracy of each activity of the two models. We observe that the model that does not use location information is less accurate than the model that uses it. On average, the model with location information shows an accuracy of 95% and the model without location information does 90%. The proposed activity classification model is designed as a 5-level layer ANN. The window size is set to 10 s. We used a 5-fold validation algorithm to increase confidence in the results. The following is a more detailed analysis of the experimental results of the two models. Tables 4 and 5 show the results of the two models on a confusion matrix. We observe that the model using location information wrongly attributed only the activities possible at the same location, whereas the model without location information misattributions can extend to other activities in different locations. First, we evaluate the result of the model that does not use location information. In Table 4, the A11 activity is identified with the least accuracy. A11 activity is particularly confused with A4
Wireless Communications and Mobile Computing
5
Table 3: Confusion matrix of two-class classification. True condition Total population
Condition positive True Positive (TP) False Negative (FN)
Predicted condition positive Predicted condition Predicted condition negative
Condition negative False Positive (FP) True Negative (TN)
Table 4: Confusion matrix of w/o model. Actual Class
Predicted Class Kitchen
Office A1
A2
A3
A4
A5
A6
A7
Outdoors A8
A9
A10
A11
A1
87.20
0.54
0.47
0.97
3.73
0.17
0.00
0.00
0.00
0.00
6.92
A2 A3
1.71 1.27
93.39 1.56
0.40 88.53
0.00 0.00
2.91 0.60
1.48 0.52
0.00 0.00
0.00 0.07
0.00 0.00
0.00 0.00
0.11 7.45
A4 A5
2.84 3.59
0.00 0.08
0.07 0.12
95.82 0.04
0.00 93.02
0.00 0.08
0.00 0.00
0.00 0.00
0.00 0.00
0.00 0.00
1.27 3.08
A6
1.47
0.43
0.24
0.09
0.19
96.55
0.05
0.00
0.00
0.00
0.99
A7 A8
0.00 0.00
0.00 0.00
0.00 0.00
0.00 0.00
0.00 0.00
3.09 0.78
83.85 6.23
12.37 88.91
0.00 0.19
0.00 0.00
0.69 3.89
A9 A10 A11
0.00 0.00 13.70
0.00 0.00 2.26
0.00 0.00 6.63
0.00 0.00 2.19
0.00 0.00 6.49
0.00 0.00 2.19
0.00 0.00 0.07
0.00 0.00 0.73
100.00 0.00 0.00
0.00 100.00 0.00
0.00 0.00 65.74
We have confirmed through this experiment that our proposed model can classify daily activities as well as simple activities. In addition, it is confirmed that location information is very helpful to classify activities. We classify activities in daily life with an accuracy of about 95%.
100
Percentage
95 90 85 80 75 70 65 60
A1 A2 A3 A4 A5 A6 A7 A8 A9 A10 A11 avg Activities w/o Location w/ Location
Figure 5: The average of accuracy of each model.
and A5. A7 and A8 are confused with each other. Moreover, we can confirm that A1 and A3 are much confused with A2 and A4. In Table 5, the result of the model using location information shows that the prediction accuracy of A11, which was confused with A4 and A5, is improved. However, because A7 and A8 have the same location information, they are still confused. All of the other activities are less confused with activities in other locations and the accuracy shows improvement.
5.4. Effect of the Number of Layers. The following is the performance analysis according to the number of layers. Figure 6 shows a graph indicating the performance for each model according to the number of layers. The performance increases toward the 5-level layer and decreases again as the layer level becomes deeper than the 5-level layer. This pattern is not related to the location data; it seems to be a feature of the ANN. Level models that are too shallow do not learn effectively, and too much depth is not effective because the number of levels required for learning is too great. The 5-level layer model works best for both cases, with and without location information, yielding accuracies of 96% and 91%, respectively. When the model uses location information, the performance of the 3-, 4-, 5-, 6-, and 7-level layer models are all above about 95%, which is high enough. Without location information, 4-, 5-, and 6-level layer models are all above about 90%. 5.5. Effect of the Window Size. In this experiment, we initialized the window size at 1, 5, 10, 30, 60 (1 min), 120 (2 min), 180 (3 min), and 240 (4 min), and the prediction rate of each window size was examined. Figure 7 shows a graph of the performance according to the window size of the model based on the 5-level layer model, which yielded the best
6
Wireless Communications and Mobile Computing Table 5: Confusion matrix of w/ model.
Actual Class A1 92.95 1.37 1.12 5.15 3.67 -
A4 0.34 0.00 0.22 94.85 0.00 -
A5 4.87 2.39 0.60 0.00 95.51 -
Predicted Class Kitchen A6 A7 99.81 0.00 2.06 82.47 0.58 7.00 -
100
100
95
95
90
90 Percentage
Percentage
A1 A2 A3 A4 A5 A6 A7 A8 A9 A10 A11
A2 1.04 95.04 0.89 0.00 0.51 -
Office A3 0.81 1.20 97.17 0.00 0.27 -
85
80
75
75
1
2
Accuracy Precision
3
4 5 6 The number of layer
7
8
9
Recall F1-Score
(a) w/o model result as number of layer
A9 100.00 0.00 0.15
Outdoors A10 0.00 100.00 0.00
A11 0.00 0.00 99.85
85
80
70
A8 0.19 15.46 92.41 -
70
1
2
3
Accuracy Precision
4 5 6 The number of layer
7
8
9
Recall F1-Score
(b) w/ model result as number of layer
Figure 6: The average of accuracy of each model.
performance in the previous results. Figure 7(a) shows the result based on the data set without location information, and Figure 7(b) shows the result using the location information. Window size is the unit by which the prediction model is based on classifying activity. In other words, it is necessary to have data corresponding to the window size to determine the activity. A smaller window size increases the prediction rate but decreases the prediction accuracy; however, while a larger window size would increase the accuracy at the cost of rate, there is a limit: beyond a certain window size, the accuracy could be negatively impacted due to overlap with other behaviors, which could confound the results. Herein, we quantify effective window sizes. When the window size is less than 3 s (1 s, 0.5 s), the prediction speed is very fast but the accuracy is very low. When the window size is more than one minute (2, 3, 4, and 5 min), the prediction speed is very slow and the accuracy does not increase any further. Therefore, we judge 10 s as the optimal window
size, which balances the inversely proportional parameters: predicted speed and accuracy. 5.6. Comparison with Other Machine Learning Algorithms. Herein, we compare the performance of the most commonly used algorithms in supervised learning: decision tree (DT), random forest (RF), and support vector machine (SVM). This experiment uses a Scikit-learn library, which is a free software machine learning library for the python programming language [24]. Each model finds optimal model parameters through a grid-search function. Classification models are designed with the found model parameters to classify activities in everyday life using the same dataset. Figure 8 shows the result of the machine learning algorithms. Figure 8(a) is the result obtained using dataset without location information. In this study, RF shows the best performance, but ANN imperceptibly lagged behind by RF. The gap of both the models was less than 0.1%. However, the
7
100
100
95
95
90
90
Percentage
Percentage
Wireless Communications and Mobile Computing
85
80
75
85
80
3
5
10 30 Window size(sec)
Accuracy Precision
75
60
3
5
10 30 Window size(sec)
Accuracy Precision
Recall F1-Score
(a) w/o model performance as window size
60
Recall F1-Score
(b) w/ model performance as window size
100
100
95
95
90
90
85
85 Percentage
Percentage
Figure 7: The performance of 5-level layer model as window size.
80 75
80 75
70
70
65
65
60
60
55
DT
Accuracy Precision
SVM
RF Algorithms
ANN
Recall F1-Score
(a) w/o model result of various algorithms
55
DT
SVM
Accuracy Precision
RF Algorithms
ANN
Recall F1-Score
(b) w/ model result of various algorithms
Figure 8: The result of various machine learning algorithms.
other models showed poor performance. The performances of both DT and SVM were less than 75%. These results cannot determine whether the classification model works well. Figure 8(b) shows the result obtained using dataset with location information. Overall, the performance of all the models improved, as shown in Figure 8(a). The performances of DT and SVM were still inferior compared to those of RF and ANN. However, the performances of both models improved by 15%. The performances of the RF and ANN also improved by 5%. When using location information, the best model is ANN. All performance indicators differ by more than 1%.
5.7. Real-Time Evaluation. Figure 9 shows the results of the real-time activity recognition evaluation. We let one participant do seven activities consecutively for 2 min each, and we predict the activity of the subject using the predictive model previously learned by using the total dataset. Figure 9(a) shows the results of using the predictive model learned without using the location information, and Figure 9(b) shows the result of using the predictive model using the location information. Both the models were observed to be confused with completely different activities in the transaction section. This is interpreted as a result of the fact that the data in the
Wireless Communications and Mobile Computing
11 10 9 8 7 6 5 4 3 2 1
Activity
Activity
8
0
1
2
3
4
5
6 7 8 9 10 11 12 13 14 15 Real Time(min)
Real Class Predicted Class
11 10 9 8 7 6 5 4 3 2 1 0
1
2
3
4
5
6 7 8 9 10 11 12 13 14 15 Real Time(min)
Real Class Predicted Class
(a) The result of w/o location dataset
(b) The result of w/ location dataset
Figure 9: Real-time activity recognition test.
corresponding interval may contain two or more patterns when a person performs the action as a continuous action. Cleaned sections are clearly classified as well because they clearly include the characteristics of previous or next actions. When collecting data for this experiment, the subject’s A2 activity pattern tended to be very similar to the A3 activity pattern of the entire data set that model learned. Both classification models confuse A2 activity with A3 activity. It appears that there are many confusing features of A3 activity within the subject's natural A2 activity. Next, each model is divided and evaluated. Figure 9(a) shows the results of a model that does not use location information and is highly confused with the A3 and A2 activities. In particular, A3 activity is confused with activities at other locations such as A6 and A11. This problem is not observed, as shown in Figure 9(b), when the model uses location information. In Figure 9(a), the prediction rate of A2 is less than 50%, but it is more than 70% in the model using location information. Even if there is a lot of confusing data such as A2, the model using the location information has a higher accuracy by using more detailed classifier. When the model is designed using the epoch, window size, and layer level as determined in the previous experiment, it is possible to confirm a considerably high prediction rate in an experiment that recognizes human activities in realtime. Consecutive activities of a person are difficult to define in terms of a single activity. Therefore, the problem of low accuracy in the transaction section is difficult to solve because the definition of activity is not accurate. In contrast, the problem of confusing A2 with A3 seems to need to be overcome by reducing the overfitting problem and adding new features or designing a model that take into account various activity patterns.
information can enhance the performance of the system. We considered 11 activities, including both simple activities and daily activities and our experimental results showed that various activities can be classified with an accuracy of 95%. Energy efficiency can be improved by using the proposed system as it can accurately predict the user’s activity, consume only the energy required for the activity, and decrease wastage of energy. Moreover, the proposed system can enhance convenience. For example, after the system predicts the user's activity, it turns off the light when the user is lying in bed.
Data Availability The raw data is available at “https://www.dropbox.com/s/ x4n1za8zo3oe8eg/rawData.csv?dl=0” or from the corresponding author upon request.
Conflicts of Interest The authors declare that there are no conflicts of interest regarding the publication of this paper.
Acknowledgments This work was supported by the National Research Foundation of Korea (NRF) grant funded by the Korean Government (MSIP) (no. 2016R1A5A1012966).
References [1] O. C. Ann and L. B. Theng, “Human activity recognition: A review,” in Proceedings of the 4th IEEE International Conference on Control System, Computing and Engineering, ICCSCE 2014, pp. 389–393, mys, November 2014.
6. Conclusion
[2] Y. LeCun, Y. Bengio, and G. Hinton, “Deep learning,” Nature, vol. 521, no. 7553, pp. 436–444, 2015.
In this study, we proposed a HAR system using an off-theshelf smartwatch and ANN. We also showed that the location
[3] J. Gubbi, R. Buyya, S. Marusic, and M. Palaniswami, “Internet of Things (IoT): a vision, architectural elements, and future
Wireless Communications and Mobile Computing
[4] [5]
[6]
[7]
[8]
[9]
[10]
[11]
[12]
[13]
[14]
[15] [16]
[17]
[18]
[19]
directions,” Future Generation Computer Systems, vol. 29, no. 7, pp. 1645–1660, 2013. M. Billinghurst, “New ways to manage information,” The Computer Journal, vol. 32, no. 1, pp. 57–64, 1999. L. D. Xu, W. He, and S. Li, “Internet of things in industries: a survey,” IEEE Transactions on Industrial Informatics, vol. 10, no. 4, pp. 2233–2243, 2014. A. Al-Fuqaha, M. Guizani, M. Mohammadi, M. Aledhari, and M. Ayyash, “Internet of things: a survey on enabling technologies, protocols, and applications,” IEEE Communications Surveys & Tutorials, vol. 17, no. 4, pp. 2347–2376, 2015. M. A. Case, H. A. Burwick, K. G. Volpp, and M. S. Patel, “Accuracy of smartphone applications and wearable devices for tracking physical activity data,” The Journal of the American Medical Association, vol. 313, no. 6, pp. 625-626, 2015. X. Yin, W. Shen, J. Samarabandu, and X. Wang, “Human activity detection based on multiple smart phone sensors and machine learning algorithms,” in Proceedings of the 19th IEEE International Conference on Computer Supported Cooperative Work in Design, CSCWD 2015, pp. 582–587, ita, May 2015. T. T. Um, V. Babakeshizadeh, and D. Kulic, “Exercise motion classification from large-scale wearable sensor data using convolutional neural networks,” in Proceedings of the 2017 IEEE/RSJ International Conference on Intelligent Robots and Systems (IROS), pp. 2385–2390, Vancouver, BC, September 2017. V. H. Stiles, P. J. Griew, and A. V. Rowlands, “Use of accelerometry to classify activity beneficial to bone in premenopausal women,” Medicine & Science in Sports & Exercise, vol. 45, no. 12, pp. 2353–2361, 2013. F. Foerster, M. Smeja, and J. Fahrenberg, “Detection of posture and motion by accelerometry: a validation study in ambulatory monitoring,” Computers in Human Behavior, vol. 15, no. 5, pp. 571–583, 1999. P. Kodeswaran, R. Kokku, M. Mallick, and S. Sen, “Demultiplexing activities of daily living in IoT enabled smarthomes,” in Proceedings of the 35th Annual IEEE International Conference on Computer Communications, IEEE INFOCOM 2016, usa, April 2016. https://www.strategyanalytics.com/strategy-analytics/news/strategyanalytics-press-releases/-in-servicecategories/servicecategories/Wearables. A. Wang, G. Chen, J. Yang, S. Zhao, and C.-Y. Chang, “A Comparative Study on Human Activity Recognition Using Inertial Sensors in a Smartphone,” IEEE Sensors Journal, vol. 16, no. 11, pp. 4566–4578, 2016. https://www.tensorflow.org. N. C. Krishnan and D. J. Cook, “Activity recognition on streaming sensor data,” Pervasive and Mobile Computing, vol. 10, pp. 138–154, 2014. O. Banos, J.-M. Galvez, M. Damas, H. Pomares, and I. Rojas, “Window size impact in human activity recognition,” Sensors, vol. 14, no. 4, pp. 6474–6499, 2014. Z. Chen, H. Zou, H. Jiang, Q. Zhu, Y. C. Soh, and L. Xie, “Fusion of WiFi, smartphone sensors and landmarks using the kalman filter for indoor localization,” Sensors, vol. 15, no. 1, pp. 715–732, 2015. M. Werner, M. Kessel, and C. Marouane, “Indoor positioning using smartphone camera,” in Proceedings of the International Conference on Indoor Positioning and Indoor Navigation (IPIN ’11), pp. 1–6, September 2011.
9 [20] I. A. Getting, “The global positioning system,” IEEE Spectrum, vol. 30, no. 12, pp. 36–47, 1993. [21] R. Jafri and S. A. Ali, “A GPS-Based Personalized Pedestrian Route Recording Smartphone Application for the Blind,” in HCI International 2014 - Posters’ Extended Abstracts, vol. 435 of Communications in Computer and Information Science, pp. 232– 237, Springer International Publishing, Cham, 2014. [22] X. Glorot and Y. Bengio, “Understanding the difficulty of training deep feedforward neural networks,” in Proceedings of the Thirteenth International Conference on Artificial Intelligence and Statistics, 2010. [23] P. K. Diederik and J. Ba, “Adam: A Method for Stochastic Optimization,” https://arxiv.org/abs/1412.6980. [24] F. Pedregosa, G. Varoquaux, and A. Gramfort, “Scikit-learn: machine learning in Python,” Journal of Machine Learning Research, vol. 12, pp. 2825–2830, 2011.
International Journal of
Advances in
Rotating Machinery
Engineering Journal of
Hindawi www.hindawi.com
Volume 2018
The Scientific World Journal Hindawi Publishing Corporation http://www.hindawi.com www.hindawi.com
Volume 2018 2013
Multimedia
Journal of
Sensors Hindawi www.hindawi.com
Volume 2018
Hindawi www.hindawi.com
Volume 2018
Hindawi www.hindawi.com
Volume 2018
Journal of
Control Science and Engineering
Advances in
Civil Engineering Hindawi www.hindawi.com
Hindawi www.hindawi.com
Volume 2018
Volume 2018
Submit your manuscripts at www.hindawi.com Journal of
Journal of
Electrical and Computer Engineering
Robotics Hindawi www.hindawi.com
Hindawi www.hindawi.com
Volume 2018
Volume 2018
VLSI Design Advances in OptoElectronics International Journal of
Navigation and Observation Hindawi www.hindawi.com
Volume 2018
Hindawi www.hindawi.com
Hindawi www.hindawi.com
Chemical Engineering Hindawi www.hindawi.com
Volume 2018
Volume 2018
Active and Passive Electronic Components
Antennas and Propagation Hindawi www.hindawi.com
Aerospace Engineering
Hindawi www.hindawi.com
Volume 2018
Hindawi www.hindawi.com
Volume 2018
Volume 2018
International Journal of
International Journal of
International Journal of
Modelling & Simulation in Engineering
Volume 2018
Hindawi www.hindawi.com
Volume 2018
Shock and Vibration Hindawi www.hindawi.com
Volume 2018
Advances in
Acoustics and Vibration Hindawi www.hindawi.com
Volume 2018