Procedia Computer Science Procedia Computer Science 01 (2010) 1–9
1st Workshop on Recommender Systems for Technology Enhanced Learning
Recommender System for Predicting Student Performance Nguyen Thai-Nghe∗, Lucas Drumond∗, Artus Krohn-Grimberghe∗, Lars Schmidt-Thieme∗ Information Systems and Machine Learning Lab, University of Hildesheim, 31141 Hildesheim, Germany
Abstract Recommender systems are widely used in many areas, especially in e-commerce. Recently, they are also applied in e-learning tasks such as recommending resources (e.g. papers, books,..) to the learners (students). In this work, we propose a novel approach which uses recommender system techniques for educational data mining, especially for predicting student performance. To validate this approach, we compare recommender system techniques with traditional regression methods such as logistic/linear regression by using educational data for intelligent tutoring systems. Experimental results show that the proposed approach can improve prediction results. Keywords: recommender systems, matrix factorization, educational data mining, student performance prediction,
1. Introduction Recommender systems are widely used in many areas, especially in e-commerce (Rendle et al. [1], Koren et al. [2]). Recently, researchers have applied this approach in e-learning, especially in technology enhanced learning (Manouselis et al. [3]). Recommender systems are used in technology enhanced learning for recommending materials/resources (e.g. papers, books, hyperlinks,. . . ) (Za´ıane [4], Tang and McCalla [5], Ghauth and Abdullah [6], Luo et al. [7]), course enrollment (OMahony and Smyth [8], Garc´ıa et al. [9]) and more (Ghauth and Abdullah [6], Manouselis et al. [3]) to the learners in both formal and informal learning environment (Drachsler et al. [10]). On the other side, educational data mining has also been taken into account recently. Since the universities desire to improve their educational quality, the usage of data mining in higher education to help the universities, instructors, and students to improve their performance has become more and more attractive to both university managers and researchers. For example, to help improving the student performance, some research questions should be explored such as how the students learn (e.g. generally or narrowly)? How quickly or slowly the students adapt with the new problems? Is it possible to infer the knowledge requirements to solve the problems directly from student performance data? (Feng et al. [11]). Cen et al. [12] have shown that an improved model in predicting student performance could save millions of hours of students’ time (and effort) in learning algebra. In that time, students can be moving on in math and science or doing other things they enjoy. Moreover, many universities are extremely focused on assessment, thus, the pressure on “teach to the test” leads to a significant amount of time spending for preparing and taking standardized tests, so any advances which allow us authors. Telephone: +49 5121 883-850. Fax: +49 5121 883-859 Email addresses:
[email protected] (Nguyen Thai-Nghe),
[email protected] (Lucas Drumond),
[email protected] (Artus Krohn-Grimberghe),
[email protected] (Lars Schmidt-Thieme) ∗ Corresponding
N. Thai-Nghe, L. Drumond, A. Krohn-Grimberghe, and L. Schmidt-Thieme / Procedia Computer Science 01 (2010) 1–9
2
to reduce the role of standardized tests hold the promise of increasing deep learning (Feng et al. [11]). In educational data mining viewpoint, a good model which accurately predicts student performance could replace some current standardized tests. To address the student performance prediction problem, many works have been published but most of them rely on classification/regression methods such as Bayesian networks (Bekele and Menzel [13], Thai-Nghe et al. [14]), logistic regression (Cen et al. [12]), linear regression (Feng et al. [11]), decision trees (Thai-Nghe et al. [15], Romero et al. [16]), neural networks (Romero et al. [16]), or support vector machines (Thai-Nghe et al. [14]). As far as we know, recommender systems, especially matrix factorization methods, have not been used in this area. Moreover, as summarized in Manouselis et al. [3], the current status of recommender systems in technology enhanced learning still lacks systematic evaluation studies in the context of real-life applications as well as experimental investigation of the recommendation algorithms, and also lacks specific data sets for informal and formal learning (Drachsler et al. [10]). This work proposes a novel approach which applies recommender system techniques for predicting student performance. Although we use data from the Knowledge Discovery and Data Mining Challenge, we do not focus on the competition but on getting the real educational data from this event and employing recommender system techniques in e-learning. The contributions of this work are: • applying recommender system techniques such as matrix factorization in the educational context, especially for predicting student performance; • researching the mapping of educational data (student performance data in this case) to user-item-rating triples used in recommender systems; • comparing recommender systems with traditional techniques such as linear regression or logistic regression. From the experimental perspective, we show that recommender systems in general and matrix factorization in particular perform nicely among the other methods. The rest of the paper is organized as follows. Section 2 introduces some related works; section 3 formulates the student performance prediction using recommender system approach; section 4 briefly introduces recommender systems and their techniques which are used in this study; section 5 describes data sets and the proposed methods including method for mapping educational data to recommender systems and to traditional regression problem; section 6 shows the experimental results; and finally, section 7 concludes. 2. Related Work As surveyed in Manouselis et al. [3], many recommender systems have been deployed in technology enhanced learning. Concretely, Garc´ıa et al. [9] uses association rule mining to discover interesting information through student performance data in the form of IF-THEN rules, then generating the recommendations based on those rules; Bobadilla et al. [17] proposed an equation for collaborative filtering which incorporated the test score from the learners into the item prediction function; Ge et al. [18] combined the content-based filtering and collaborative filtering to personalize the recommendations for a courseware selection module; Soonthornphisaj et al. [19] applied collaborative filtering to predict the most suitable documents for the learners; while Khribi et al. [20] employed web mining techniques with content-based and collaborative filtering to compute the relevant links for recommending to the learners. In predicting student performance, Romero et al. [16] compared different data mining methods and techniques to classify students based on their Moodle usage data and the final marks obtained in their respective courses; Bekele and Menzel [13] used Bayesian Networks to predict student results; Cen et al. [12] proposed a method for improving a cognitive model, which is a set of rules/skills encoded in intelligent tutors to model how students solve problems, using logistic regression; Thai-Nghe et al. [15] analyzed and compared some classification methods (e.g. decision trees and Bayesian networks) for predicting academic performance; while Thai-Nghe et al. [14] proposed to improve the student performance prediction by dealing with the class imbalance problem. (i.e., the ratio between passing and failing students is usually skewed). Different from the literature, instead of using traditional classification or regression methods, we propose using state of the art techniques in recommender systems (e.g. matrix factorization) for predicting student performance.
N. Thai-Nghe, L. Drumond, A. Krohn-Grimberghe, and L. Schmidt-Thieme / Procedia Computer Science 01 (2010) 1–9
3
3. Problem Formulation Computer-aided tutoring systems allow students to solve some problems (exercises) with a graphical frontend that can automate some tedious tasks, provide some hints and provide feedback to the student. Such systems can profit from anticipating student performance in many ways, e.g., in selecting the right mix of exercises, in choosing an appropriate level of difficulty and in deciding about possible interventions such as hints. The problem of student performance prediction in computer-aided tutoring systems means to predict the likely performance of a student for some exercises (or part thereof such as for some particular steps). Computer-aided tutoring systems allow to collect a rich amount of information about how a student interacts with the tutoring system and about his past successes and failures. Usually, such information is collected in a clickstream log with an entry for every action the student takes. The clickstream log contains information about “time, student, context, action” For performance prediction such click streams can be aggregated to the task for which the performance should be predicted and eventually be enriched with additional information. For example, if the aim is to predict the performance for each single step in a problem, then all actions in the clickstream log belonging to the same student and problem step will be aggregated to a single transaction and enriched e.g., with some performance metrics such as if the step was done correctly: “step no., student, context, actions, duration, correct” Part of the context describes the task the student should solve. More formally, let S be a set of student IDs, T be a set of task IDs and, f ⊆ R be a performance measure, then D ⊆ (S × T × f ) is the triple data collected from the computer-aided tutoring systems. f indicates correct, incorrect or partially correct resolution of the problem. Given s ∈ S and t ∈ T , our problem is to predict f . Obviously, in a recommender system context, s, t, and f would be user, item, and rating, respectively. The recommender system task at hand is thus rating prediction. Consistent with Herlocker et al. [21], ”Annotation in Context” is used, though here the main aim is that the system learns more about (the difficulty of) its tasks and about the users’ expected performance (and thus where help might be appropriate). 4. Recommender System Techniques Traditionally, recommender systems focus on reducing the information overload and act as information filters. The most famous recommender system and indeed one of the first commercial recommender system at all is the Amazon’s “Customers Who Bought This Item Also Bought”. The aim of recommender system is making vast catalogs of products consumable by learning user preferences and applying them to items formerly unknown to the user, thus being able to recommend what has a high likelihood of being interesting to the target user. The two most common tasks in recommender systems are Top-N item recommendation where the recommender suggests a ranked list of (at most) N items i ∈ I to a user u ∈ U and rating prediction where the aim is predicting the preference score (rating) r ∈ R for a given user-item combination. For item recommendation the training data is currently usually unary information on items being viewed, clicked, purchased etc. by the respective users. Rating prediction mainly uses rating information itself as training data. 4.1. Collaborative Filtering In the early days of recommender systems, content was deemed very valuable training data and research data sets contained lots of attribute information for algorithm training. But since the late nineties the so called collaborative filtering approach prevails. Collaborative filtering is based on the assumption that similar users like similar things and, being content-agnostic, focuses only on the past ratings assigned. In this work, we make use of matrix factorization (Rendle and Schmidt-Thieme [22], Koren et al. [2]), which is known to be one of the most successful methods for rating prediction, outperforming other state-of-the-art methods (Bell and Koren [23]).
N. Thai-Nghe, L. Drumond, A. Krohn-Grimberghe, and L. Schmidt-Thieme / Procedia Computer Science 01 (2010) 1–9
4
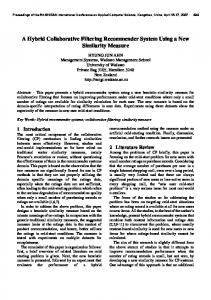
4.2. Matrix Factorization Matrix factorization is the task of approximating a matrix X by the product of two smaller matrices W and H, i.e. X ≈ WH T (Koren et al. [2]). In the context of recommender systems the matrix X is the partially observed ratings matrix, W ∈ RU×K is a matrix where each row u is a vector containing the K latent features describing the user u and H ∈ RI×K is a matrix where each row i is a vector containing the K features describing the item i. Let wuk and hik be the elements of W and H, respectively, then the rating given by a user u to an item i is predicted by: rˆui =
K X
wuk hik = (WH T )u,i
k=1
where W and H are the model parameters and can be learned by optimizing a given criterion using stochastic gradient descent. In this work the model parameters were optimized for root mean squared error (RMSE) rP 2 ui (rui − rˆui ) RMS E = n where n is the number of test cases. 5. Data Sets and Method
Table 1: KDD Challenge 2010 Data sets
Data sets Algebra 2008-2009 train Algebra 2008-2009 test Bridge to Algebra 2008-2009 train Bridge to Algebra 2008-2009 test
Size 3.1 Gb 124 Mb 5.5 Gb 135 Mb
#Attributes 23 23 21 21
#Instances 8,918,054 508,912 20,012,498 756,386
We have used two data sets from the Knowledge Discovery and Data Mining (KDD) Challenge 20101 as described in Table 1. The data sets, originally labeled “Algebra 2008-2009” and “Bridge to Algebra 2008-2009” will be denoted ”Algebra” and ”Bridge” for the remainder of our paper. Each data set is split into a train and a test partition. The data represents the log files of interactions between students and computer-aided-tutoring systems. While students solve math related problems in the tutoring system, their activities, success and progress indicators are logged as individual rows in the data sets. The central element of interaction between the students and the tutoring system is the problem. Every problem belongs into a hierarchy of unit and section. Furthermore, a problem consists of many individual steps such as calculating a circle’s area, solving a given equation, entering the result and alike. Generally, students are not required to solve the steps of a given problem in a special order and, as logged by the field problem view, it is tracked how many times the student already saw this problem. Additionally, for both data sets, Algebra and Bridge, a different number of knowledge components (KC) and associated opportunity counts are provided. Knowledge components represent specific skills used for solving the problem (where available) and opportunity counts encode the number of times the respective knowledge component has been encountered before. Both, knowledge components and opportunity counts are represented in a denormalized way, featuring all knowledge components and their counts in one column. In the training data but not in the test data, incorrects, corrects, and hints track the number of failed or successful attempts on the respective step and the number of times the student requested additional information from the tutoring system. Furthermore, fields such as time information (first transaction time, correct transaction time, ...) are given for the training sets but not for the test sets. Target of the prediction task is the correct first attempt (CFA) information which encodes whether the student successfully completed the given step on the first attempt. As this information is (0,1) encoded but the error measure 1 https://pslcdatashop.web.cmu.edu/KDDCup/
N. Thai-Nghe, L. Drumond, A. Krohn-Grimberghe, and L. Schmidt-Thieme / Procedia Computer Science 01 (2010) 1–9
5
is RMSE of any float value between [0..1] was allowed, the problem may be cast as a regression problem, too. The prediction would then encode the certainty that the student will succeed on the first try. According to the KDD Challenge data format description, ”test rows are determined by a program that randomly selects one problem for each student within a unit, and places all student-step rows for that student and problem in the test file. Based on time, all preceding student-step rows for the unit will be placed in a training file, while all following student-step rows for that unit will be discarded”2 . This way, temporal information is encoded in the train-test-split. The conditions (multiple choice, multiple response, etc.) of the exercises is unknown, but data engineering is possible to some extent as the column descriptions and background information is available for this data set. 5.1. Mapping Educational Data to Recommender Systems In traditional recommender systems settings, it is unambiguous how the available information is mapped to users, items, and ratings, respectively. At least for all major recommender system data sets used (Jester, Movielens 100k, and Netflix) there is a unique assignment3 . There also is an obvious mapping of users and ratings given the KDD Challenge data sets: student ⇒ user correct first attempt ⇒ rating The student becomes the user, and the correct first attempt (CFA) indicator would become the rating, bounded between 0 and 1. With this setting there are no users in the test set that are not present in the training set which simplifies predictions. For mapping the item, several options seemed to be available to us. From the official KDD Challenge dataset description it was immanent that an item was supposed to be the combination (concatenation) of problem hierarchy (PH), problem name (PN), step name (SN), and problem view (PV). Choosing PH-PN-SN-PV as the item had the drawback of incurring the new-item problem into our recommendation task: in the test sets, instances of PH-PN-SNPV would occur that are unavailable in the training set, thus our models would not be able to learn much about them. E.g. for Algebra 24.735 unique step names are not present in train out of a total of 44.730 unique instances; luckily, this affects only 26.378 out of the 508.912 rows in test. Another problem with this approach is that it leads to huge sparsity and to a high number of new items on the test set. For instance, for the algebra dataset this configuration would lead to a total of 1,416,473 items (see Table 2). Since there are 8,918,054 examples on the training set for this dataset one could expect to see, on average, 6 observations per item. To cope with these problems, we considered ignoring the problem view component and started thinking about other possibly valid combinations we could use as an item. Indeed, as shown in section 6 the different mappings yield different results. The authors are not aware of this being reported before in the recommender system literature. Some of the combinations we considered for the item are described below in table 2. Please note that when choosing any of the knowledge component as (part of) an item, ambiguity is introduced as there may be more than one knowledge component of a given kind per training row (with a maximum of 17 ”rule” type knowledge components being applied to one row in Algebra). Furthermore, the knowledge components had a high degree of missing values with 15% of the rows not having a knowledge component. 5.2. Mapping Educational Data to Regression Problem Besides employing recommender technologies, we employed linear and logistic regression on the data sets. As most of the columns available both in train and test were categorical, we needed to pre-process the data before we could regress on it. We mainly derived user/item averages on different target variables as input for our regression models. Based on the formulation in section 3, let D s,t B {(s0 , t0 , f ) ∈ D | s0 = s, t0 = t } be the set of transactions logged for the student s, then the average on task t is determined by P (s,t, f )∈D s,t f |D s,t | 2 https://pslcdatashop.web.cmu.edu/KDDCup/rules 3 The
data format.jsp treatment of users and items usually is symmetric and bears only performance implications.
N. Thai-Nghe, L. Drumond, A. Krohn-Grimberghe, and L. Schmidt-Thieme / Procedia Computer Science 01 (2010) 1–9
6
Table 2: Mapping educational data to User/Item in recommender systems
Algebra User Student
Bridge #User 3,310
User Student
#User 6,043
Item #Item Item #Item PH, PN, SN 1,309,038 PH, PN, SN 593,369 188,001 PH, PG, SN 848,218 PH, PG, SN PG, SN 776,155 PG, SN 155,808 566,843 PN, SN 1,254,897 PN, SN SN 695,674 SN 126,560 PN(*) 188,368 PN(*) 52,754 PG(*) 185,918 PG(*) 52,189 61,848 PH, PN 206,596 PH, PN PH, PG 1,000 PH, PG 1,343 PH 165 PH 186 PH, PN, SN, PV(*) 1,416,473 PH, PN, SN, PV(*) 887,740 PH, PN, PV 220,045 PH, PN, PV 101,707 PH, PG, PV 3,203 PH, PG, PV 5,537 PH, PV 780 PH, PV 1,526 KC-rules(*) 2,979 KC-rules (*) combinations used for the recommender systems experiments. PH: problem hierarchy; PN: problem name (converted to id); SN: step name (converted to id); PV: problem view; KC: knowledge components . In the specific data sets from table 2, the variables we computed the respective averages on are: student ID, step ID, student plus problem view, step plus problem view, problem group (derived by using only the first letters from the problem name), problem name, and student id plus problem group plus problem view. For short, we use the abbreviations A as (Student-Average, Step-Average); B as (Student-PV-Average, Step-PV-Average); and C as (PGAverage, PN-Average, Student-PG-PV-Average). 6. Evaluation Before describing the experimental results, we present the protocol used for evaluation. First of all the data sets were mapped from the educational context to both recommender systems and regression contexts as described in sections 5.1 and 5.2. As baseline method, we use the global average, i.e. predicting the average of the target variable from the training set. The next step was to employ user/item average collaborative filtering and regularized matrix factorization on several data combinations as described below. For this, we use the algorithms implemented in MyMedia open source framework4 . In some data configurations there was the need to deal with the new-item problem. Since matrix factorization cannot produce output for “new items” we provide global average, user average and user-item averages scores for items that are not in the training data. The proposed approach was compared with traditional methods such as logistic regression or linear regression. The experiments with logistic regression were carried out using the A (Student-Average, Step-Average), B (StudentPV-Average, Step-PV-Average), and C (PG-Average, PN-Average, Student-PG-PV-Average) settings described in Section 5.2. 4 http://mymediaproject.codeplex.com/
N. Thai-Nghe, L. Drumond, A. Krohn-Grimberghe, and L. Schmidt-Thieme / Procedia Computer Science 01 (2010) 1–9
7
Since the results of linear regression and logistic regression are very similar, we just report on logistic regression here. As already outlined in Section 5.1, one of the central issues in mapping the student performance prediction to a recommender system problem is determining exactly what set of attributes describes and item in a recommender system setting. The first obvious choice for an item is the set of attributes that uniquely describes a task performed by a user. According to the specification of the data used in this work, such set comprises the Problem Hierarchy (PH), Problem Name (PN), Step Name (SN) and Problem View (PV). We report on the usage of Problem Group (PG) and Problem Name (PN) alone, since with them we eliminate the new item problem and reduce the sparsity. Since the idea of predicting students performance is to find out whether a student has learned the knowledge required to solve a certain task, which is represented by the knowledge components (KC), we also report the results of using KC-rules as an item. The results of using other configurations as “items” did not show significant improvement, so we do not report on them. Student performance is measured by a binary state variable which is 0 if the student was not able to perform the task correctly and 1 otherwise. The models used in this work output values between 0 and 1 indicating how likely the student is to perform the task correctly. Thus, the error is measured in a scale ranging from 0 to 1 where the lower the error the better. Table 3 shows the RMSE scores of the methods evaluated here on several configurations of the data, i.e. linear regression using the settings A, B, and C and the recommender techniques using different attribute sets as an item. The results are reported on both Algebra and Bridge dataset, as well as the average of the scores on both of them. Table 3: Root mean squared error (RMSE) for different methods using different sets of attributes as items
Technique Item Algebra Bridge Average Global Average 0.34316 0.33199 0.33757 User Average 0.33892 0.32843 0.33367 Logistic Regression A 0.32226 0.30456 0.31341 Logistic Regression B 0.32444 0.30589 0.31517 Logistic Regression A+B 0.32354 0.30498 0.31426 Logistic Regression A+B+C 0.31988 0.30583 0.31286 Matrix Factorization PN 0.33752 0.31515 0.32633 Matrix Factorization PG 0.34316 0.33199 0.33757 User-Item Collaborative Filtering PH, PN, SN, PV 0.32240 0.29817 0.31029 Matrix Factorization + Global Average PH, PN, SN, PV 0.31817 0.29825 0.30821 Matrix Factorization + User Average PH, PN, SN, PV 0.31812 0.29865 0.30837 Matrix Factorization + User-Item Collaborative Filtering PH, PN, SN, PV 0.31787 0.29804 0.30796 Matrix Factorization + User-Item Collaborative Filtering KC-rules 0.30228 0.29804 0.30016 The best result is bold faced. A: (Student-Average, Step-Average); B: (Student-PV-Average, Step-PVAverage); C: (PG-Average, PN-Average, Student-PG-PV-Average) We observed that logistic regression outperforms both the user and global average baselines and Matrix Factorization using just PN and PG as an item. Especially one can see that combining settings A, B and C helps to improve the quality of predictions. It also can be seen in Table 3 that using PH, PN, SN and PV together instead of just PG or PN as an item yields better results for both matrix factorization and the collaborative filtering baseline. This has to do with the fact that these four features together describe one single try of one student, thus being more meaningful for predicting his/her performance than just the problem group or the name of the problem he was working on. The best results on the “Algebra” dataset were achieved using only KC-rules as an item (the “Bridge” dataset does not have values for the KC-rules attribute, so we use the previous result). The reason for this is that, in this setting, there are less items (2,979) and the same number of ratings, thus, on average, each user has more ratings (8,918,054/2,979 ≈ 2,993 ratings/user), which means that the algorithms have more data to learn from. Clearly, the proposed method, which employs recommender system techniques to predict the student performance, outperforms the traditional regression methods.
N. Thai-Nghe, L. Drumond, A. Krohn-Grimberghe, and L. Schmidt-Thieme / Procedia Computer Science 01 (2010) 1–9
8
7. Conclusion We propose a novel approach which uses recommender system techniques for educational data mining, especially in predicting student performance. We also propose how to map the educational data to user/item in recommender systems. To validate this approach, we compare recommender system techniques with traditional regression methods such as logistic regression by using educational data. Experimental results show that the proposed approach can improve the prediction results. In future work, we will use stronger methods for dealing with the cold-start problem when using matrix factorization. We will also employ an ensemble model on different combinations of “items”. We recognize that the second time a student is doing his exercises, his performance on average gets better. Thus, tensor factorization (Rendle and Schmidt-Thieme [24]) over student/problem/problem view or, more general, student/problem/time could give better prediction results. Acknowledgments The first author was funded by the “Teaching and Research Innovation Grant” project of Can Tho university, Vietnam. The second author was funded by the CNPq, an institute of the Brazilian government for scientific and technological development. This work was co-funded by the EC FP7 project MyMedia (grant agreement no. 215006) and by the EC ERDF projects LEFOS(grant agreement no. 80028934). We would like to thank Dr. Steffen Rendle and Dr. Tom´asˇ Horv´ath for their fruitful discussions. References [1] S. Rendle, C. Freudenthaler, L. Schmidt-Thieme, Factorizing personalized Markov chains for next-basket recommendation, in: Proceedings of the 19th International Conference on World Wide Web (WWW’10), ACM, New York, USA, 811–820, 2010. [2] Y. Koren, R. Bell, C. Volinsky, Matrix Factorization Techniques for Recommender Systems, IEEE Computer Society Press 42 (8) (2009) 30–37, ISSN 0018-9162. [3] N. Manouselis, H. Drachsler, R. Vuorikari, H. Hummel, R. Koper, Recommender Systems in Technology Enhanced Learning, in: Kantor, P.B., Ricci, F., Rokach, L., Shapira, B. (eds.) 1st Recommender Systems Handbook, Springer-Berlin, 1–29, 2010. [4] O. R. Za´ıane, Building a Recommender Agent for e-Learning Systems, in: ICCE ’02: Proceedings of the International Conference on Computers in Education, IEEE Computer Society, Washington, DC, USA, ISBN 0-7695-1509-6, 55, 2002. [5] T. Tang, G. McCalla, Smart Recommendation for an Evolving E-Learning System: Architecture and Experiment, International Journal on E-Learning 4 (1) (2005) 105–129, ISSN 1537-2456. [6] K. Ghauth, N. Abdullah, Learning materials recommendation using good learners’ ratings and content-based filtering, Educational Technology Research and Development, Springer-Boston (2010) 1042–1629ISSN 1042-1629. [7] J. Luo, F. Dong, J. Cao, A. Song, A context-aware personalized resource recommendation for pervasive learning, Cluster Computing, Springer-Netherlands 13 (2) (2010) 213–239. [8] M. P. OMahony, B. Smyth, A Recommender System for On-line Course Enrolment: An Initial Study, ACM Conference on Recommender System (2007) 973–978. [9] E. Garc´ıa, C. Romero, S. Ventura, C. D. Castro, An architecture for making recommendations to courseware authors using association rule mining and collaborative filtering, User Modeling and User-Adapted Interaction 19 (1-2). [10] H. Drachsler, H. G. K. Hummel, R. Koper, Identifying the Goal, User model and Conditions of Recommender Systems for Formal and Informal Learning, Journal of Digital Information 10 (2). [11] M. Feng, N. Heffernan, K. Koedinger, Addressing the assessment challenge with an online system that tutors as it assesses, User Modeling and User-Adapted Interaction 19 (3) (2009) 243–266, ISSN 0924-1868. [12] H. Cen, K. Koedinger, B. Junker, Learning Factors Analysis A General Method for Cognitive Model Evaluation and Improvement, in: Intelligent Tutoring Systems, vol. 4053, Springer Berlin Heidelberg, ISBN 978-3-540-35159-7, 164–175, 2006. [13] R. Bekele, W. Menzel, A Bayesian Approach to Predict Performance of a Student (BAPPS): A Case with Ethiopian Students, in: Artificial Intelligence and Applications, Vienna, Austria, 189–194, 2005. [14] N. Thai-Nghe, A. Busche, L. Schmidt-Thieme, Improving Academic Performance Prediction by Dealing with Class Imbalance, in: Proceeding of 9th IEEE International Conference on Intelligent Systems Design and Applications (ISDA’09), Pisa, Italy, IEEE Computer Society, 878–883, 2009. [15] N. Thai-Nghe, P. Janecek, P. Haddawy, A Comparative Analysis of Techniques for Predicting Academic Performance, in: Proceeding of 37th IEEE Frontiers in Education Conference (FIE’07), Milwaukee, USA, IEEE Xplore, T2G7–T2G12, 2007. [16] C. Romero, S. Ventura, P. G. Espejo, C. Hervs, Data Mining Algorithms to Classify Students, in: 1st International Conference on Educational Data Mining (EDM’08), Montral, Canada, 8–17, 2008. [17] J. Bobadilla, F. Serradilla, A. Hernando, Collaborative filtering adapted to recommender systems of e-learning, Knowledge-Based Systems 22 (4) (2009) 261–265, ISSN 0950-7051.
N. Thai-Nghe, L. Drumond, A. Krohn-Grimberghe, and L. Schmidt-Thieme / Procedia Computer Science 01 (2010) 1–9
9
[18] L. Ge, W. Kong, J. Luo, Courseware Recommendation in E-Learning System, in: International Conference on Web-based Learning (ICWL’06), 10–24, 2006. [19] N. Soonthornphisaj, E. Rojsattarat, S. Yim-ngam, Smart E-Learning Using Recommender System, in: International Conference on Intelligent Computing, 518–523, 2006. [20] M. K. Khribi, M. Jemni, O. Nasraoui, Automatic Recommendations for E-Learning Personalization Based on Web Usage Mining Techniques and Information Retrieval, in: Proceedings of the 8th IEEE International Conference on Advanced Learning Technologies, IEEE Computer Society, 241–245, 2008. [21] J. L. Herlocker, J. A. Konstan, L. G. Terveen, J. T. Riedl, Evaluating collaborative filtering recommender systems, ACM Transactions on Information Systems 22 (1) (2004) 5–53, ISSN 1046-8188. [22] S. Rendle, L. Schmidt-Thieme, Online-updating regularized kernel matrix factorization models for large-scale recommender systems, in: Proceedings of the ACM conference on Recommender Systems (RecSys’08), ACM, New York, USA, 251–258, 2008. [23] R. M. Bell, Y. Koren, Scalable Collaborative Filtering with Jointly Derived Neighborhood Interpolation Weights, in: Proceedings of the 7th IEEE International Conference on Data Mining (ICDM’07), IEEE CS, Washington, USA, ISBN 0-7695-3018-4, 43–52, 2007. [24] S. Rendle, L. Schmidt-Thieme, Pairwise interaction tensor factorization for personalized tag recommendation, in: Proceedings of the 3th ACM International Conference on Web Search and Data Mining (WSDM 2010), ACM, New York, USA, 81–90, 2010.