Record and Transplay: Partial Checkpointing for Replay Debugging Across Heterogeneous Systems Dinesh Subhraveti
Jason Nieh
Columbia University
[email protected]
Columbia University
[email protected]
ABSTRACT
1. INTRODUCTION
Software bugs that occur in production are often difficult to reproduce in the lab due to subtle differences in the application environment and nondeterminism. To address this problem, we present Transplay, a system that captures production software bugs into small per-bug recordings which are used to reproduce the bugs on a completely different operating system without access to any of the original software used in the production environment. Transplay introduces partial checkpointing, a new mechanism that efficiently captures the partial state necessary to reexecute just the last few moments of the application before it encountered a failure. The recorded state, which typically consists of a few megabytes of data, is used to replay the application without requiring the specific application binaries, libraries, support data, or the original execution environment. Transplay integrates with existing debuggers to provide standard debugging facilities to allow the user to examine the contents of variables and other program state at each source line of the application’s replayed execution. We have implemented a Transplay prototype that can record unmodified Linux applications and replay them on different versions of Linux as well as Windows. Experiments with several applications including Apache and MySQL show that Transplay can reproduce real bugs and be used in production with modest recording overhead.
When core business processes of a customer are suspended due to an application failure, quickly diagnosing the problem and putting the customer back in business is of utmost importance. Resolving a bug typically starts with reproducing it in the lab. However, reproducing a software bug is one of the most time consuming and difficult steps in the resolution of a problem. Reproducibility of a bug is impacted by heterogeneity of the application environments. A variety of operating systems, corresponding libraries and their many versions, application tiers supplied by different ISVs, and network infrastructure with varied configuration settings make application environments complex and bugs hard to reproduce. The source of the problem might be an incorrect assumption implicitly made by the application about the availability or configuration of local services such as DNS, or about co-deployed applications and their components, or it may surface only when a particular library version is used [33]. Furthermore, nondeterministic factors such as timing and user inputs contribute to the difficulty in reproducing software bugs. Because the common approach of conveying a bug report is often inadequate, record-replay approaches [29, 28, 31, 19, 24, 2, 13] have been proposed to capture and reproduce hard-to-find application bugs. By directly recording the application and capturing the bug as it occurs, the burden of repeated testing to reproduce the bug is removed. Despite its potential for simplifying bug reproduction and debugging, the fundamental limitation of previous record-replay approaches is that they require the availability or replication of the production application environment during replay. All previous approaches require at minimum the availability of all original code executed as a part of the recording, including not just the buggy application binary, but also any other software executed, such as other applications, libraries, utilities, and the operating system. The original code is required to generate the instructions that will be executed during replay. This is problematic in practice for several reasons. First, customers are generally unwilling to make available their actual production environment to vendors for debugging purposes given that keeping it up and running in production is crucial for business. Second, customers are often unwilling to even make replicas available since they may contain custom proprietary software and data that they do not want to provide in their entirety, or applications from other vendors which they are not allowed to provide to a competing vendor. Third, even if customers provide detailed informa-
Categories and Subject Descriptors C.4 [Performance of Systems]: Reliability, availability, serviceability; D.2.5 [Software Engineering]: Testing and Debugging; D.4.5 [Operating Systems]: Reliability
General Terms Design, Experimentation, Performance, Reliability.
Keywords Record-Replay, Virtualization, Checkpoint-Restart.
Permission to make digital or hard copies of all or part of this work for personal or classroom use is granted without fee provided that copies are not made or distributed for profit or commercial advantage and that copies bear this notice and the full citation on the first page. To copy otherwise, to republish, to post on servers or to redistribute to lists, requires prior specific permission and/or a fee. SIGMETRICS’11, June 7–11, 2011, San Jose, California, USA. Copyright 2011 ACM 978-1-4503-0262-3/11/06 ...$10.00.
109
captured at the source, thus avoiding any version discrepancies. Relevant pages from potentially large memory mapped data files are presented back to the application as needed. Replay is decoupled from the operating system by replaying the system call results instead of reexecuting them. Processes of an application are decoupled from one another as well so that replay can be done on a subset of processes, rather than needing to replay an entire application. Applications are decoupled from the memory address space through a lightweight binary translation technique designed specifically for user code that enables the application to be restored on a different operating system. Applications are decoupled from processor MMU structures such as segment descriptor tables by trapping and emulating the offending instructions during replay. Transplay achieves the record-replay functionality while meeting four important goals. First, Transplay does not require source code modifications, relinking, or other assistance from the application. Second, Transplay does not require specialized hardware modifications which limit its use and are expensive to implement. Third, recorded state is per bug and small enough to be easily shared with the developer. Having to share large amounts of data, as in the case of VM images, adversely impacts ease of use and privacy. Fourth, Transplay’s recording overhead is low enough that it can be used in production. Allowing Transplay’s instrumentation to be enabled while the application is running in production also side steps the probe effect problem. We have implemented a Transplay prototype that integrates with standard interactive debuggers. Our prototype can record application execution on one Linux system and replay it on different Linux distributions or on Windows without any of the original application binaries or libraries. Using several real multi-process and multi-threaded applications, we demonstrate Transplay’s ability to record and deterministically replay execution across completely different Linux environments and across Linux and Windows operating systems, capturing the root cause of various types of real software bugs in desktop and server applications. Recording overhead is less than 3% for most applications including Apache, and less than 17% in all cases, with respective partial checkpoints consuming less than 5 MB.
tion to allow vendors to create replicas, it is quite difficult for them to get all the versions and configurations of all software right to replay a bug that occurred in a complex production environment. Fourth, even if an exact replica of a production environment could be created for debugging purposes, its creation may be prohibitively expensive in terms of both hardware and software requirements for complex production environments. Finally, bugs can be data dependent and all necessary data is typically not available outside of the original production environment. While it may be possible to record every single instruction executed along with all data arguments so that they can be replayed without need for the production environment, such a recording would be prohibitively expensive to do, impose excessive storage requirements, and result in unacceptable recording overhead in production. We introduce Transplay, a software failure diagnosis tool that can package up the minimum amount of data necessary to correctly reproduce production software bugs on a stateless target machine in the developer environment. Exclusively relying on a per-bug lightweight recording, Transplay deterministically reproduces the captured bug on a different operating system, without access to any originally executed binaries or support data. At the target lab, there is no need to install or configure the original application, support libraries, other applications, or the operating system to reproduce the failure. Portions of the application environment, including bits of application and library code necessary to reproduce the failure, are automatically detected and recorded. Transplay introduces partial checkpointing, a simple technique based on the premise of short error propagation distances [21, 32] that captures the buggy execution of the application in its last few seconds prior to failure. Instead of the traditional approach of taking a full application checkpoint representing its cumulative state until that point, followed by a log of external inputs, partial checkpointing completely ignores the application’s previous execution and focuses on state accessed by the application within the interval of interest. Every piece of required data, including the instructions executed within its binary and other libraries, is captured. In this model, the application is treated as a state machine with the processor context as its only internal state, with all other state captured on initial access. Partial checkpointing provides two guarantees by design. First, all state necessary to replay the interval of execution is captured. As Transplay monitors every interface through which the application could access external data, any data required by the application during its deterministic reexecution is guaranteed to be available. This completeness also decouples replay from the target environment by providing necessary state from the self-contained log. Second, any state not directly accessed by the application is not included in the recording. Since Transplay only captures state actually accessed by the application, any extraneous state such as unaccessed parts of the application’s address space or its binaries, are not included, leading to a small per-bug recording. Transplay allows playing back the bug captured within a partial checkpoint in a different environment by decoupling replay from the target environment. The application is decoupled from its binaries and memory state by trapping accesses to the code pages and mapping the actual pages
2. USAGE MODEL AND SYSTEM OVERVIEW Transplay is a tool for recording and replaying specified intervals of the execution of a group of processes and threads. We refer to a group of processes and threads being recorded or replayed as a session. A session can consist of multiple processes that make up an application or a set of applications, where each process may contain threads that share the address space of the process. Once Transplay is installed on the same machine as a production application, it continuously records its execution. When a fault occurs, Transplay outputs a set of partial checkpoints and logs taken before the fault. A partial checkpoint is the partial state of a session which needs to be restored initially to replay the session’s execution for a specified time interval. A log contains the events recorded over the interval that works together with a partial checkpoint to enable deterministic replay. When recording multiple processes, partial checkpoints
110
ing the application from an earlier partial checkpoint with a breakpoint set to a desired point of execution in the past. A partial checkpoint file itself does not contain any symbol information, so the debugger retrieves it from a separately provided symbol file. Typically, application binaries are stripped of their symbol table and debugging sections before they are shipped to the user. However, the symbol and debugging information is preserved in respective formats [1] separately in a symbol file which would be accessible to developers.
and logs are saved separately for each process, along with information identifying the process that had the failure. Transplay divides the recording of an application into periodic, contiguous time intervals. For each time interval, it records a partial checkpoint and log for each application process that executes during that interval. A recording interval can be configured to be of any length. As the application executes, a series of partial checkpoints and logs are generated and the most recent set of checkpoints and logs are stored in a fixed size memory buffer. Storing a set of partial checkpoints and logs rather than just the most recent one ensures that a certain minimum amount of execution context is available when a failure occurs. Partial checkpoints and logs are maintained in memory to avoid disk I/O and minimize runtime overhead. Older partial checkpoints and logs are discarded to make room for the new ones. Partial checkpoints and logs in memory can be written to disk at any time by stopping the current recording interval, causing the accumulated partial checkpoints and logs in memory to be written to disk. Transplay has built-in support for detecting explicit faults such as a segmentation violation and divide by zero, and provides an interface to integrate with external fault sensors. When a failure occurs, the recording can be made available to the developer in lieu of, or as an attachment to a bug report. The bug can then be directly replayed on any hardware in the developer’s environment using Transplay. Although the failure may involve the interaction of multiple tiers of software, the developer does not need access to any of that software to reproduce the failure. This is important since an application developer may have access to only his application software, not other software required to reproduce the failure. Since Transplay captures architecture dependent binary instructions of the application as a part of its partial checkpoint, the target CPU where replay is performed is required to be the same type as the original CPU. Other hardware attributes are not required to be the same. Using partial checkpoints, a developer does not need to replay an entire multi-process application or a set of applications. The developer could just select the process where the fault occurs to simplify problem diagnosis, and Transplay will replay just that process, with its interactions with other application processes virtualized. If the selected process uses shared memory, Transplay will also simultaneously replay other processes that share memory with the selected process to provide deterministic replay. Transplay integrates with the GNU Project Debugger (GDB) to closely monitor and analyze the execution of the application being replayed. Any inputs needed by the replay are provided from the recorded partial checkpoint and log, and any outputs generated by the replay are captured into an output file and made available to the user. If the application writes into a socket, for instance, the user would be able to examine the contents of the buffer passed to the write system call and also see how the content of the buffer is generated during the steps leading to the system call. For root cause analysis, Transplay allows the programmer to set breakpoints at arbitrary functions or source lines, single step the instructions, watch the contents of various program variables at each step, and monitor the application’s original recorded interactions with the operating system and other processes. Reverse debugging can also be done by resum-
3. PARTIAL CHECKPOINTING The traditional approach for recording an interval of an application’s execution is to checkpoint the initial state of the application at the beginning of the interval, followed by logging events that guide replay. The initial checkpoint represents the cumulative execution until the beginning of the interval and the log represents data inputs and events required to guide replay. Such an approach may include data which is not relevant for reproducing the recorded bug. For example, the checkpoint may contain pages in the memory address space which will not be used at replay. Transplay uses a different approach called partial checkpointing, to capture minimal but complete state required for replay. Treating the application as a state machine with the processor context as the only internal state, Transplay continuously monitors its interfaces to intercept and record every piece of state that crosses the application boundary. Any previous execution, and state accumulated as a result, is ignored. In addition to recording the system call results and other events required for deterministic replay, Transplay monitors accesses and changes to the address space pages and captures relevant information to create a self-contained recording of the application bug. A partial checkpoint has four key characteristics. First, the state captured is completely decoupled from the underlying application binaries and the operating system. Second, it is defined only for a specific interval of an application’s execution and contains only the portion of state accessed by the application in that interval. The space needed to store a partial checkpoint can be small since it is used only for recording execution of a brief interval of time. Even though an application itself may be large in its memory footprint and processing large quantities of data, it only accesses a fraction of itself during a brief interval of time. In contrast, regular checkpointing mechanisms [26, 23, 12], including virtual machine snapshots [5], rely on the availability of complete file system state or virtual machine images, including all software code and additional file snapshots, to resume execution. Third, it is only useful for deterministically replaying the specific time interval, not for running the application normally. When the application is replayed, it does not perform any useful work, except that its execution can be analyzed using tools such as debuggers and profilers. Fourth, it is captured over the specified time interval, not at a single point in time. A particular piece of state is included in the partial checkpoint when it is first accessed within the interval. For instance, a shared library page is included in the partial checkpoint when the application calls a function located in that page. Similarly, the state of an installed signal handler is included when the respective signal is delivered to a thread. Partial checkpointing further provides an efficient
111
Algorithm 1: Partial checkpointing mechanism implemented within the page fault handler 1 if partial flag in the PTE is set then 2 if page is shared then 3 add (page address, page content) to the corresponding shared_memory_object; 4 add (region’s start address, corresponding shared_memory_object) to the process shared_maps; 5 else 6 if page is mapped within current recording interval then 7 add page and page content to the list of saved pages in the respective system call event_record; 8 else 9 add page to the initial_page_list; 10 end 11 end 12 end
a page, but does not read from it, such a page is not required from the partial checkpoint during replay. However, page table status flags provided by most processors are not sufficient to determine if a written page has also been read. We conservatively include all pages accessed during the interval in the partial checkpoint even though the application may not have read from some of them. This approximation works well in most cases as most pages that are written by an application are also read. To save per process memory state in a partial checkpoint, Transplay must determine the memory pages that are read by the threads associated with the process during the interval of execution. Similarly, Transplay must also account for per session state corresponding to memory objects that are shared across multiple processes and not necessarily associated with any individual process. To save per session state in a partial checkpoint, Transplay must determine the memory pages of global shared memory objects that are read by the threads during the interval of execution. Algorithm 1 illustrates the partial checkpointing mechanism and Table 1 describes the data structures involved. Transplay uses two types of objects to store the contents of accessed pages during the recording interval. A per process initial_page_set is allocated for memory regions private to a process. Each record in the set contains a page address and content. A per session shared_memory_object is allocated for each shared memory region accessed within a recording interval and contains the subset of pages accessed by any process or thread in the session in that interval. Each record in the set contains the offset of the page within the region and its content as of the first access to that page by any process or thread in that recording interval. The pages in the shared_memory_object may be mapped at different addresses by different processes. To track which pages are accessed, Transplay utilizes the present bit available in the page table entry. It cooperatively shares its use with the kernel by keeping track of kernel use of and changes to these bits by using one of the unused bits available in the page table entry as a partial flag. At the beginning of the recording interval, Transplay clears the present bit for each page in the process address space that is present, using the partial flag to store the original value of the present bit. Transplay also clears the present bit and sets the partial flag whenever a new page table entry is added. When a thread accesses a page which does not have its present bit set, a page fault is generated. As a part of the page fault handler, Transplay checks the partial flag
representation that minimizes the information necessary to replay the application over a fixed time interval. Partial checkpointing is substantially different from incremental checkpointing [27]. Incremental checkpointing assumes the existence of an earlier full checkpoint, and saves only the execution state that has changed since the prior checkpoint. To resume execution from an incremental checkpoint, the state from the full checkpoint must be restored, as well as the state from the subsequent incremental checkpoint. Partial checkpointing differs in at least three ways. First, partial checkpointing does not require saving or restoring any full checkpoint. All checkpointed state necessary to use a partial checkpoint is completely contained within the partial checkpoint. Second, a partial checkpoint is completed after a time interval to enable deterministic replay over only the previous time interval. In contrast, an incremental checkpoint occurs after a time interval to enable normal execution to be resumed after that time interval going forward. Third, a partial checkpoint contains state that has been read during a time interval, while an incremental checkpoint contains state that has been modified.
3.1 Partial Checkpointing Mechanism We will use Linux semantics to describe how partial checkpointing and logging are done in further detail. A partial checkpoint broadly consists of session state accessed by processes and threads in the session, per process state, and per thread state. Per session state consists of global shared memory objects accessed during the interval and not tied to any process, such as shared mapped files and System V shared memory. Per process state consists of the initial set of memory pages needed to enable replay and mappings for global shared memory objects. Per thread state consists of CPU, FPU, and MMU state. To start recording a partial checkpoint for a time interval, Transplay forces all threads in the session to reach a synchronization barrier at their next entry into the kernel. The barrier is required to produce a globally consistent partial checkpoint across all threads. The last thread to reach the barrier records the CPU, FPU and MMU state of each thread, including the processor register state and the user created entries in the global and local descriptor tables. A status flag indicating that the session is in recording mode is set and all threads waiting at the barrier are woken up. For both per process and per session memory state, only pages that were read during a recording interval need to be saved in a partial checkpoint. If a process only writes to
112
3.2 Logging
to see if it is set. If it is set, the page was originally present and needs to be recorded. If the page belongs to a shared memory region, Transplay adds a record containing the offset of the page within the shared memory region and the page content to the shared_ memory_object that represents the shared memory region. It updates a per process set of shared memory regions, shared_ maps, that represents the mapped instances of the shared_ memory_objects for that process. Otherwise, Transplay copies the page address and contents to the process’s initial_page_set. Each accessed page is copied just once when it is first accessed during the interval. Memory shared among threads associated with a process is automatically taken care of as a part of this simple mechanism. If a process is created via fork during the recording interval, its initially mapped pages at the time of creation that are accessed during the recording interval are also included in the partial checkpoint. This is done by performing the same operations to the process at creation time as were done to other processes already created at the beginning of the recording interval, namely clearing the present bit for each page in the process address space that is present, and using the partial flag to store the original value of the present bit. Note that for pages not corresponding to a shared memory region, Transplay only includes pages in the partial checkpoint that are already mapped at the beginning of the recording interval or at process creation. Changes in Memory Region Geometry. The threads of an application may map, remap or unmap memory regions within a recording interval. Transplay must capture sufficient state to reproduce these events at replay. Transplay keeps track of the system calls made by each thread in a per-thread queue of event_record structures. In addition, Transplay keeps track of the system calls that map memory in the current recording interval in a per process stack called recent_maps, including a reference to the respective system call event_record. When a page is first accessed that was mapped during the recording interval, a page fault occurs and Transplay searches the recent_maps stack to find the most recently mapped memory region corresponding to the page, which is the current mapping being used by the thread. The page is then added to the respective system call event_record or to the respective shared_memory_object if it is for a shared memory region. If the page happens to be a global shared page, a record containing a pointer to its shared_memory_object, and the starting address where the shared memory region is mapped in the process address space is added to the event_record of the system call event that mapped the shared memory region. If the page was not mapped within the current recording interval, the record is added to the shared_maps set of the process. When a failure is detected and a partial checkpoint is emitted, the pages associated with the system call are saved along with the event_record. An incremental partial checkpointing mechanism could be used to reduce storage requirements and copying overhead. Pages already copied as part of previous partial checkpoints that are still stored in memory do not need to be copied again in the current partial checkpoint if the contents remain the same. However, Section 5 shows that the additional complexity of incremental partial checkpointing is not needed as the storage requirements and copying overhead of regular partial checkpoints is modest.
Transplay performs logging to collect necessary information and application state to deterministically replay each thread and process in a session from an initial state defined by the partial checkpoint through the end of the recording interval. Logging serves two purposes. First, it records necessary data which may not be available at the target environment. Second, it captures information related to the outcomes of nondeterministic events to ensure a deterministic replay. Our logging mechanism builds on Scribe [13], a low-overhead operating system mechanism for deterministic record-replay that supports multi-threaded and multiprocess applications on multiprocessors. Transplay leverages Scribe’s mechanisms for handling nondeterminism due to signals, shared memory interleavings and instructions such as rdtsc. We omit further details about addressing these sources of nondeterminism due to space constraints. Unlike Scribe, Transplay provides a different system call logging mechanism which records all system call results rather than reexecuting them at replay. This is done to support replay debugging across heterogeneous systems.
4. PARTIAL REPLAY To replay a piece of previously recorded application, the user chooses a process and an interval of execution to replay by selecting the corresponding partial checkpoints. To reproduce a deterministic replay of interleaved shared memory accesses among application processes, Transplay computes a shared memory closure of the selected process and replays all processes in the closure together as a session. A shared memory closure of a process p is the smallest set of processes consisting of p, such that no process within the set shares memory with a process outside the set. All threads within each process in the closure are included in the session and replayed together. To aid debugging, replay can also be done across consecutive recording intervals by coalescing the partial checkpoints and concatenating the respective logs; details are omitted due to space constraints. Partial replay consists of two phases: Load phase, where the coalesced partial checkpoint of each process in the session is restored, and Replay phase, where the application threads are deterministically reexecuted within Transplay’s control. Transition from load to replay phase occurs when control is transferred to the application code. We first describe the general mechanism of each of these phases, and then describe in further detail how the mechanism works for replaying specifically on Linux and Windows.
4.1 Partial Replay Mechanism 4.1.1 Load Phase As a part of the load phase, Transplay prepares the process context required for the application to run independent of the target. It includes creating and populating the memory regions, creating the application processes and threads, and loading user created segment descriptor table entries. The x86 architecture provides global (GDT) and local (LDT) descriptor tables, which describe user accessible memory segments in its segmented memory model. Typical multi-threaded applications create private memory segments by adding segment descriptor entries to these tables and execute instructions that reference their entries. If the target operating system’s segment layout matches with that
113
Data structure event_record recent_maps initial_page_set shared_memory_object shared_maps segment_selector selector_base
Function Entry describing system call state in per-thread system call queue Stack of system call event_records that map memory regions within current recording interval Per-process set of pages initially restored at replay Set of (page offset, page content) records describing a sparse shared memory region Set of (page offset, shared_memory_object) records indicating shared memory regions mapped within a process Key-value table that maps a segment register to the selector it contains during replay phase Key-value table that maps a selector to the base linear address of the segment it points to
Table 1: Key Transplay data structures tems, Transplay virtualizes an application’s access to the tables. Transplay emulates the system calls by intercepting the instructions used to invoke a system call, and emulating the call itself. For example, on the x86 architecture, Linux applications invoke the system calls using the sysenter or int x80 instruction. Transplay intercepts these instructions and emulates the respective system call based on techniques developed in RR [3]. For most system calls, emulation is done by simply returning the results of the system call from the recording, bypassing kernel execution. There are three classes of system calls that require further emulation: system calls for process control, system calls that modify the address space geometry, and system calls related to the MMU context. We discuss these in further detail in Sections 4.2 and 4.3. Replaying the system call results is done in an operating system independent way by Transplay on behalf of the application. The application never directly contacts the target operating system, thereby decoupling the replayed application from the operating system services of the target.
of the source and it provides an API to access the tables, Transplay loads the entries into the tables. If not, emulation of instructions that explicitly reference the segments must be done as described in Section 4.3. A key requirement for heterogeneous replay is that the same address space regions used by the application during recording be available to the application during replay. Since Transplay captures non-relocatable chunks of application binaries directly from application’s memory, they have to be loaded at the same address offsets at replay. However, in the general case, the required address regions may not be available on the target system, because they may be reserved for the operating system or system libraries. For example, the default Linux/x86 configuration makes 3 GB of address space available to the user space, but the default Windows configuration does not use the same size address space. Furthermore, system libraries such as Windows’ kernel.dll and Linux’s Virtual Dynamic Shared Object (VDSO) reserve specific address offsets for themselves, preventing the use of their address regions by the application. Virtual machines and emulators decouple the user code from the target system by running it on a virtual MMU, but Transplay avoids full emulation of the processor MMU by making a reasonable assumption that the address regions required by application’s memory pages are available to the user at replay. Common operating systems share the basic memory layout on a given architecture and typically allow the user to configure the way the linear address space is partitioned between the user and kernel space using a boottime switch. For example, to record Linux/x86 applications and replay them on Windows/x86, a simple way to avoid conflicts is to configure Linux/x86 and Windows/x86 to allocate the bottom 2 GB and 3 GB, respectively, of address space to application programs. In this way, Windows system libraries, which only occupy a small region immediately below the kernel region, will not conflict with an application’s pages in the bottom 2 GB of address space.
4.1.3 Integration with the Debugger Transplay integrates with GDB by providing a GDB script that directs the load phase until the application is fully initialized for the user to start interacting through the debug interface. It also contains the necessary GDB directives to load the symbol information for the application being debugged. The script begins the debugging session with the invocation of the program that performs the load phase as the debuggee, which reads the partial checkpoint files, reconstructs their address space and initializes their threads. The debugger does not intervene during this process. The latency of the load phase is usually imperceptible to the user. After the application is loaded, a single forward step within the GDB script transfers control to the application code. The application is presented to the user in a stopped state while the debugger shows the register state and the source line of the application a few moments prior to the failure. The user can then set break points, single step through the source lines to examine program variables and monitor application’s interactions with the operating system and other processes, to analyze the root cause. Any inputs needed by the application are automatically provided by Transplay. For instance, when the application attempts to read from the console, the input is directly provided from the log rather than waiting for user input. When the application executes the system call interrupt instruction in a debugging session, the perceived state of the application’s registers and memory after returning from the instruction would be identical to its state at the corresponding point during recording.
4.1.2 Replay Phase The replay phase executes the instructions produced by the application during replay and decouples them from the target system. Most instructions dispatched by the application are executed natively. Note that Transplay does not need to process privileged instructions since a partial checkpoint never contains them. Transplay only tracks pages within the application address space. Any privileged instructions such as in or cli, which may be executed as a part of the system calls, are not included. However, there are two classes of instructions that Transplay may need to emulate: 1. instructions explicitly referencing user created segments, and 2. instructions that invoke a system call. Instructions that reference the user segments are emulated using a simple binary translation mechanism. Because the GDT and LDT may be managed differently by different operating sys-
4.2 Partial Replay Across Linux Load Phase. The load phase is performed by a statically linked program, partial checkpoint loader, which cre-
114
Category
System Call fork Process control clone exit_group mmap, brk, execve Memory geometry shmat, mmap with MAP_SHARED flag munmap MMU context set_thread_area, modify_ldt
Linux Windows emulate with fork emulate with CreateProcess forward to the OS emulate with CreateThread wait for other threads wait for other threads emulate with mmap and munmap emulate with VirtualAlloc emulate with shmat emulate with MapViewOfFile forward to the OS emulate with UnmapViewOfFile forward to the OS update selector_base table
Table 2: Transplay system call emulation For system calls that map a System V shared memory region or a shared memory mapped file, the shared_memory_object indicated in the event_record of the system call is mapped. For clone, set_thread_area and modify_ldt system calls, the system call is simply forwarded to the underlying kernel. The interleaving of shared memory accesses as recorded in the event stream is enforced among replaying processes and threads and any signals received by the application within the interval are delivered at respective points using the Scribe [13] mechanisms.
ates the application processes, restores their address space and finally transfers control to the application code. The partial checkpoint loader itself is built to be loaded at an unconventional address region to avoid conflicting with the pages of the application and does not use the standard program heap or stack. The partial checkpoint loader begins by creating the per session shared memory regions as defined by the shared_memory_objects, and mapping them into its address space. The sparse set of memory pages in each shared_memory_object are then loaded into respective shared memory regions, and the regions are unmapped. A set of processes, each to become one of the processes recorded in the partial checkpoint, are recursively created with unconventional address regions used as their stacks, to avoid conflict with the application’s stack pages. Each process begins restoring itself by attaching to the shared memory regions indicated by the shared_maps set in its partial checkpoint. Each page in the initial_page_set is then mapped as an independent, private, anonymous, writable region and its initial page content is loaded. After the page content is loaded, its protection flags are set to their original recorded values through mprotect system call. For example, if the page was originally a file map of a read-only shared library, it is first mapped as a writable anonymous region to load its contents, and the original page permissions are restored afterwards. After the process address space is prepared, each process recursively creates its threads. Each process and thread loads respective descriptor table entries using the Linux API, and enters a futex barrier. Once all threads reach the barrier, the main replay thread invokes Transplay to attach to the threads and start replaying. Each thread then executes the instructions to restore the processor registers. When the instruction pointer is finally restored through a jmp instruction, the thread starts running the application code. Replay Phase. During the replay phase, instructions explicitly referencing the user segments can be natively executed without any emulation because different Linux versions manage the GDT and LDT in the same way, and provide the API to load the entries required by the application. Most system calls made by the application are handled by simply copying the data from the respective event_records. Table 2 lists three main classes of exceptions, where further processing is performed beyond data copy. In particular, for the fork system call, Transplay creates a new child process and preloads the pages indicated in the event_record. These pages include the pages accessed by the child process in the recording interval which were not present in the parent’s address space. For the exit_group system call, Transplay defers its execution until all other threads in that process exhaust their event_records, to avoid their premature termination. For system calls that map a new memory region (mmap, brk, execve etc.), the pages indicated in the system call’s event_record are mapped and preloaded into memory.
4.3 Partial Replay on Windows Transplay’s mechanism for replaying Linux applications on Windows is based on Pin instrumentation [16], but is conceptually similar to replaying on Linux as discussed in Section 4.2. We highlight the steps which are different below. Load Phase. The load phase is performed by the Windows version of the partial checkpoint loader in user space using the Windows API. To replay the application, the partial checkpoint loader itself is started under the control of Transplay pintool [16]. Transplay pintool does not interfere with the loading process performed by the partial checkpoint loader. The creation of processes, partial reconstruction of their address space and creation of threads within them is performed as already outlined, except using equivalent Windows APIs. Once the partial checkpoints are loaded, each thread leaves the synchronization barrier and makes a special system call, which is normally undefined in Linux and Windows. The system call activates Transplay pintool by notifying it of the completion of the load phase and transition into replay phase. Transplay pintool reads the respective log file of the thread to obtain its saved processor context and loads it using Pin’s PIN_ExecuteAt API function, which turns the control over to the application code. Replay Phase. Transplay pintool continues with the replay phase to monitor the application to satisfy the requests it makes. In particular, Transplay emulates the key categories of the Linux system calls listed in Table 2 using equivalent Windows APIs. For other system calls, Transplay pintool traps the system call interrupt instruction, copies system call return data to the application, increments the instruction pointer to skip the system call instruction and allows the application to continue normally. In the absence of such a mechanism, executing the Linux system call interrupt instruction would cause a general protection fault on Windows. When new memory regions are mapped, respective memory pages that will be accessed by the application in its future execution are brought into memory in a way similar to Linux replay, except using the Windows semantics. For instance, Windows treats memory address space and the physical memory that backs it as separate resources, whereas Linux transparently associates physical pages to memory mapped regions. To emulate the Linux
115
system calls that map new memory regions, Transplay reserves both the address space and the memory together. Instructions explicitly referencing user segment registers are treated through a trap and emulate mechanism. Windows configures the CPU descriptor tables based on its memory layout which is different from that of Linux. A segment selector, which is an index into the segment descriptor table, used by the Linux application may point to a different region of memory on Windows or may not be valid at all. Any attempts to update the Windows descriptor tables may result in a conflict with the way Windows uses its resources. Transplay resolves these conflicts by intercepting and emulating the offending instructions within the Linux application’s binary and the system calls that modify the descriptor tables. Transplay uses two key-value table data structures, segment_selector and selector_base, to emulate the instructions with segment register operands. At any time during replay, the segment_selector table maps a segment register to the selector it contains, and the selector base table maps a selector to the base linear address of the segment that it points to. When an instruction which refers to its operands through a segment register is encountered during replay, Transplay computes the location of each operand in the flat address space using the formula, (segment base + operand base + displacement + index*scale), where segment base is the base address of the segment and is obtained by joining the two tables on the selector and the remaining terms have instruction semantics and are obtained from the instruction. Transplay then rewrites the original instruction such that the final linear address of the operand is used rather than referencing the segment register. The tables are initialized based on the descriptor table state captured in the partial checkpoint. As the application executes during replay, the segment_selector table is updated by intercepting the mov instructions that load the segment registers with selectors and the segment_selector table is updated by intercepting the set_thread_area and modify_ldt system calls which provide the mapping between the segment base address and the selector.
5.
EXPERIMENTAL RESULTS
We have implemented Transplay as a kernel module and associated user-level tools on Linux which can record and replay partial checkpoints of multi-threaded and multiprocess Linux applications across different Linux distributions. We have also implemented a user-level replay tool for Windows based on Pin binary instrumentation [16], which currently only replays partial checkpoints of non-threaded Linux applications on Windows. Our unoptimized prototype works with unmodified applications without any library or base kernel modifications. Using our prototype, we evaluate Transplay’s effectiveness in (1) replaying partial checkpoints across environments differing in software installation, operating system and hardware, (2) minimizing runtime overhead and storage requirements of recording applications, and (3) capturing the root cause of various types of real software bugs on server and desktop applications. Recording was done on a blade in an IBM HS20 eServer BladeCenter, each blade with dual 3.06 GHz Intel Xeon CPUs with hyperthreading, 2.5 GB RAM, a 40 GB local disk, and interconnected with a Gigabit Ethernet switch. Each blade was running the Debian 3.1 distribution and the
116
Linux 2.6.11 kernel and appears as a 4-CPU multiprocessor to the operating system. For server application workloads that also required clients, we ran the clients on another blade. Replay was done in three different environments: (1) a different blade in the BladeCenter running Debian 3.1, (2) a Lenovo T61p notebook with an Intel Core 2 Duo 2.4 GHz CPU, 2 GB RAM, and a 160 GB local disk running Windows XP 3.0 with Pin-25945, and (3) a VMware virtual machine with 2 CPUs, 512 MB RAM, and an 8 GB virtual disk running Linux Gentoo 1.12 using VMware Player 3.0 on the Lenovo notebook. None of the recorded application binaries were installed or available in any of the environments used for replay. Furthermore, the Windows and Gentoo replay environments had completely different software stacks from the Debian recording environment. Table 3 lists the application workloads we recorded and replayed using Transplay. The server applications were the Apache web server in both multi-process (apache-p) and multi-threaded (apache-t) configurations, the MySQL server (mysql), and the Squid web cache proxy server (squid). httperf-0.9 was used as the benchmark for the web servers and web proxy to generate 20,000 connection requests. The desktop applications were a media player (mplayer) and various compute and compression utilities (gzip, bc, and ncomp). The applications were all run with their default configurations. We recorded each application workload by taking partial checkpoints at three different intervals: 5, 10, and 15 seconds. All of the applications were recorded and determinstically replayed correctly across all three different replay environments except for mysql and apache-t, which were replayed in the two different Linux environments but not in Windows due to threading.
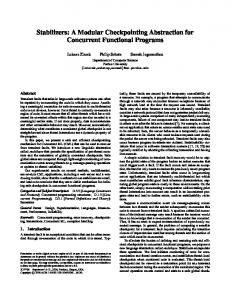
5.1 Performance and Storage Overhead Table 3 lists the execution time for each application workload when run natively on Linux without Transplay, and Figure 1 shows the normalized runtime overhead of recording the application workloads compared to native execution. As a conservative measure and due to space constraints, we show the recording overhead for the shortest of the intervals used, 5 seconds. Overhead for the 10 and 15 seconds was smaller due to the longer recording intervals. For the 5 second intervals, the recording overhead was under 3% for all workloads except for squid and mysql, where the overhead was 9% and 17%, respectively. Figure 1 also shows the speedup of replay on Linux and Windows for 5 second replay intervals. Replay results are shown for 5 second intervals for Linux using the blade and Windows using the notebook; other results are omitted due to space constraints. Replay was generally faster than recording, several times faster in some cases. Two factors contribute to replay speedup: omitted in-kernel work due to system calls partially or entirely skipped (e.g. network output), and time compressed due to skipped waiting at replay (e.g. timer expiration). bc did not show any speedup because it is a compute-bound workload which performs few system calls. Speedups on Windows were smaller due to the additional overhead of binary instrumentation and emulation required to replay on Windows. The binary instrumentation overhead was less for longer replay intervals as Pin’s overhead of creating the initial instruction cache for emulation is amortized over the replay interval. Figure 2 shows a measure of partial checkpoint latency,
Name mysql apache-t apache-p squid bc gzip ncomp mplayer
Workload Time Bug MySQL 3.23.56, 10 threads, run sql-bench 105 s data race Apache 2.0.48, 57 threads, run httperf 0.9 57 s atomicity violation Apache 2.0.54, 6 processes, run httperf 0.9 59 s library incompatibility Squid 2.3, run httperf 0.9 82 s heap overflow bc 1.06, compute π to 5000 decimal places 55 s heap overflow Gzip 1.2.4, compress 200 MB /dev/urandom data 68 s global buffer overflow Ncompress 4.2, compress 200 MB /dev/urandom data 82 s stack smash Mplayer 1.0rc2, play 10 MB 1080p HDTV video at 24 fps 40 s device incompatibility
Memory 121 MB 221 MB 4188 KB 7192 KB 2172 KB 1820 KB 1440 KB 44 MB
Partial Log 538 KB 29 KB 1305 KB 2284 KB 935 KB 2570 B 991 KB 4 KB 349 KB 2714 B 321 KB 1341 B 293 KB 1229 B 1393 KB 9513 KB
Table 3: Application workloads and bugs recent execution history within a buffer of fixed size. bc was mostly compute bound and had the least log data, less than 1 KB, which is not visible in Figure 4. Figure 4 also shows the compressed log sizes, as denoted by the patterned bars. The logs of most workloads compressed well, except for gzip, ncomp and mplayer, for which negligible compression was obtained and hence the compressed values are not visible. The log of gzip and ncomp mostly contained the 200 MB of random data, which does not compress well. The log of mplayer was dominated by the compressed video file, which also does not compress well. Figure 5 shows the composition of each application’s log. The three bars shown for each application correspond from left to right to the 5, 10, and 15 second recording intervals, respectively. The log data is classified into four categories: sys is system call records and integer return values, output is the data returned from system calls, mmap is pages mapped during the recording interval, and shm are events corresponding to page ownership management of shared memory. In most cases, the log was dominated by output data which is returned to the replayed application through system calls. One of the primary goals of Transplay is to decouple the application from its source environment and Transplay meets this goal in part by logging more data than other record-replay systems that require an identical replay environment. bc produced a small log, mostly containing the system call records. apache-t shows many page ownership management events in its log since it is a multi-threaded application with many threads. mysql has fewer threads and less page ownership management events. Log data due to memory mapped pages was generally small relative to other constituents of the log because most of the memory mappings occurred at the beginning of the applications and the logs are for the last few complete intervals of application execution.
the average time it takes to atomically finish recording one interval and start recording a subsequent recording interval while doing a periodic recording of the applications. It includes the time taken for the application threads to reach the synchronization barrier so that a consistent initial state of the application for the partial checkpoint can be recorded. The application is not completely stopped during this time. Some of the application threads may still be running application code while others reach the barrier. The barrier is created in the kernel when checkpoint request arrives and each application thread reaches the barrier the next time it enters the kernel. Once all threads reach the barrier, the rest of the processing is done. The latency is less than a few hundred milliseconds in all cases. The average latency was the same for the 5, 10, and 15 second recording intervals. We saved the last three partial checkpoints and their associated logs for each application and characterized their size and composition. For mplayer, only the last two partial checkpoints and logs were saved for the 15 second recording interval due to its relatively short execution time. We only considered complete intervals, so if 5 second recording intervals were used and an application had a partial checkpoint at the end of its execution accounting for the last 2 seconds of execution, that partial checkpoint was not included in this characterization. Figure 3 shows the average total size of partial checkpoints across all processes of each workload for 5, 10 and 15 second recording intervals. Partial checkpoint sizes are modest in all cases, no more than roughly 5 MB even for the longest recording intervals. Most of an application’s memory pages are not accessed during any particular interval of execution. For example, the largest partial checkpoint was roughly 5 MB for mysql, which had a virtual memory footprint of well over 100 MB. Figure 3 also shows the size of the partial checkpoints when compressed using lzma, as denoted by the patterned bars. In addition to the fact that the partial checkpoint data compressed well, the high compression ratios indicated were also due to our unoptimized prototype which will end up storing duplicate code pages with the same content for multi-process applications. While the cost of taking regular full checkpoints is usually highly correlated with checkpoint size due to the large amount of memory state that needs to be saved, Figures 2 and 3 show that partial checkpoint latency is not correlated with partial checkpoint size because the sizes are quite small. Figure 4 shows the total size of logs generated by all processes of each application for 5, 10 and 15 second recording intervals. mysql had the most log data due to the high density of system call events carrying input data presented by sql-bench. For a 5 second recording interval, the log size was 59 MB. While this is significant storage overhead, the log does not accumulate over time. Even though Transplay continuously records the application, it only stores the most
5.2 Software Bugs Table 3 also lists with each application the real-life software bugs that we used to measure Transplay’s ability to capture and reproduce failures. All of the application bugs were taken from BugBench [15], except for the bugs for apache-p and mplayer, which were collected from Internet forums where they were reported. The bugs include nondeterministic data race bugs, different types of memory corruption issues such as buffer overflow, and issues due to incompatible interactions with the target environment where the application was run. We recorded each faulty application while the bug is triggered. In some cases, the experiment had to be repeated many times before the bug manifested. mysql and apache-t bugs were nondeterministic data race bugs. The apache-t bug was triggered by running two concurrent instances of the httperf benchmark and the mysql bug was triggered using mysql’s rpl_max_relay_size test.
117
40 20
Application
Figure 4: Log size
1.0
0.1
mplayer
ncomp
gzip
bc
squid
apache-p
apache-t
mysql
mplayer
ncomp
gzip
bc
squid
apache-p
apache-t
0 mysql
0.1
10.0
Application
Figure 5: Log composition
mplayer
1.0
60
100.0
ncomp
mmap
80
10.0
mplayer
mplayer
ncomp
gzip
sys
gzip
shm
bc
100.0
output
apache-p
100
apache-t
15s
Figure 3: Partial checkpoint size Error Propagation Distance (ms)
10s
Application
Figure 2: Checkpoint latency
Percent
Log Size (MB)
5s
0
Application
Figure 1: Recording overhead 1000.0
1
mysql
Application
bc
squid
apache-p
apache-t
mysql
mplayer
ncomp
gzip
bc
apache-p
mysql
squid
0 apache-t
0.0
2
ncomp
50
3
gzip
100
4
bc
150
15s
squid
0.2
200
10s
squid
0.4
250
5s
5
apache-p
0.6
300
6
apache-t
0.8
350
mysql
1.0
Partial Checkpoint Size (MB)
replay-windows Checkpoint Latency (ms)
Normalized Performance
record replay-linux
1.2
Application
Figure 6: Error propagation distance
exit when it notices unexpected behavior from a function in one of the libraries it uses due to an incompatible version. Since Transplay captured the code page in the library where the offending function existed, Transplay was able to reproduce the faulty behavior even on the system where the right version of the library was installed. Other recordreplay tools which only record at the system call interface would not be able to capture these types of bugs. Similarly, Transplay correctly captured the root cause of the problem for mplayer, which failed due to an incompatible audio device at the target system. Figure 6 shows the error propagation distance for each bug listed in Table 3. To measure error propagation distance, we instrumented Transplay to log the value of the time stamp counter along with each recorded event, and calculated the time between two closest events that encompass the root cause of the bug and the appearance of its symptom. In all cases, the observed value was less than half a second, supporting Transplay’s assumption and demonstrating that a modest recording interval of 5 seconds as used in our experiments is sufficient to reproduce the bugs. Bugs with longer propagation distances may be captured by dedicating more storage space to store longer intervals of execution.
For most other applications, the bug is triggered using malformed input. For example, the bug for bc is triggered using a malformed bc script, the bug for squid is triggered using a malformed client request, and the bugs for gzip and ncompress are triggered using malformed command line input. Table 3 shows the partial checkpoint and log sizes for Transplay to capture and reproduce each bug. We also measured the virtual memory footprint of each application as reported by the top command to provide a rough measure of the amount of state required to run it. In practice, applications typically require more data than the content of their virtual memory. They also indirectly rely on the state represented by their environment and the operating system. In all cases, the size of the sum of the partial checkpoint and log is much less than the virtual memory footprint of each application. Within the same recording interval where the mplayer bug was triggered, it was also mapping various codec libraries and accessing their pages to initialize them. This additional noise accounts for the large log size produced by the mplayer bug. Note that the partial checkpoints and logs required to capture the bugs are in general much less than what was required to record the more resourceintensive application workloads shown in Figures 3 and 4. Once a recording of the bug occurrence was captured, Transplay was able to deterministically replay the bug every time, even on a different platform, and was useful to diagnose the root cause of each bug. For example, for the mysql and apache-t nondeterministic data race bugs, Transplay correctly captured the specific interleaving of shared memory accesses required to reproduce the bug. Transplay was able to capture all data required to reproduce these bugs with partial checkpoint and log sizes orders of magnitude smaller than the application’s memory footprint. In general, Transplay captured the bug-triggering conditions and input required to reproduce all bugs. For instance, the malformed client request which caused squid to fail and the relevant code snippet from the input program that triggered a heap overflow in bc were part of the log recorded by Transplay. In the case of apache-p and mplayer, the bugs occurred due to incompatibility with the target environment. For apache-p, one of the processes would silently
6. RELATED WORK Many diagnosis and debugging tools have been developed. While interactive debugging tools [8] are helpful for analyzing bugs that can be easily reproduced, they do not assist with reproducing bugs. Techniques for compile-time static checking [7] and runtime dynamic checking [11] are useful in detecting certain types of bugs, but many bugs escape these detection methods and surface as failures, to be reproduced and debugged in the developer environment. Bug reporting mechanisms [18, 10] collect information when a failure occurs, but they are often limited in their ability to provide insight into the root cause of the problem because they represent the aftermath of the failure, not the steps that lead to it. Many record-replay approaches have been proposed to improve bug reproducibility and debugging [14, 29, 28, 31, 19, 24, 2, 13]. All of these approaches impose crucial dependen-
118
system mechanism to provide transparent, fully deterministic record-replay for multi-threaded applications on multiprocessors with low overhead. A number of speculative tools leverage record-replay or checkpointing. Triage [32] proposes a diagnosis protocol to automatically determine the root cause of a software failure in production. ASSURE [30] and ClearView [25] attempt to automatically diagnose a failure and automatically patch the software, with a goal of quickly responding to vulnerabilities. While such techniques may work for a limited set of well characterized bugs, they are generally not suitable for many common bugs which require intuitive faculties and application-specific knowledge of a human programmer. For instance, the right set of program inputs and environment manipulations to be used for each repetition of the execution heavily depends on the application and is generally not possible to automatically generate.
cies between the environment at the time of replay and the original production recording environment. Although some approaches claim to be able to replay in a different environment from which recording occurs, all previous approaches assume the availability during replay of all software code used during recorded execution. Hardware mechanisms [34, 20, 17] record data accesses at an instruction granularity, but do not record code and rely on the availability of binaries to replay instructions. Netzer and Weaver [22] proposed a tracing mechanism that has some similarities to partial checkpointing. Tracing creates a checkpoint for replaying from some starting point by recording values of memory locations when they are initially read, then restoring all of those values upon replay. Tracing differs fundamentally from partial checkpointing as it does not support replay in a different environment and requires the availability of the same instrumented application code. BugNet [21] uses a similar approach at the hardware level to record the operand values accessed by load instructions at the hardware level to replay the execution. Partial checkpointing is conceptually different from this approach because Transplay considers all data including the instruction opcodes as external inputs in order to produce a self-contained recording. Virtual machine mechanisms [6, 4] may allow replay on a different host environment from recording, but require the availability of the same virtual machine image at record and replay time, including all application, library, and operating system binaries. Not only does this require a large amount of data, but this is often impractical for bug reproducibility as customers are unlikely to allow application vendors to have an entire replica of all of their custom proprietary software. Crosscut [5] aims to extract a subset of data offline from a complete recording of a VM to reduce the size. However, it still requires a heavy weight instrumentation during recording and the original log it generates is large. Operating system mechanisms [29, 31] may record input data through system calls, but still require the availability of all files, including application binaries, during replay. For example, consider use of a memory mapped file or access to a memory mapped device, both of which would impose dependencies on devices and files from the original recording envionment. Neither of these types of data would be included by recording system call arguments or results, as has been previous proposed. Application, library, and programming language mechanisms [28, 9] not only require access to binaries during replay, but they also require access to source code to modify applications to provide record-replay functionality. In contrast, Transplay requires no access to any software from the production recording environment, including application, library, or operating system binaries. Combining the key features of transparency, determinism, and low overhead has been difficult to achieve with recordreplay, especially for multi-threaded applications on multiprocessors. Hardware mechanisms face a high implementation barrier and do not support record-replay on commodity hardware. Application, library, and programming language mechanisms require application modifications, lacking transparency. Virtual machine mechanisms incur high overhead on multiprocessors, making them impractical to use in production environments [6]. To reduce recording overhead, various mechanisms propose record-replay that is not deterministic [2, 24]. Building on Scribe [13], Transplay addresses these shortcomings using a lightweight operating
7. CONCLUSIONS Transplay is the first system which can capture production software bugs and reproduce them deterministically in a completely different environment, without access to any of the original software used in the production environment. Transplay accomplishes this by relying only on a lightweight per-bug recording; there is no need for access to any originally executed binaries or support data, no need to run the same operating system, and no need to replicate the original setup or do repeated testing. Transplay introduces partial checkpointing, a simple and novel mechanism to record the complete state required to deterministically replay an application, including relevant pieces of its executable files, for a brief interval of time before its failure. Partial checkpointing minimizes the amount of data to be recorded and decouples replay from the original execution environment while ensuring that all information necessary to reproduce the bug is available. Transplay integrates with a standard unmodified debugger to provide debugging facilities such as breakpoints and single-stepping through source lines of application code while the application is replayed. The captured state, which typically amounts to a few megabytes of data, can be used to deterministically replay the application.s execution to expose the steps that lead to the failure. No source code modifications, relinking or other assistance from the application is required. Our experimental analysis on real applications running on Linux shows that Transplay (1) can capture the root cause of real-life software bugs and the necessary bug triggering data and events, (2) can capture partial checkpoints of unmodified Linux applications and deterministically replay them on other Linux distributions and on Windows, and (3) is able to generate partial checkpoints of applications such as Apache and MySQL with modest recording overhead and storage requirements. These results demonstrate that Transplay is a valuable tool that can simplify the root cause analysis of production application failures.
8. ACKNOWLEDGEMENTS This work was supported in part by NSF grants CNS09025246, CNS-0914845, and CNS-1018355, AFOSR MURI grant FA9550-07-1-0527, and IBM. Oren Laadan and Nicolas Viennot provided invaluable help with Scribe source code for implementing Transplay.
119
9.
REFERENCES
[1] T. Allen et al. DWARF Debugging Information Format, Version 4, Jun 2010. [2] G. Altekar and I. Stoica. ODR: Output-Deterministic Replay for Multicore Debugging. In Proceedings of the 22nd Symposium on Operating Systems Principles (SOSP), Oct 2009. [3] P. Bergheaud, D. Subhraveti, and M. Vertes. Fault Tolerance in Multiprocessor Systems via Application Cloning. In Proceedings of the 27th International Conference on Distributed Computing Systems (ICDCS), Jun 2007. [4] J. Chow, T. Garfinkel, and P. Chen. Decoupling Dynamic Program Analysis from Execution in Virtual Environments. In Proceedings of the 2008 USENIX Annual Technical Conference, Jun 2008. [5] J. Chow, D. Lucchetti, T. Garfinkel, G. Lefebvre, R. Gardner, J. Mason, S. Small, and P. M. Chen. Multi-Stage Replay With Crosscut. In Proceedings of the 6th International Conference on Virtual Execution Environments (VEE), Mar 2010. [6] G. W. Dunlap, D. G. Lucchetti, M. A. Fetterman, and P. M. Chen. Execution Replay of Multiprocessor Virtual Machines. In Proceedings of the 4th International Conference on Virtual Execution Environments (VEE), Mar 2008. [7] D. Evans, J. Guttag, J. Horning, and Y. M. Tan. LCLint: A Tool For Using Specifications to Check Code. In Proceedings of the 2nd Symposium on Foundations of Software Engineering (SIGSOFT), Dec 1994. [8] GNU. GDB: The GNU Project Debugger, http://www.gnu.org/software/gdb/. [9] Z. Guo, X. Wang, J. Tang, X. Liu, Z. Xu, M. Wu, M. F. Kaashoek, and Z. Zhang. R2: An Application-Level Kernel for Record and Replay. In Proceedings of the 8th Symposium on Operating Systems Design and Implementation (OSDI), Dec 2008. [10] IBM. WebSphere Application Server V6: Diagnostic Data, http://www.redbooks.ibm.com/redpapers/pdfs/redp4085.pdf. [11] Intel. Assure, http://developer.intel.com/software/products/assure/. [12] O. Laadan and J. Nieh. Transparent Checkpoint-Restart of Multiple Processes on Commodity Operating Systems. In In Proceedings of the 2007 USENIX Annual Technical Conference, Jun 2007. [13] O. Laadan, N. Viennot, and J. Nieh. Transparent, Lightweight Application Execution Replay on Commodity Multiprocessor Operating Systems. In Proceedings of the International Conference on Measurement and Modeling of Computer Systems (SIGMETRICS), Jun 2010. [14] T. LeBlanc and J. Mellor-Crummey. Debugging Parallel Programs with Instant Replay. IEEE Transactions on Computers, C-36(4), Apr 1987. [15] S. Lu, Z. Li, F. Qin, L. Tan, P. Zhou, and Y. Zhou. BugBench: Benchmarks for Evaluating Bug Detection Tools. In PLDI Workshop on the Evaluation of Software Defect Detection Tools, Jun 2005. [16] C. Luk, R. Cohn, R. Muth, H. Patil, A. Klauser, G. Lowney, S. Wallace, V. J. Reddi, and K. Hazelwood. Pin: Building Customized Program Analysis Tools with Dynamic Instrumentation. In Proceedings of the SIGPLAN Conference on Programming Language Design and Implementation (PLDI), Jun 2005. [17] P. Montesinos, M. Hicks, S. T. King, and J. Torrellas. Capo: A Software-Hardware Interface for Practical Deterministic Multiprocessor Replay. In Proceedings of the 14th International Conference on Architectural Support for Programming Languages and Operating Systems (ASPLOS), Mar 2009. [18] Mozilla.org. Quality Feedback Agent, http://kb.mozillazine.org/Quality Feedback Agent. [19] M. Musuvathi, S. Qadeer, T. Ball, G. Basler, P. Nainar,
120
[20]
[21]
[22]
[23]
[24]
[25]
[26]
[27]
[28]
[29]
[30]
[31]
[32]
[33] [34]
and I. Neamtiu. Finding and Reproducing Heisenbugs in Concurrent Programs. In Proceedings of the 8th Symposium on Operating Systems Design and Implementation (OSDI), Dec 2008. S. Narayanasamy, C. Pereira, and B. Calder. Recording Shared Memory Dependencies Using Strata. In Proceedings of the 12th International Conference on Architectural Support for Programming Languages and Operating Systems (ASPLOS), Oct 2006. S. Narayanasamy, G. Pokam, and B. Calder. BugNet: Continuously Recording Program Execution for Deterministic Replay Debugging. In Proceedings of the 32nd International Symposium on Computer Architecture (ISCA), Jun 2005. R. Netzer and M. Weaver. Optimal Tracing and Incremental Reexecution for Debugging Long-Running Programs. In Proceedings of the SIGPLAN Conference on Programming Language Design and Implementation (PLDI), Jun 1994. S. Osman, D. Subhraveti, G. Su, and J. Nieh. The Design and Implementation of Zap: A System for Migrating Computing Environments. In Proceedings of the 5th Symposium on Operating System Design and Implementation (OSDI), Dec 2002. S. Park, Y. Zhou, W. Xiong, Z. Yin, R. Kaushik, K. H. Lee, and S. Lu. PRES: Probabilistic Replay With Execution Sketching on Multiprocessors. In Proceedings of the 22nd Symposium on Operating Systems Principles (SOSP), Oct 2009. J. H. Perkins, S. Kim, S. Larsen, S. Amarasinghe, J. Bachrach, M. Carbin, C. Pacheco, F. Sherwood, S. Sidiroglou, G. Sullivan, W.-F. Wong, Y. Zibin, M. D. Ernst, and M. Rinard. Automatically Patching Errors in Deployed Software. In Proceedings of the 22nd Symposium on Operating Systems Principles (SOSP), Oct 2009. J. Plank. An Overview of Checkpointing in Uniprocessor and Distributed Systems, Focusing on Implementation and Performance. Technical Report UT-CS-97-372, University of Tennessee, Jul 1997. J. Plank, J. Xu, and R. Netzer. Compressed Differences: An Algorithm for Fast Incremental Checkpointing. Technical Report UT-CS-95-302, University of Tennessee, Aug 1995. M. Ronsse and K. De-Bosschere. RecPlay: A Fully Integrated Practical Record/Replay System. ACM Transactions on Computer Systems, 17(2), May 1999. Y. Saito. Jockey: A User-space Library for Record-Replay Debugging. In Proceedings of the 6th International Symposium on Automated Analysis-Driven Debugging (AADEBUG), Sep 2005. S. Sidiroglou, O. Laadan, C. Perez, N. Viennot, J. Nieh, and A. D. Keromytis. ASSURE: Automatic Software Self-Healing Using Rescue Points. In Proceedings of the 14th International Conference on Architectural Support for Programming Languages and Operating Systems (ASPLOS), Mar 2009. S. Srinivasan, S. Kandula, C. Andrews, and Y. Zhou. Flashback: A Lightweight Extension for Rollback and Deterministic Replay for Software Debugging. In Prooceedings of the 2004 USENIX Annual Technical Conference, Jun 2004. J. Tucek, S. Lu, C. Huang, S. Xanthos, and Y. Zhou. Triage: Diagnosing Production Run Failures at the User’s Site. In Proceedings of the 21st Symposium on Operating Systems Principles (SOSP), Oct 2007. Wikipedia. Dependency Hell, http://en.wikipedia.org/wiki/Dependency hell. M. Xu, R. Bodik, and M. Hill. A Flight Data Recorder for Enabling Full-system Multiprocessor Deterministic Replay. In Proceedings of the 30th International Symposium on Computer Architecture (ISCA), Jun 2003.