International Journal of Scientific & Engineering Research, Volume 6, Issue 8, August-2015 ISSN 2229-5518
448
Recurent Neural Network as a Tool for Parameter Anomaly Detection in Thermal Power Plant A. Hajdarevic, L. Banjanovic-Mehmedovic, I. Dzananovic, F.Mehmedovic, M. Ayaz Ahmad
Abstract— Anomaly detection refers to the problem of finding patterns in data that do not conform to expected behavior. It is very important to timely detect parameter anomalies in real-world running thermal power plant system, which is one of the most complex dynamical systems. Artificial neural networks are one of anomaly detection techniques. This paper presents the Elman recurrent neural network as method to solve the problem of parameter anomaly detection in selected sections of thermal power plant (steam superheaters and steam drum). Inputs for neural networks are some of the most important process variables of these sections. In addition to the implementation of this network for anomaly detection, the effect of key parameter change on anomaly detection results is also shown. Results confirm that recurrent neural network is good approach for anomaly detection problem, especially in real-time industrial applications. Index Terms— Anomaly detection, Industrial application, Recurrent neural network, Thermal power plant
——————————
——————————
1 INTRODUCTION
A
nomaly detection refers to detecting patterns in a given data set that don't conform to an established normal behavior. The patterns thus detected are called anomalies [1]. Anomalies are also referred to as outliers. Conventional anomaly detection techniques have been used for a long time, but with the development of computer technology modern anomaly detection techniques can be developed. Machine learning techniques could detect outliers in data sets form a variety fields [2, 3]. Some of those techniques are: distance based technique (k-nearest neighbor), Support Vector Machines, Principal Component Analisys (PCA), neural networks, cluster analysis, Markov Chain Monte Carlo based method [2]. The application of neural networks for anomaly detection in power plants is considered in papers [4] and [5]. The comparison between neural networks based and statistical anomaly detection techniques can be found in [6]. Neural networks in combination with fuzzy logic for anomaly detection are considered in [7]. Multiple types of neural networks could be used for anomaly detections: MLP neural networks, recurrent neural networks (RNN), probabilistic neural networks, etc. If the neural network is created to detect anomalies in the system, reaction time on the anomaly could be significantly reduced. This would provide greater system stability and therefore fewer losses. This paper presents one of the possible solutions to the
anomaly detection problem in boiler system using Elman recurrent neural network. Given the complexity of the system, because of necessary simplification, only some characteristic sections and some characteristic process variables were selected. All of the input data that are used are coming from the system for monitoring and control present in Thermal Power Plant "Tuzla", Bosnia and Herzegovina.
IJSER
————————————————
A. Hajdarevic is Process Engineer in Thermal Power Plant, Tuzla, Bosnia and Herzegowina, E-mail:
[email protected] L. Banjanovic-Mehmedovic is an Associate Professor at Faculty of Electrical Engineering, Department of Automation and Robotics, University of Tuzla , Bosnia and Herzegowina, E-mail:
[email protected] I. Dzananovic is Manager in Thermal Power Plant, Tuzla, Bosnia and Herzegowina, E-mail:
[email protected] F.Mehmedovic is Strategic Manager in ABB, Ltd. Representative Office in Tuzla, Bosnia and Herzegovina, Email:
[email protected] M. Ayaz Ahmad is an Assistant Professor Faculty of Science, Physics Department, University of Tabuk, Saudi Arabi, E-mail:
[email protected]
2 SELECTED SECTIONS OF THERMAL POWER PLANT
With around 40% share in global electricity production, thermal power plants are still significant power generation facilities, although their influence is reduced in favor of the renewable energy plants. Adequate control of thermal power plant units is necessary for the system to function properly, since improper functioning of the system may result in electricity supply interruption and financial losses for electricity producers. A thermal power plant, as a large and complex system, consists of multiple smaller systems that work together and ensure continuous electricity generation. This paper is focused on one of the main systems of every thermal power plant and that is the boiler. The boiler is one of the most important systems in a thermal power plant because of its role in electricity generation [8], [9]. The boiler represents the entire system that participates in the conversion of water into steam. A single division of the boiler system into individual sections does not exist, because many sections are connected and there is often no clear distinction between them. In this paper, the division is made according to available process images with certain corrections concerning data availability. A rough block diagram is shown in Figure 1. It shows important boiler sections and selected sections of the boiler (Steam Superheaters and Drums) for anomaly detection. It also shows (some) connections between the sections.
IJSER © 2015 http://www.ijser.org
International Journal of Scientific & Engineering Research Volume 6, Issue 8 August-2015
449
ISSN 2229-5518
Fig. 1. Block diagram of boiler sections (some turbine sections included).
Fig. 2. Process image of Water-Steam System.
From the above, it is clear that the malfunction of any part in boiler system affects the operation of thermal power plant. Outage of some part or the whole thermal power plant unit can often be avoided with timely anomaly detection.
steam to the turbine. This system has a major role in removing moisture from the steam, which improves its quality. The temperature of steam generated in the drum still doesn't match the temperature needed in the process. The steam generated in the drum still contains a certain percentage of moisture. Such steam should not be distributed to the turbine due to the possibility of condensation on the blades. In every thermal power plant, there is a tendency to produce 100% quality steam. Because of that, the steam is heated in this system using flue gases. Increasing the steam temperature results in removal of moisture from the steam and that is the primary goal of this system. The steam temperature is increased by around 160°C compared to steam temperature in the drum. The goal of the system is to maintain the temperature around 535°C, which is optimal for boiler analyzed in this paper.
IJSER
2.1 Water - Steam System This system is primarily engaged in converting water into steam and consists of multiple subsystems with separate functions. The system consists of multiple pipes and vessels. Heat exchange between different media occurs in this system in order to achieve optimal steam parameters. The steam is driven further to the turbine propelling it, which is essential for electricity generation. Process image of the water-steam system is shown in Figure 2. Given that the quality and parameters of steam directly affect the electricity generation, anomaly detection in this system is of great importance for the plant. The most important measurements of process variables related to steam are temperature, pressure and steam flow which directly affects the current power output. 2.2 Feed - Water System One of the important subsystems of the boiler is the system for its feedwater supply, because without the feedwater supply there is no steam generation. After the raw water is treated at the chemical water treatment plant, the water is stored in the feedwater tank. The water is distributed further from the tank into the feedwater pipe system using feedwater pumps. The pumps maintain the specified feedwater flow which is determined by the required power output. The purpose of this system is distribution of feedwater to the most important subsystem of the water-steam system – the steam drum. 2.3 Steam Superheaters The steam generated in the steam drum is distributed through this system. After distribution of steam through this system, it is called the superheated steam. Steam superheaters system consists of pipes mounted in the boiler that distribute the
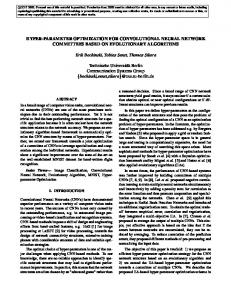
2.4 Staem Drum The most important subsystem of the water-steam system is the steam drum, which is a large tank with the task of steam extraction from a water-steam mixture stored in the drum, which is shown as in Figure 3. Given the importance of the drum for electricity generation, it is logical that timely anomaly detection is required in this system. The most important process variable in the drum is the water level. In addition to that, steam pressure, conductivity and pH value are also measured.
3 ANOMALY DETECTION TECHNIQUES The importance of anomaly detection is due to the fact that anomalies in data translate to significant actionable information in a wide variety of application domains, from CyberIntrusion Detection, to Industrial Demage Detection and Sensor Networks [1]. Anomaly detection techniques division can be done in multiple ways [10, 11]. Based on the means of acquiring knowledge anomaly detection techniques can operate in one of the following three modes: supervised, semi-supervised
IJSER © 2015 http://www.ijser.org
International Journal of Scientific & Engineering Research Volume 6, Issue 8 August-2015
450
ISSN 2229-5518
largely depends on number of neurons and it also depends on number of hidden layers. Neural networks are trained with normal instances and anomalous instances. After that the network should be able to determine anomalous instances in a test data set.
4 RECURRENT NEURAL NETWORK Recurrent neural networks (RNN) use a feedback loop in their hidden layers. The recurrent neural networks also calculate the activation function value, like feedforward neural networks do. However, an input to the network represents not only the current input, but also a state of the network before the current input is provided. That means that after a number of iterations, an output value will be a function of all of the inputs provided to that iteration. At any point, an activation function output propagates forward through one hidden layer. Once the output is present, it continues to propagate through the network, even if a new input is not present. It is possible to use an array of data as neural network input and get the output as a function of the whole array. Therefore, this type of network can be used to solve complex problems that some feedforward networks cannot solve, but the downside is that some additional learning difficulties may occur. A recurrent neural network used as parameter anomaly detection tool in this paper is the Elman recurrent artificial neural network (named after its creator – Jeffrey L. Elman, 1990) that was developed from the Jordan recurrent network. These two types of neural networks are also called simple recurrent networks (SRN). Elman neural network usually has only one hidden layer with a feedback loop, but multiple hidden layers can be also used. The feedback loop present in this type of neural network returns a hidden layer output value which is used as an input for the next iteration. That is how the hidden layer acquires information about the state of the network. An example of Elman neural network is shown in Figure 4. Activation functions in hidden and output layers are very similar to the MLP neural network (a tansigmoid function is used in the hidden layer while a linear function is used in the output layer).
IJSER
Fig. 3. A steam drum cross-section.
and unsupervised. Techniques that operate in unsupervised mode detect anomalies by analyzing an unlabeled data set and making an implicit assumption that majority of the data set represents normal instances. Anomalous data is the data that least fits the characteristics of the data set. Techniques that operate in semi-supervised mode build a model for the class corresponding to normal behavior. Then the model is used to identify anomalies in the test data. Techniques that operate in supervised mode require two data sets, one labeled as normal behavior and the other labeled as anomaly. Then it is needed to train the classifier that determines if the test data belongs to the class labeled as normal behavior. In addition to this division, there is also another division that is used in this paper, proposed in [1]. It is division based on anomaly type and classifies anomaly detection techniques in one of the following three groups: point anomaly detection techniques, contextual anomaly detection techniques and collective anomaly detection techniques. If an individual data instance from a data set can be considered as anomalous with respect to the rest of data, then such instance can be classified as a point anomaly. Classification is used to learn a model from a set of labeled data instances (training data set). After that, the model is used to classify a test instance into one of the classes. These techniques operate under the assumption that there is enough data in the training data set, so the classifier can learn how to classify test data [11]. Commonly used classification based anomaly detection techniques are: rule based techniques, neural networks based techniques and support vector machines (SVM) based techniques. The focus of this paper is point anomaly detection technique using neural network. Neural network performance
Fig. 4. An example of Elman recurrent artificial neural network.
A simple explanation of how an input propagates through the network can be divided into four steps. In the first step, the network input is accepted. In the second step, the network calculates activation function values in the hidden layer where
IJSER © 2015 http://www.ijser.org
451
International Journal of Scientific & Engineering Research Volume 6, Issue 8 August-2015 ISSN 2229-5518
the current iteration data and previous iterations data is used. This is followed by calculating activation function values in the output layer. The last step includes copying of activation function values from the hidden layer into a special layer called the copy layer. The copy layer represents the feedback loop which is essential for this type of neural network. More complex versions of recurrent neural networks can have more than one such layer. An algorithm similar to the BP algorithm mentioned before is presented in [12]. Nonlinear function of output node are:
( + 1) =
where
( )=
(1)
( )
|
Notation for indexing of nodes are:
( )
(2)
( ), 0 < < ( ), 0 < < The errors of output node are: ( ) ( ), ( ) ( )= 0 , In order for this algorithm to work, values: ( ) ( )= ( )=
(3) (4)
)
=
( )
where parameters
ik
are defined as:
Behavior
Normal
Anomalous
Normal
True positive
False positive
Anomalous
False negative
True negative
It is evident that there are four possible outcomes of anomaly detection. True positive (TP) and true negative (TN) outcomes represent a correct classification, while false negative (FN) and false positive (FP) outcomes represent an incorrect one. Both types of incorrect classifications represent a hazard. False positives can cause an action which is not needed, but false negatives are actually more dangerous because an anomaly would be ignored. Based on these counts, the following perfomance metrics are calculated (all expresed as a percentage): 1. Accuracy (ACC). 2.
+
( )
(6)
1, = (7) 0, As nodes of the hidden layer are not fully connected to the ones in the summation layer, a selection process is necessary. Hidden layer node outputs are calculated as follows: ( )= ( ) ( ). (8) and the total synaptic weight adjustment is calculated as: =
Desired
Actual
+ (10) + + + Sensitivity or true positive rate (TPR) or recall. =
IJSER ( )
=
Outcome
(5)
could be presented in next form (j represens a node): (
TABLE 1 POSSIBLE FORMS OF ONE-CLASS CLASSIFICATION PROBLEMS
( ).
(9)
3. 4. 5.
6.
=
+ Specificity or true negative rate (TNR).
(12) + Precision (PR) or positive predictive value (PPV). =
=
+ Negative predictive value (NPR). =
F1 score.
1=
5 EVALUTATION OF ACQUIRED KNOWLEDGE The purpose of the assessment is to determine which type of neural network fits best for some classification problem. Therefore the evaluation of acquired knowledge is an important part of neural network application. During this process, it is needed to determine which verification and validation measures will be used. Different types of these measures exist through specific application [13], [14], [15] and some of them are applied in this paper.
5.1 Results Verification There are several different measures used for result verification. Selection of the most appropriate one is always conditioned with the actual problem. This corresponds to the aim of this paper, because neural networks used for anomaly detection in this paper are trained as one-class classifiers. Table 1 provides an overview of possible outcomes of one-class classification problem solution.
(11)
2
2 +
+ +
(13) (14) (15)
5.2 Results Validation Result validation techniques are mainly linked to neural networks if an input data set is not large enough. In addition to that, they are used to test a neural network with some random sample from the data set. If the data set is large enough, which does not guarantee the neural network will be trained properly. This is due to a possibility of overfitting the network with a large number of similar instances. If that occurs, the neural network could treat some noise as an anomaly. In order to prevent this, some kind of result validation should be performed. Result validation techniques can also show if the neural network parameters are good enough. Commonly used result validation techniques are: cross-validation, regularization, early stopping etc. Result validation techniques are not exclusively used with neural networks. They are also used with other anomaly detection techniques and with value prediction techniques.
IJSER © 2015 http://www.ijser.org
452
International Journal of Scientific & Engineering Research Volume 6, Issue 8 August-2015 ISSN 2229-5518
The most popular result validation technique is crossvalidation [16]. The idea is to separate the available data into a training data set (usually 80% to 90% of the data) and a test data set (the remaining 10% to 20% of the data). The simplest form of cross-validation randomly separates the available data into a single training set and a single test set. It is a risky approach, because an unlucky split could lead to an ineffective neural network. A better approach would be to repeat the previous procedure multiple times, but this approach is also risky because there is a chance that some instances could be used only for training and never for testing, or vise versa. This technique was called k-fold cross-validation. The idea behind k-fold cross-validation is to divide all the available data into k roughly equal-sized groups. In each iteration of k-fold cross-validation, k-1 groups are used for training and the remaining one is used for testing. The k-fold crossvalidation iterates through a number of folds. After the first iteration, the next group is used for testing, and the remaining data are used for training. This procedure repeats until all of the groups are used for testing once. The main advantage of k-fold cross-validation compared to other techniques is utilization of all the available data in the process. In addition to that, system requirements for this type of validation are not very high. Therefore, this technique is more convenient than other iteration based techniques. The main disadvantage is the potential for different validation results due to stochastic process of group forming at the beginning of the validation process. The k-fold cross-validation can give different results each time it is performed. This can be avoided by repeating the process multiple times and using the mean validation result.
ed steam cooling water flow (CWF). The variables from the steam drums are: drum level (DL), drum pressure (DP) and feedwater flow (FWF). All of the input data come from an actual system for monitoring and control present in unit 4 of Thermal Power Plant "Tuzla" with the sampling period of 1 s. There are 962 instances that represent normal behavior and the same amount representing anomalous behavior in the input data set. That makes a total of 1924 instances for each section. Given that, the 10-fold cross-validation isn't necessary because the data set is not large enough, but to test the neural networks with more random data sets. The data set is divided into a training data set (70% of the data), a validation data set (15% of the data) and a test data set (15% of the data). Statistical parameters of process variables for normal and anomaly date set (for the steam superheaters and the steam drums) are presented in Table 2 and Table 3. The data are separated on the ones representing normal behavior and the ones representing anomalous behavior. There are significant differences in the values representing different behaviors, depending on the variable and the section. The differences between the process variables can be best seen in the tables TABLE 2 VALUES OF PROCESS VALUES FOR STEAM SUPERHEATERS
IJSER
6 RESULTS AND DISCUSSION
Process sets for normal behavior
Input variable TS I [°C] FS I [t/h] CWF I [t/h] TS II [°C] FS II [t/h] CWF II [t/h]
Min. value
Max. value
Mean
532.67 282.17 53.18 531.10 277.63 59.18
543.93 301.52 67.36 542.37 291.84 66.31
537.63 294.24 63.23 537.34 285.79 62.62
Stand. deviation 1.74 4.44 3.83 1.72 3.30 1.73
Process sets for anomaly behavior
The results are presented as a set of different verification measures which show the effect of important parameters change. Given that the k-fold cross-validation technique is mentioned in the paper, in addition to the test results, 10-fold cross-validation results are also presented. Scores of an ideal classification would all be the same (1), except TPR and TNR (0.5 – their sum is always 1). Given that the initial synaptic weights are chosen randomly, it is possible to obtain different results if a neural network is trained and tested multiple times. Therefore, all of the obtained results are obtained from average confusion matrices (average of multiple training and testing cycles).
6.1 Neural Network Input Data Neural networks were applied to data from two sections of the boiler, the steam superheaters and the steam drums. These sections consist of two separate systems each, which produce steam of adequate quality together. Process variables used in this paper represent both systems (I and II). The process variables from the steam superheaters are: superheated steam temperature (TS), superheated steam flow (FS) and superheat-
TS I [°C] FS I [t/h] CWF I [t/h] TS II [°C] FS II [t/h] CWF II [t/h]
521.74 279.96 38.82 526.59 278.64 43.56
553.96 310.24 86.19 546.76 315.68 86.10
537.55 292.77 63.08 537.21 295.55 70.41
7.30 6.31 12.62 5.63 8.66 10.12
TABLE 3 VALUES OF PROCESS VALUES FOR STEAM DRUMS Process sets for normal behavior Input variable DL I [°C] DP I [t/h] FWF I [t/h] DL II [°C] DP II [t/h] FWF II [t/h]
Min. value
Max. value
Mean
81.02 133.05 224.60 76.63 133.20 208.08
119.39 137.08 252.12 120.09 137.52 239.56
97.21 135.64 241.50 104.05 135.07 218.28
Stand. deviation 8.30 0.97 7.70 9.53 0.79 7.96
Process sets for anomaly behavior DL I [°C] DP I [t/h] FWF I [t/h] DL II [°C] DP II [t/h] FWF II [t/h]
IJSER © 2015 http://www.ijser.org
42.71 135.65 216.84 55.57 136.65 220.24
129.39 143.80 291.92 112.25 144.02 268.96
85.41 141.22 245.16 84.11 141.62 241.71
20.23 2.10 17.17 15.33 2.13 16.50
International Journal of Scientific & Engineering Research Volume 6, Issue 8 August-2015
453
ISSN 2229-5518
showing variance and standard deviation for each process variable.
increasing the value of momentum can decrease the performance.
6.2 Results of Elman Recurrent Neural Network Application As type of recurrent neural network used for parameter anomaly detection is the Elman recurrent neural network. Results are obtained by network parameter changes. The parameters used are: number of neurons in hidden layers, learning rate, number of epochs and momentum. The basic Elman neural network learning algorithm uses momentum. In addition to that, the algorithm can perform an adaptive learning rate adjustment. All of the changes were performed in five steps. The initial parameters of Elman neural network are: the number of neurons in hidden layer is 10, there are 3 hidden layers etc. The initial number of epochs is 50 and it is increased to 250. The initial momentum value is 0.9, the value is decreased to 0.1 for this parameter. The results of Elman neural networks application for anomaly detection in the steam superheaters are shown in the following tables (only the best ones for each parameter change (Table 4 and Table 5). Increasing the value of any parameter generally leads to better results. However, there is an exception. There is a performance drop upon increasing the learning rate value if the value is greater than 0.1. As for the number of neurons, there is only a slight improvement if the number is greater than 25, and the same goes for the number of epochs (greater than 200). Also it is shown that the best results can be achieved if the momentum value is 0.9 (maximum recommended value). However, great care is needed if the value of this parameter is increased. If the other values are greater than the initial ones,
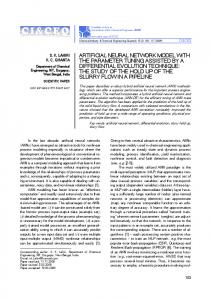
The inputs from Steam Superheats for neural networks (randomly distributed within a certain type of behavior) and Elman recurrent neural network classification outputs are shown in Figure 5. The figure is shown for a network with 15 neurons per hidden layer, 150 epochs in the training phase and the learning rate value of 0.01. The momentum value for the network is 0.9. Although the Elman neural networks give good results, a big number of false positive classificatons is noticable. This is compensated by reducing the number of false negative classifications, which is more important.
IJSER
TABLE 4
STATISTICAL VALUES OF VERIFICATION RESULTS FOR SECTION STEAM SUPERHEATERS
Measure
Number of neurons= 30
ACC TPR TNR PR NPR F1
0.8827 0.5535 0.4465 0.8152 0.9837 0.8929
Learning rate = 0.05 0.9129 0.5265 0.4735 0.8663 0.9710 0.9169
Number of epochs = 250
Momentum = 0.9
0.9735 0.5102 0.4898 0.9615 0.9863 0.9740
0.8046 0.5587 0.4413 0.7582 0.8720 0.8214
TABLE 5 STATISTICAL VALUES OF TESTING RESULTS FOR SECTION STEAM DRUMS
Measure
Number of neurons = 30
ACC TPR TNR PR NPR F1
0.8771 0.5645 0.4355 0.8075 0.9874 0.8896
Learning rate = 0.1 0.9226 0.5333 0.4667 0.8763 0.9818 0.9271
Number of epochs = 200
Momentum = 0.9
0.9833 0.5067 0.4933 0.9709 0.9964 0.9836
0.8101 0.5701 0.4299 0.7527 0.9012 0.8294
Fig. 5. Anomaly detection using Elman recurrent network for Steam Superheaters.
As for the superheater, same parameter changes were performed for stream drums in order to show their effect on classification results. The results are shown in the following tables (Table 6 and Table 7). The conclusion presented after the steam superheaters results generally applies to this section as well. However, there is a difference. The performance drop upon increasing the learning rate value is not so big, but it is still noticable. It is also noticable that the Elman neural networks give better
IJSER © 2015 http://www.ijser.org
International Journal of Scientific & Engineering Research Volume 6, Issue 8 August-2015
454
ISSN 2229-5518
TABLE 6 STATISTICAL VALUES OF VERIFICATION RESULTS FOR SECTION STEAM SUPERHEATERS
Measure
Number of neurons = 30
ACC TPR TNR PR NPR F1
0.9479 0.5155 0.4845 0.9091 0.9930 0.9494
Learning rate = 0.1 0.9674 0.4983 0.5017 0.9737 0.9613 0.9673
Number of epochs = 150
Momentum = 0.9
0.9836 0.4983 0.5017 0.9933 0.9740 0.9835
0.9307 0.5319 0.4681 0.8824 0.9925 0.9346
results for this section compared to the steam superheaters. TABLE 7 STATISTICAL VALUES OF TESTING RESULTS FOR SECTION STEAM DRUMS
Measure
Number of neurons = 25
ACC TPR TNR PR NPR F1
0.9573 0.5198 0.4802 0.9251 0.9947 0.9588
Learning rate = 0.05 0.9778 0.4964 0.5036 0.9845 0.9712 0.9776
Number of epochs = 200
Momentum = 0.9
0.9747 0.4963 0.5037 0.9817 0.9678 0.9745
0.9450 0.5227 0.4773 0.9137 0.9819 0.9473
IJSER
The reason for that is the data used.
Following the example shown in Figure 5, anomaly detection with Elman recurrent network for input test data from Steam Drums is shown in Figure 6. The figure is shown for one of the possible parameter combinations which provide good results (25 neurons per hidden layer, 150 epochs, the learning rate value is 0.1 and the momentum value is 0.9). The number of false negatives is greater than the number of false positives in some cases, which is noticable by TPR and TNR ratio analysis. However those values are still quite low and because it can be conclued that the Elman neural networks can provide good results for this section.
7. CONCLUSION In this paper the Elman recurrent neural network was tested with data from real-time thermal power system to explore possibilities of anomaly detection. An anomaly in any part of the boiler affects the operation of thermal power plant unit. Malfunctions can be prevented by timely anomaly detection. Given the system complexity, for the purpose of necessary simplification, only some of the characteristic boiler sections and process variables from those sections were selected for further analysis. All of the input data come from an actual system for monitoring and control present in Thermal Power Plant "Tuzla". Our preliminary results of the application of recurrent neural network to anomaly detection indicate their potential for power generation process control in a thermal power
Fig. 6. Anomaly detection using Elman recurrent network for Steam Drums.
plant. Due to the fact that the data are divided so that the very beginning of anomalous state is represented in anomalous data instances, neural networks could be used as a tool for early anomaly detection. Given that, an anomaly reaction time could be significantly reduced. That would provide greater system stability and therefore fewer losses. Of course, neural networks could not do the job on their own, because a single misclassification could seriously threaten the system, but with the help of conventional automation excellent results could be achieved and the impact of neural networks on parameter anomaly detection results would not be negligible. Only some data from large sections of the boiler were included in the analysis provided in this paper. In an actual application of neural networks for parameter anomaly detection in thermal power plant, data from many other (smaller) sections should be included.
IJSER © 2015 http://www.ijser.org
International Journal of Scientific & Engineering Research Volume 6, Issue 8 August-2015
455
ISSN 2229-5518
[11] K. Hempstalk, E. Frank, "Discriminating Against New Classes: OneClass versus Multi Class Classification", AI 2008: Advances in Artificial Intelligence Lecture Notes in Computer Science, Vol. 5360, 2008. [12] G. Orr, N. Schraudolph, F. Cummins, "Neural Networks – Lecture Notes", Department of Computer Science, Willamette University, Salem, OR, USA, 1999. [13] J. Han, M. Kamber, "Data mining: concepts and techniques" Morgan Kaufmann, San Francisco, 2006. [14] I. H. Witten, E. Frank, "Data Mining: Practical machine learning tools and techniques", 2nd ed., Morgan Kaufmann, San Francisco, 2005. [15] M. Suljic, L. Banjanovic-Mehmedovic, I. Dzananovic, “Determination of coal quality using Artificial Intelligence Algorithms”, Journal of Scientific and Industrial Research (JSIR), vol. 72 (06), 2013. [16] J. McCaffrey, "Understanding and Using K-Fold Cross Validation for Neural Networks", Visual Studio Magazine, 2013, available at https://visualstudiomagazine.com/articles/2013/10/01/understandingand-using-kfold.aspx
LIST OF NOMENCLATURE Symbol
Represent to / or meanings
TS I [°C] FS I [t/h]
superheated steam temperature from system I superheated steam flow from system I superheated steam cooling water flow from system I superheated steam temperature from system II superheated steam flow from system II superheated steam cooling water flow from system II drum level from system I drum pressure from system I feedwater flow from system I drum level from system II drum pressure from system II feedwater flow from system II accuracy/the proportion of correctly classified instances against all (correctly and incorrectly classified) instances sensitivity or true positive rate; recall specificity or true negative rate precision in positive outcomes/positive predictive value precision in negative outcomes/negative predictive value F1 score
CWF I [t/h] TS II [°C] FS II [t/h] CWF II [t/h] DL I [°C] DP I [t/h] FWF I [t/h] DL II [°C] DP II [t/h] FWF II [t/h] ACC TPR TNR PR/PPV NPR F1
REFERENCES [1]
IJSER
V. Chandola, A. Banerjee, V. Kumor, "Anomaly Detection: A Survay", ACM Computer Surveys, vol. 41(3), 2009. [2] T. Ahmed, B. Oreshkin, M. Coates, "Machine Learning Approaches to Network Anomaly Detection", 2nd USENIX Workshop on Tackling Computer Systems Problems with Machine Learning Techniques (SysML), Cambridge, MA, USA, 2007. [3] S.X. Wu, W. Banzhaf, "The Use of Computional Intelligence in Intrusion Detection Systems: A Review", Applied Soft Computing, vol. 10, issue 1, 2010. [4] Z. Liu, W. Gao, "Wind Power Plant Prediction by using Neural Networks", IEEE Energy Conversion Conference and Exposition, USA, 2012. [5] A. Kusiak, Z. Song, "Sensor Fault Detection in Power Plants", Journal of Energy Engineering ASCE, 2009. [6] A. Kumar, A. Banerjee, A. Srivastava, N. Goel, A. Goel, "Gas Turbine Engine Operational Data Analysis for Anomaly Detection: Statistical vs. Neural Network Approach", 26th Canadian Conference of Electrical and Computer Engineering (CCECE), Canada, 2013. [7] F. Amiri, C. Lucas, N. Yazdani, "Anomaly Detection using Neuro Fuzzy System", World Academy of Science, Engineering and Technology, vol. 3, 2009. [8] J.B. Kitto, S.C. Stultz, "Steam: It's Generation and Use", The Babcock & Wilcox Company, Edition 41, 2005. [9] G.F. Gilman, "Boiler Control Systems Engineering", International Society of Automation (ISA), Second Edition, 2010. [10] V.J. Hodge, J. Austin, "A Survey of Outlier Detection Methodologies", Dept. of Computer Science, University of York, York, UK, 2004.
IJSER © 2015 http://www.ijser.org